Published
On the Importance of Trade Openness
By: Lucian Cernat
Subjects: EU Trade Agreements European Union North-America Regions

*Disclaimer: the views expressed herein are those of the author and do not represent an official position by the European Commission.
Competitiveness concerns are back to the fore. The FT has recently warned that Europe faces a “competitiveness crisis“, especially when compared to the United States, where productivity growth is projected to remain higher than in Europe for years to come. The alarm bells concerning EU’s economic underperformance have been sounding for a while now. Germany, the main economic engine for the European Union is slowing down and is faced with multiple challenges. Furthermore, the economic slowdown seems more widespread than Germany alone.
When overall economic activity slows down, that has an impact on overall trade activity as well. And when productivity lags behind those of other trading partners, one can only expect dim prospects for trade performance.
If grim overall macroeconomic trends were not enough, let us look at the other clouds on the trade horizon: wars, geopolitical tensions, the Red Sea disruptions, the fragmentation of global supply chains, and the list could go on. The WTO data indicates that the volume of world merchandise trade fell by 0.4% in the third quarter of 2023, compared to the previous quarter and was down 2.5%, compared to the same period in 2022. The latest UNCTAD Global Trade Update estimated a negative growth rate in global trade value, with a 3% overall decline.
So, is there anything else that could still offer a glimmer of trade hope and optimism? Expanding the range of key trade performance indicators might offer additional insights. Even standard indicators can sometimes be an eye-opener. Take, for instance, trade openness (defined as the ratio of total trade in goods and services over GDP). Against the background of gloomy news and dire economic prospects, the historical trend in EU trade openness, especially as compared to the United States, is an eye opener.
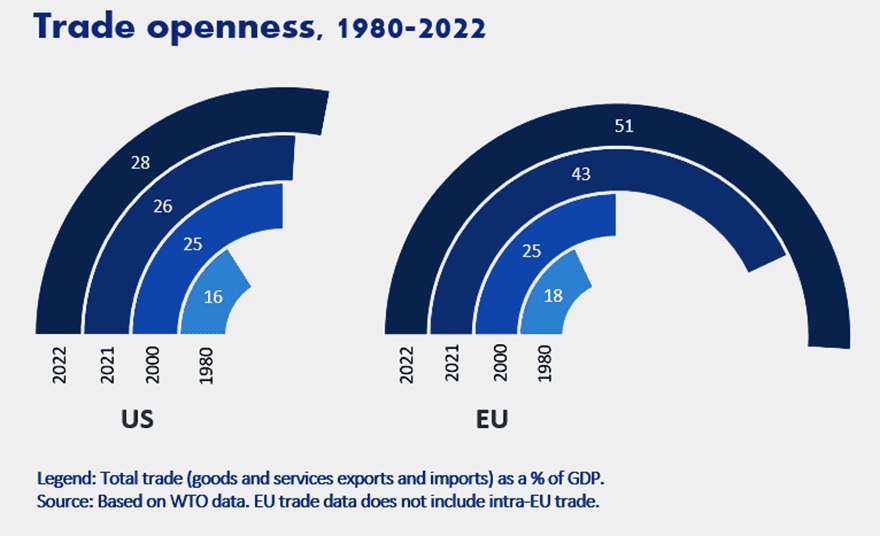
Figure 1. Trends in trade openness: EU vs US

While for several decades the trade openness of the US and EU economies were at similar levels, the two major trading blocs stand nowadays in sharp contrast. The US trade openness has seen a steady but small increase over time, reaching in 2022 28% of GDP. In contrast, the EU trade openness increased spectacularly in recent years and in 2022 stood at 51% of GDP.
Needless to say, there can be countless factors behind this divergent evolution. Let us examine some plausible explanations. One such explanation could be that the difference in trade openness would have something to do with China. Surely, China is a big part of the increase in trade openness ratios over time for many trading partners. But the “China factor” is similarly important for both the US and EU and cannot fully explain such sharp, diverging trends. Even the recent “trade war” between the US and China, as research by Peterson Institute has shown, did not really affect total US trade values, as the decline in US imports from China was replaced by trade with other nations.
One explanation for the sharp increase in EU trade openness might be seen as a “Brexit effect”, since after 2020 the intra-EU trade between EU27 and the UK has been shifted to extra-EU trade. This is clearly a factor that led to an increase in EU trade openness, but the value of EU-UK bilateral trade adds only about 6 percentage points to the EU trade openness ratio in Figure 1, and does not fundamentally change the overall picture.
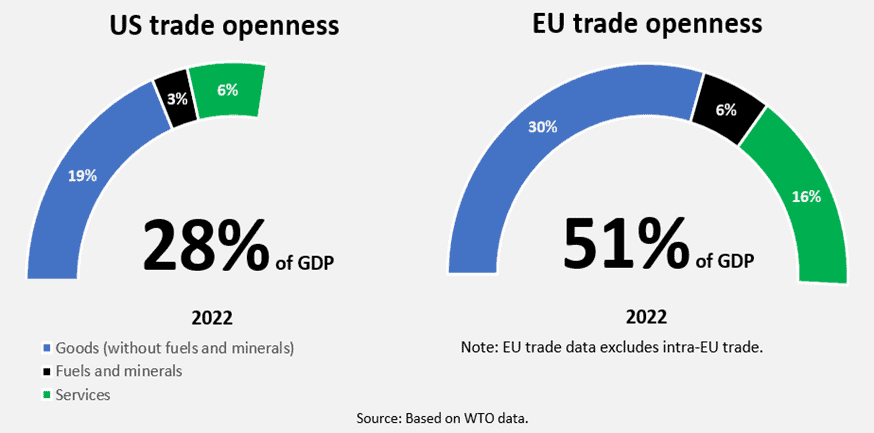
Another factor that would come to mind is trade in fuels and minerals. The war in Ukraine and the soaring energy prices in Europe clearly had an impact on import values, and this could artificially inflate EU trade openness. To disentangle this factor, the trade openness ratio can be split for the three main trade categories: (i) goods (without fuels and minerals), (ii) fuels and minerals, and (iii) services. Figure 2 presents this trade openness breakdown.
Figure 2. Trade openness by major category: goods, fuels and minerals, and services

As Figure 2 shows, fuels and minerals do not explain the trade openness difference between the EU and US. Instead, both trade in goods and trade in services contribute significantly to this trade openness gap. Proportionally, EU trade openness in services stands out even more than trade in goods.
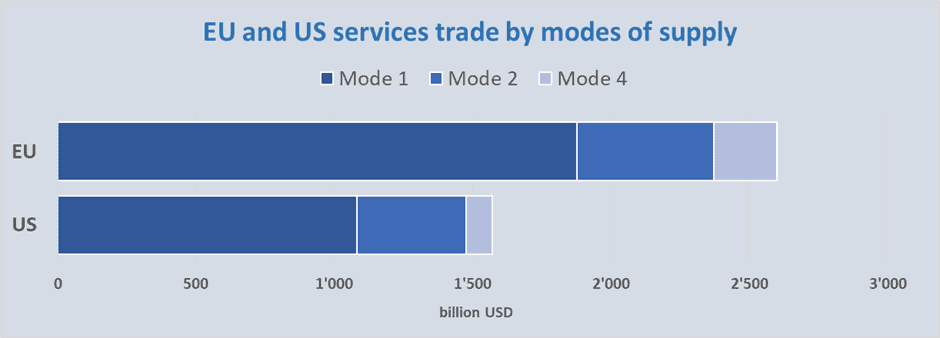
One possibility is that certain GATS modes of supply could account for this stark difference. Based on the WTO TISMOS database, we can infer the contribution of various modes of supply to both EU and US services trade. Figure 3 shows the relative importance of mode 1, 2, and 4 in total services trade. Mode 3 is not included as the Balance of Payments data commonly used for official trade in services statistics does not include this FDI-driven mode of supply.
Figure 3. EU and US services trade by modes of supply

Source: Based on Eurostat, BEA and WTO TISMOS data.
Mode 1 stands out as the primary driver of the much larger trade openness in services for the EU. For many, mode 1 is synonymous with digital services (e.g. other business services, financial and telecom services, software development, cloud computing, etc.). However, mode 1 services statistics also include transport services, which account for around a quarter of the total EU mode 1 services exports. And transport services, obviously, are correlated with trade in goods openness. More goods exported or imported lead to more transport services and a higher mode 1 services share.
Apart from such economic forces, some trade policy differences are also likely candidates for explanatory variables behind the recent evolution in the EU’s trade openness. One important factor is that the EU has continued to build over the last years a wide network of preferential trade relations with over 75 countries around the world. The EU also offers unilateral preferential access to its Single Market for 65 developing countries, including 47 LDCs. And both unilateral preferences and FTAs offer a boost to the EU trade openness ratio. An ex post assessment indicates that EU trade (imports and exports) with Colombia, Peru and Ecuador increased by over 4bn euros, as a result of the FTA with those countries. Other EU FTAs with key trading partners, such as CETA, also made a difference in bilateral trade activity. The fact that the US has fewer FTAs in place and had limited its current bilateral negotiating agenda may partly explain the divergence in trade openness. At the same time, both the EU and US have thousands of trade “mini-deals” in place that do facilitate trade with many countries. The effects of this “invisible” trade policy on trade openness still requires further analysis.
This brings us to an important question: is trade policy really the key to understand this large trade openness gap? While the EU trade-to-GDP ratio above 50% may seem excessive to some, it is by no means exceptional. Switzerland’s trade openness ratio is 140% and the UK is at 70%. Even developing countries with very different trade policies and a more ambivalent attitude vis-a-vis an open trade agenda have relatively high trade openness ratios. India’s trade openness, for instance, is 49%. South Africa’s trade-to-GDP ratio stood at 65%.
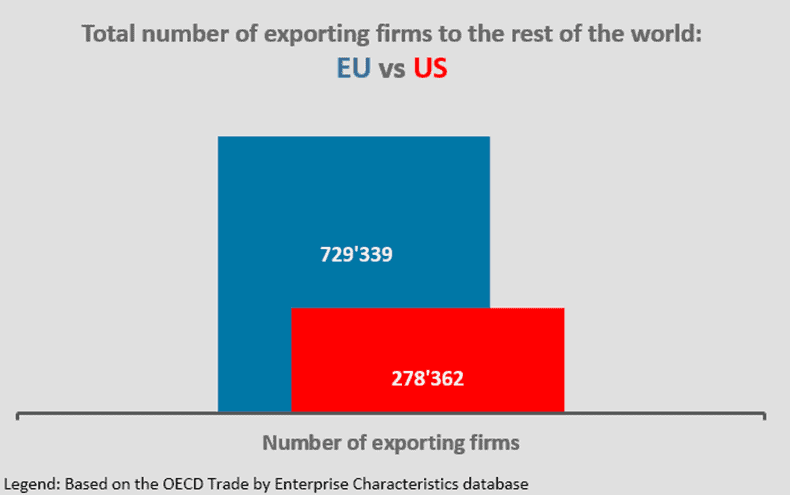
This proves that trade policy alone cannot fully explain levels of trade openness. Additional insights can be gained if one dives into the micro-foundations of trade performance. Firm behavior can offer a powerful explanation for some of these trade openness discrepancies across countries. Take again the case of the EU and US trade openness. One less obvious but corroborating fact with trade openness is the total number of EU and US exporters (Figure 4). The EU has 2.6 times more exporters than the US. Having a large number of firms participating in international trade is clearly important for trade openness.
Figure 4. Number of exporting firms: EU vs US

While all eyes are focused on macro-trends, such as total trade flows and the billions they generate, the micro-foundations of trade openness start at firm level. A growing number of firms engaged in international trade (as exporters, importers, or two-way traders) would boost trade openness. While the jury is still out on whether trade participation boosts productivity or vice-versa, we can skip that debate if we are interested only in a simpler fact: the firms that engage in international trade are more productive than those that do not. That simple truth should be enough to consider trade demographics and firm-level trade statistics as part of the key performance indicators needed to monitor global competitiveness and trade policy objectives.
These are just some likely explanations for the stark difference in trade openness between the EU and the US. Yet, that is perhaps besides the point, as there is no right or wrong trade openness ratio. The more important conclusion is that, regardless of overall trade openness levels, transatlantic trade remains a major driver for economic growth and prosperity in the US and Europe alike. Millions of jobs for American and European workers are dependent on this strong transatlantic trade. Trade is correlated with higher productivity and higher wages. Let us ensure that a worker-centric trade policy leads to more, and better paid jobs supported by transatlantic trade!
where to find the previous studies to the treatment EU-Mercosur where shall be stated the actual volumes of exchanged goods and the estimation of futures volumes meat, diary products, grains and actual levy’s