Published
CETA and SMEs: A Firm-Level Trade Assessment
By: Lucian Cernat Carmen Díaz Mora
Subjects: EU Trade Agreements European Union North-America Regions

* Disclaimer: The views expressed herein are those of the author and do not represent an official position by the European Commission.
CETA: from expectations to reality
The EU Canada FTA (CETA) has been a very visible and hotly debated trade agreement in Europe. When debating its future effects during the negotiations, the CETA agreement had been subject to both hope (Kirkpatrick et al., 2011) and criticism, including the potential negative effect of CETA on small EU firms (Corporate Europe, 2016). Much has been already said and written about the likely impact of CETA and Free Trade Agreements (FTAs) more generally. Given the comprehensive nature of FTAs, their effects tend to be equally complex and difficult to fully quantify. However, despite these analytical difficulties, there is wide ex-post empirical evidence indicating that, generally, FTAs lead to a significant increase in bilateral trade flows.
One widely cited study in the economic literature found that, on average, FTAs double trade flows between signatories over a decade (Baier and Bergstrand, 2007). Although new research has highlighted that not all FTAs are “born equal” in terms of their positive trade effects (Diaz-Mora et al., 2023), the overall conclusion that FTAs do have a tangible positive impact on trade values remains a robust empirical finding. The EU-Canada trade patterns seem to be in line with these theoretical predictions. According to the European Parliament (2023), trade in goods between the EU and Canada increased by 53 percent between 2017 and 2022 and trade in services increased by 46 percent, outperforming other extra-EU trade. In particular, EU’s exports to Canada increased by 47 percent in goods and by 19 percent in services. The growth in the export values to Canada by some EU countries (e.g., Belgium, Germany and the Netherlands), has been a major driving force for the overall increase in EU exports.
While reduction of trade barriers and increased trade flows are among the main objectives of trade agreements, it is also important to assess the structural effects of trade agreements on firm demographics and trade distribution across different firm characteristics (Cernat, 2024). If an FTA would increase only the exports of large firms while reducing the overall number of exporters to the detriment of smaller firms, this would diminish the overall benefits of trade liberalisation, e.g. the expected increase in competition and expansion of business opportunities for many trading firms.
The fact that international trade is an activity where large firms tend to have a strong participation is not novel (Bernard et al., 2007). At the same time, despite this skewed trade distribution, the strong participation of EU SMEs in global trade is also well documented (see, for instance, Cernat et al., (2014)). Given this complex interplay between firm size and trade performance, this blog is focussed on one distinct effect: do FTAs affect the number of exporting firms and the participation of small and medium enterprises (SMEs) in trade?
We explore this question taking the CETA as a case study. CETA is one of the most ambitious FTAs concluded and implemented by the EU over a sufficiently long period of time, which allows us to detect any tangible effects on the number of EU exporting firms and SMEs, our two main variables of interest.
What happened to the number of EU exporters after the CETA entry into force?
To perform this assessment we rely on a specific set of international trade statistics that offer insights into the number of EU firms which are directly engaged in cross-border trade. The source of our data is the OECD’s Trade by Enterprise Characteristics (TEC) database (based on statistics collected by Eurostat and other national statistical institutes). The TEC database allows this analysis to be carried out since it contains data on international annual trade in goods broken down by different categories of enterprises.
Unfortunately, the data availability is not perfect: for some EU countries, some years are missing, and the most recent data available stops in earlier years than what is usually available in standard trade statistics. Hence, for some indicators our dataset covers only a subset of EU member states and the time coverage varies, giving us data one year prior to the entry into force of CETA and a few years thereafter. With these caveats and limitations in mind, we first assess the overall, relative change in the number of EU exporting firms to Canada.
After the implementation of CETA, there has been an increase in the number of EU firms trading with Canada, compared to 2016, the year prior to CETA entry into force. From 2016 to 2019, the number of EU26 firms (data for Luxembourg is missing) that engaged in exports of goods to Canada rose from 60,868 to 70,345. This represents a growth of 17.1 percent, which is 10 percentage points higher than the increase in the number of EU firms exporting to the rest of the world.
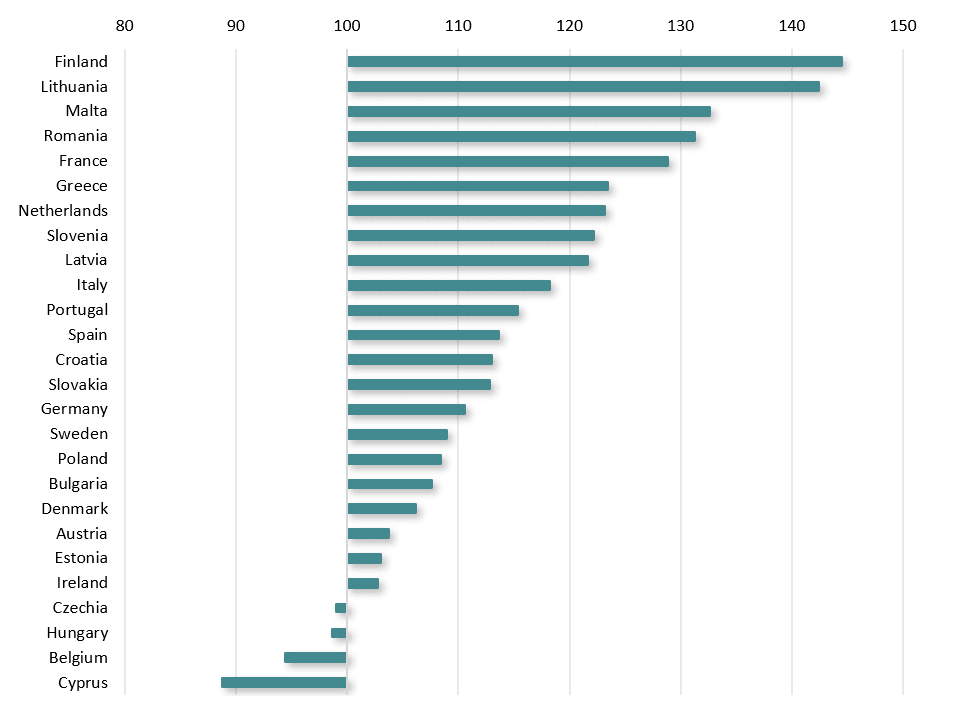
Figure 1: Increase in total number of EU exporters to Canada, 2016-2019 (2016=100)

Source: Authors’ calculations based on the TEC database. The chart shows the increase in the total number of exporting firms to Canada by EU member states, as an index (2016=100).Data for Luxembourg not available.
In Figure 1 we see that for most EU countries, the total number of EU exporters to Canada has increased significantly post-CETA. Measured using 2016 as a base index, the top five EU countries with the largest increase in the total number of exporters to Canada were Finland, Lithuania, Malta, Romania, and France.
In absolute terms, two countries (France and Italy) have added around half of the total EU additional exporting firms to Canada from 2016 to 2019. A significant increase is also seen in Germany, the Netherlands and Spain, where the number of firms that export to Canada has increased by around a thousand companies in each of them during the same period.
When looking at a subset of 16 EU member states for which data is available until 2021, the growth in the total number of firms exporting to Canada between 2016 and 2021 (18.5 percent) also exceeds that of firms exporting to other non-EU destinations (11.5 percent).
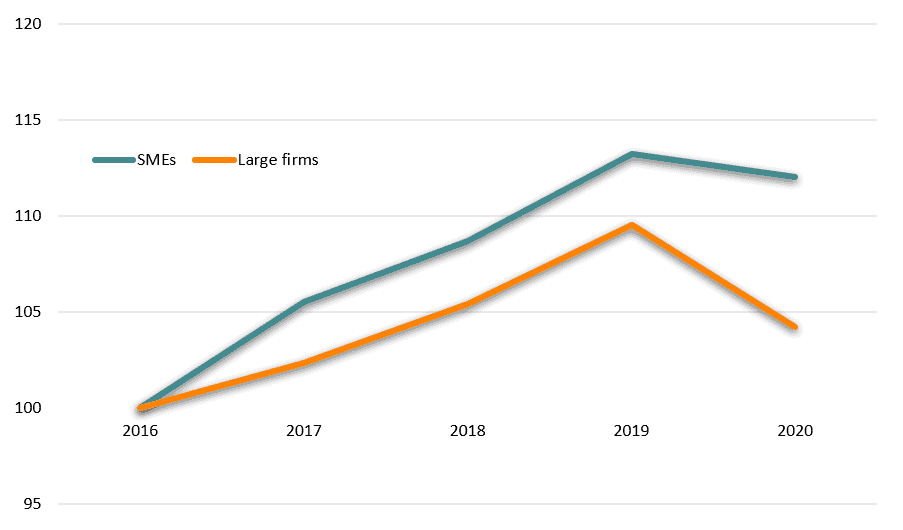
A second metric that can be derived from the TEC database is the differentiation between small and large firms exporting to Canada and the evolution of their number over time. Such differentiation is only available for a subset of EU member states (Austria, Belgium, Cyprus, Czechia, Denmark, Germany, Lithuania, Netherlands, Poland, Portugal, Romania, Slovenia and Spain). As can be seen from Figure 2, while both the number of EU small and large exporters to Canada have increased post-CETA, the relative increase in the number of SMEs (using 2016 as a base year) is systematically higher than the annual increase in the number of large firms exporting to Canada.
Figure 2. The number of EU SMEs exporters to Canada grew faster than the number of EU large exporting firms post-CETA

Source: Authors’ calculations based on the TEC database. The chart shows the increase in the number of EU exporting SMEs to Canada, compared to the increase in number of EU large exporters to Canada. Data indexed on the year before the CETA entry into force (2016=100). Data only available for a subset of EU countries.
This positive trend is reinforced by several other metrics. In absolute numbers, the number of exporting firms to Canada is quite significant: there were more than 2500 additional EU SME and over 450 additional large EU firms exporting to Canada between 2016 and 2019. In line with the evolution presented in Figure 2, the increase in the number of EU exporting SMEs to Canada (13.3 percent) is larger than for large EU firms (10.6 percent) and the difference became even larger in 2020.
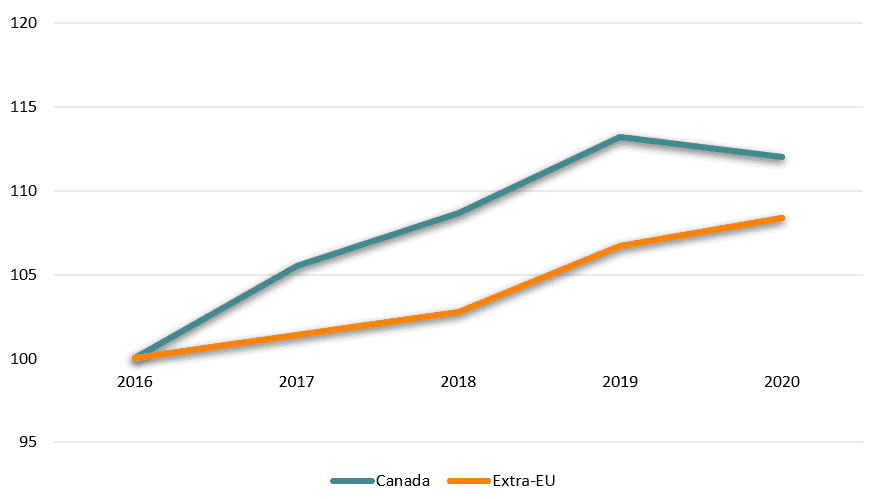
Such sustained, positive trends would not be meaningful if they would be in line with the evolution of the number of EU exporters to the rest of the world. Yet, as Figure 3 indicates, the increase of the number of EU SMEs exporting to Canada is considerably higher than that of EU SMEs exporting firms to the rest of the world between 2016 and 2020. Specifically, the growth rate in the number of EU SMEs exporting to Canada between 2016 and 2020 was 50 percent higher than to other extra-EU destinations. Looking at the annual growth rates, the higher increase in the number of EU exporting firms to Canada compared to the number of EU exporting firms to extra-EU countries took place in the first two years after the entry into force of CETA.
Figure 3. The growth in the number of EU SMEs exporting to Canada was twice as high post-CETA, compared to other export destinations

Source: Authors’ calculations based on the TEC database. The chart shows the increase in the number of EU exporting SMEs to Canada post-CETA (2016-2020), compared to the increase in number of EU SME exporters to the rest of the world. Data indexed on the year before the CETA entry into force (2016=100). Data only available for a subset of EU countries.
The bottom line: the post-CETA trends are encouraging
Based on these new and underexplored firm-level trade indicators, we can derive some useful preliminary conclusions about the post-CETA evolution of EU exports. First, most EU countries exhibit a significant increase in the total number of exporting firms to Canada (both small and large) after the CETA entry into force. While in absolute terms the highest increase in the total number of exporting firms is found in a few large EU member states, in relative terms the highest growth in total exporters are found in a diverse set of EU member states, both in terms of size and geographical location. Second, all but one EU member state (Czechia) have experienced a steady increase in the number of SME exporting to Canada, contrary to pessimistic expectations from some stakeholders before the CETA entry into force. Third, both the absolute and relative increase in the number of EU exporting SMEs is bigger than the increase in the number of EU large exporters to Canada. Finally, when comparing these trends with the evolution of EU exporters to the rest of the world, the post-CETA trends in the number of EU exporting SMEs to Canada are superior, leaving open the possibility that CETA has had a positive effect not only on the total value of EU exports to Canada but also on firm demographics. The bottom line is simple: when it comes to CETA and EU export performance, SMEs are more important than you think!