Breaking Barriers, Boosting Growth: Unlocking the Power of Digital Technology for Europe’s Competitiveness
Published By: Oscar Guinea Vanika Sharma Erik van der Marel Oscar du Roy
Subjects: Digital Economy European Union
Summary
Europe’s digital economy faces a twin challenge that strikes at the heart of its competitiveness: the continent still lacks homegrown tech champions on the scale of those in the United States or China, and digital technologies are not being fully embedded across its wider economy. Despite years of political focus on digital transformation, the uptake of essential tools – such as cloud services, enterprise software, digital advertising, and customer relationship systems – remains patchy across EU countries, sectors, and firm sizes. This combination of limited scale and sluggish diffusion is quietly undermining the EU’s economic resilience and national security.
A major reason for this shortfall lies in the regulatory environment. EU firms navigate a complex web of rules shaped by national and EU-level regulations. Digital-specific obligations often impose heavy compliance costs while market access restrictions limit cross-border business growth. Meanwhile, inconsistent regulations across member states fragment the EU’s Single Market, raising barriers to economic development and draining returns on investment. The result is a constrained business ecosystem, where too few firms scale up and many are deterred from investing in new digital technologies.
These regulatory choices carry a measurable economic cost. New empirical analysis in this Policy Brief shows that restrictive regulation, not only holds back firm expansion, but it also depresses digital adoption and, with it, sectoral performance. A 10 percent increase in the combined effect of services trade restrictions and digital technology uptake is associated with a 1.3 percent decline in value added. In other words, red tape is weighing down Europe’s productivity engine.
This should be a wake-up call for EU policymakers. While much of the debate has focused on industrial policy and the regulation of emerging technologies like AI, too little attention has been given to fostering the conditions for widespread digital adoption. Yet, without structural reforms to reduce regulatory barriers – both within the EU and externally – and to support the diffusion of digital tools, Europe’s digital transformation will remain incomplete. And unless firms across all sectors are encouraged to adopt digital technologies as a means to scale and compete, the EU will risk falling further behind in the global race for technological leadership and competitiveness.
1. Introduction
Much of the EU’s policy debate has focused on why Europe has struggled to produce large technology champions, often in unfavourable comparison with the United States or China. This concern is well-founded. Over the past 50 years, the US has created 241 companies from scratch with a market capitalisation of over US$10 billion, while Europe has created just 14.[1] However, the challenge goes deeper than scale: Europe is also struggling to integrate digital technologies broadly across firms, sectors, and borders.
Regulation lies at the heart of this challenge. Former Italian Prime Minister Mario Draghi observed that the EU’s economy is suffering due to excessive regulation.[2] A concern that also applies to the digital economy. While digital regulations are often designed to safeguard rights and promote trust, they also impose significant fixed costs on firms, especially small and medium-sized enterprises (SMEs). According to a survey by Amazon, European businesses allocate 40 percent of their IT budgets to compliance with regulation.[3] One could argue that regulation has turned European entrepreneurs into reluctant compliance officers.
In addition to EU-wide digital regulations, firms must also contend with national-level restrictions on services regulation. These restrictions limit cross-border competition – a crucial channel for technological diffusion – and prevent firms from scaling their digital services from one member state into others.
It is surprising that the trade-offs between regulation and the development of Europe’s digital economy have not been more widely acknowledged, especially as the EU has rapidly expanded regulation in the digital sector, introducing nearly 100 tech-focused laws spanning thousands of pages, provisions, and restrictions, with serious implications for EU competitiveness.[4] These regulations carry serious consequences for EU’s competitiveness. Digital prowess is a key driver for economic prosperity and security, setting leading and laggard nations apart. To stay at the forefront, the EU must strike a regulatory balance: one that upholds non-economic objectives while supporting competitiveness.
A previous ECIPE Policy Brief, The Future of European Digital Competitiveness,[5] showed that the uptake of digital technologies is closely linked to national and sectoral productivity levels. This study builds on that evidence and demonstrates that the restrictiveness of regulation – both digital and non-digital – directly limits the uptake of digital technologies across the EU, with significant implications for competitiveness.
This Policy Brief contributes to the debate on Europe’s digital future by highlighting the central role of regulation in shaping economic outcomes. The study is structured as follows: Chapter 2 introduces the Technology Readiness Index (TRI) and maps the current state of digital technology uptake across EU member states, sectors, and firms. Chapter 3 examines the relationship between regulatory barriers – both digital and non-digital – and the uptake and diffusion of digital technologies. Chapter 4 quantifies how these barriers undermine the competitiveness of the EU economy.
[1] Fairless, T. and Luhnow, D. (2025). The Tech Industry Is Huge—and Europe’s Share of It Is Very Small. The Wall Street Journal. Accessed at: https://www.wsj.com/tech/europe-big-tech-ai-1f3f862c
[2] Draghi, M. (2024). The future of European competitiveness: A competitiveness strategy for Europe. European Commission.
[3] Fairless, T. and Luhnow, D. (2025). The Tech Industry Is Huge—and Europe’s Share of It Is Very Small. The Wall Street Journal. Accessed at: https://www.wsj.com/tech/europe-big-tech-ai-1f3f862c
[4] Guinea, O. and du Roy, O. (2025). Rules Without End: EU’s Reluctance to Let Go of Regulation. Blog, ECIPE, Available at: https://ecipe.org/blog/rules-without-end-eu-regulation/
[5] Guinea, O. and Sharma, V. (2025). The Future of European Digital Competitiveness. Report, ECIPE, Brussels, Policy Brief, 5/2025, 20 p.
2. Europe’s State of Digital Technology Adoption
2.1 The ECIPE Technology Readiness Index (TRI)
The adoption of digital technologies is a key driver of firm-level productivity and, by extension, wider economic growth. Technologies such as e-invoicing, supply chain integration, and digital advertising enable businesses to carry out routine tasks more efficiently by reducing costs, saving time, or both.[1] As firms increasingly integrate such technologies into their daily operations, this contributes to productivity growth across the economy.
The TRI measures the take-up of these technologies by capturing the extent to which firms incorporate them into their operations. Table 1 presents the selected digital technologies and Annex A provides a detailed discussion of the methodology used to develop the TRI.
Table 1: Digital technologies included in the ECIPE TRI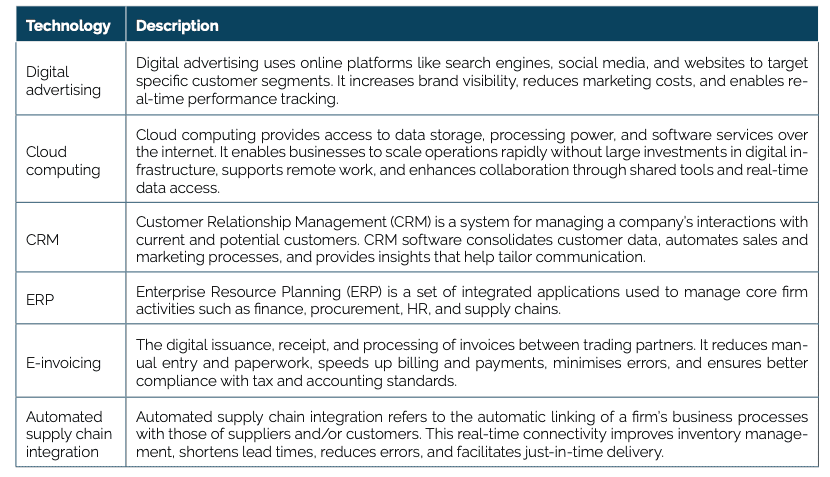 Source: Eurostat.
The TRI combines relevant technologies with available data across countries, sectors, and years, enabling us to measure the uptake of digital technologies across these dimensions, as well as conduct the econometric analysis described in Chapter 4. It also allows the inclusion of the most relevant technologies across sectors. For instance, the six technologies are equally important in manufacturing and service sectors – unlike 3D printing, which features in Eurostat’s Digital Intensity Index (DII),[2] and is more relevant to manufacturing.
The TRI is highly correlated with other indices that measure digital technology uptake, such as the previously mentioned DII and the IMF’s Artificial Intelligence Preparedness Index (AIPI).[3] Annex B presents a comparison between the TRI and these two indices and shows that countries and sectors scoring highly on the TRI also perform well on the Eurostat DII and IMF AIPI.
2.2 TRI Across EU Member States
Figure 1 presents the TRI scores for EU member states, revealing clear regional patterns in the index rankings. Nordic and North-Western countries – often characterised as small, open economies – tend to rank highly, with Finland scoring 50.9 percent, Denmark 49 percent, and Sweden 43.9 percent. The Netherlands, Ireland, and Belgium follow closely, with scores between 43.5 and 38.4 percent. The middle of the distribution, scoring around the 30 percent mark, includes more diverse country profiles. For instance, three of the largest economies – Italy, France, and Spain – score similar to countries like the Czech Republic, Slovenia, and Austria. Finally, at the bottom of the distribution are countries such as Croatia (25.1 percent), Greece (24.9 percent), and Romania (15.5 percent).
Figure 1: Country ranking by ECIPE TRI, average 2014-2021 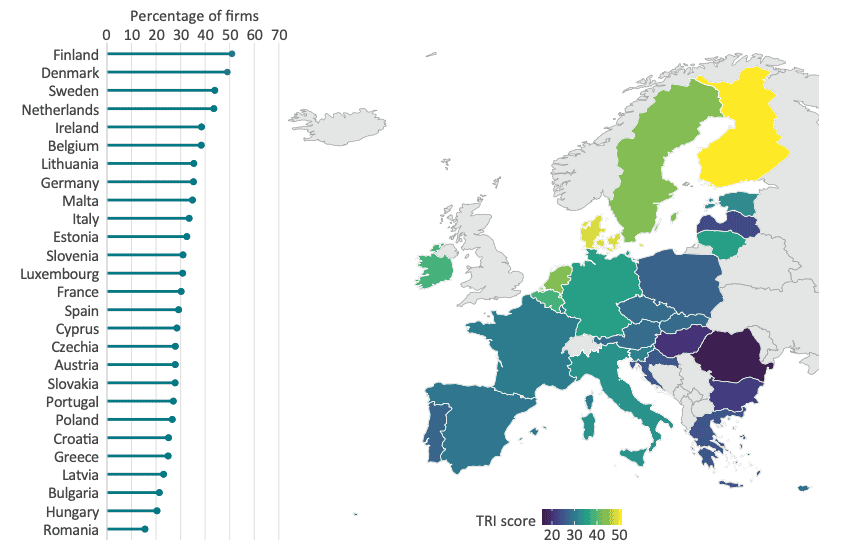 Source: Eurostat; authors’ calculations. Note: Due to lack of data for certain technologies across some years, the TRI is presented as an average over the period 2014-2021.
2.3 TRI Over Time
Analysing the TRI over time makes it possible to identify which countries are catching up and which are falling behind in their use of digital technologies. Figure 2 shows the ranking of countries based on changes in their TRI scores between 2014 and 2021, measured in percentage points. It is important to note that, due to data availability,[4] only three technologies are included in this version of the TRI: cloud computing, Enterprise Resource Planning (ERP), and Customer Relationship Management (CRM).
The data presented in Figure 2 highlights increased digitalisation in several countries that were previously not among the digital frontrunners. For instance, Belgium experienced the largest increase, with a 25.3 percentage point gain, while Latvia, Portugal, Malta, and Austria also show strong progress. In Figure 1, which presents the average TRI scores for the entire 2014-2021 period, these countries ranked 24th, 20th, 9th, and 18th, respectively. Poland, Estonia, and Lithuania also show notable gains, with improvements of around 15 to 20 percentage points. Their performance reflects a catch-up dynamic, as they narrow the digitalisation gap with higher-performing North-Western European economies.
Several countries show moderate progress, including some of the highest scorers in terms of average digital technology use. For instance, Sweden and Ireland – ranked 3rd and 5th in Figure 1 – saw increases in digital uptake of around 10 percentage points. Finally, not all low-scoring countries in Figure 1 perform above average in their efforts to adopt digital technologies over time. Romania, Bulgaria, and Greece ranked the lowest in average digital uptake (Figure 1), and remain at the bottom in terms of percentage change in usage (Figure 2).
Figure 2: Change in ECIPE TRI across countries, 2014-2021 (percentage points)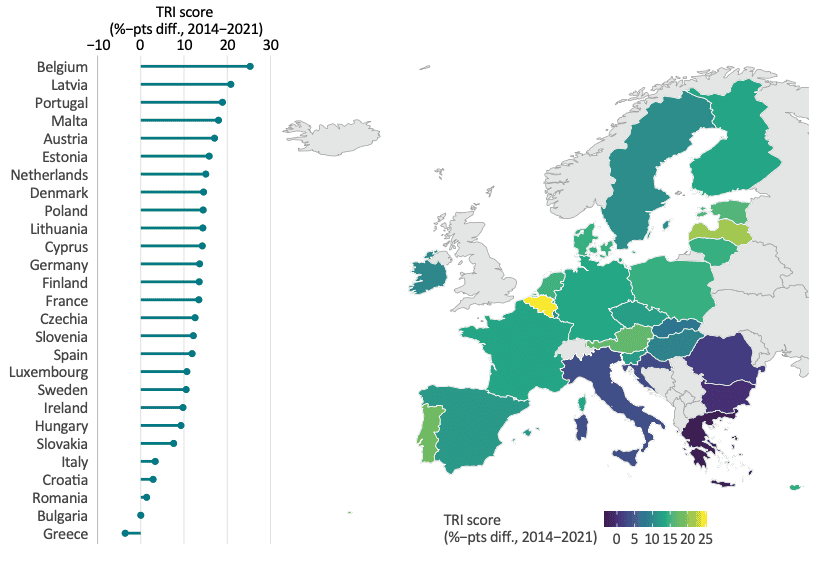 Source: Eurostat; authors’ calculations.
Uneven growth in the uptake of digital technologies suggests there is no general convergence in their use across EU countries. Figure 3 shows countries at the frontier,[5] bottom,[6] and median of TRI scores over time. Between 2014 and 2021, the gap between frontier and lagging countries widened by 3.9 percentage points. This lack of convergence is illustrated by looking at individual countries. In 2014, the frontier countries included Sweden, Finland, Denmark, and the Netherlands. By 2021, only Belgium had joined this group. Similarly, of the 11 countries at the bottom of the distribution in 2014, only Austria managed to become a middle performer.[7]
Figure 3: Country technology frontier and distance to frontier, measured by the ECIPE TRI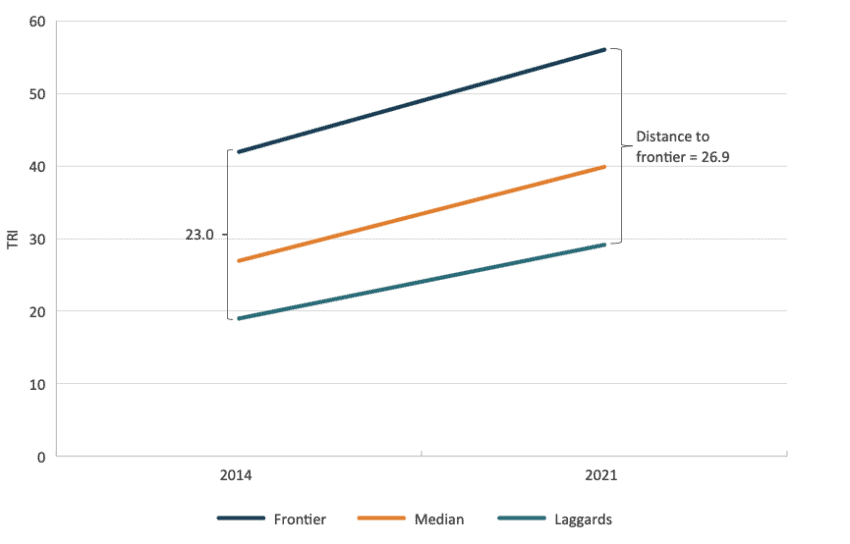 Source: Eurostat; authors’ calculations.
2.4 TRI Across Sectors and Firm Sizes
There is significant variation in the adoption of digital technologies across economic sectors. As shown in Figure 4, Information and Communication Technology (ICT) services stand out with the highest average TRI score at 46.8 percent far ahead of other sectors. This reflects the inherently digital nature of the sector, driven by extensive adoption of CRM and cloud computing software (see Figure A3 in Annex A). ICT is followed by two other services sectors – distribution and professional services – suggesting that knowledge-intensive services are generally more advanced in adopting digital technologies. At the other end of the spectrum, accommodation and food services, construction, and transport report the lowest TRI scores, each below 25, indicating that these traditionally lower-productivity sectors are lagging in the uptake of digital technologies.
Figure 4: Ranking of ECIPE TRI across EU sectors, average 2014-2021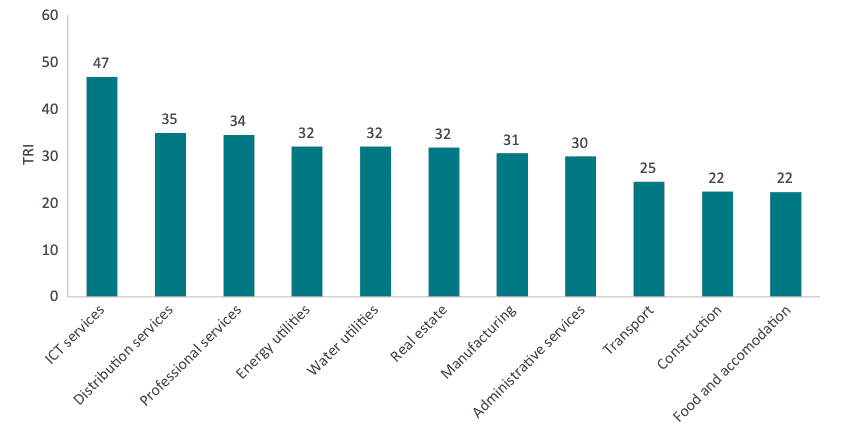 Source: Eurostat; authors’ calculations.
There is also considerable variation in digital adoption within sectors. Figure 5 compares TRI scores across the ICT services and manufacturing sectors. Within ICT services, the top three sub-sectors are information services (52.9 percent), computer programming and consultancy (52.9 percent), and telecommunications (49.5 percent). In manufacturing, the highest TRI scores are in electronic and optical products (41.7 percent), transport equipment (35.7 percent), and motor vehicles (35.7 percent). However, TRI scores for these manufacturing sub-sectors remain significantly below the overall TRI score for ICT services (46.8 percent)
Figure 5: ECIPE TRI in top-performing ICT services and manufacturing subsectors, average 2014-2021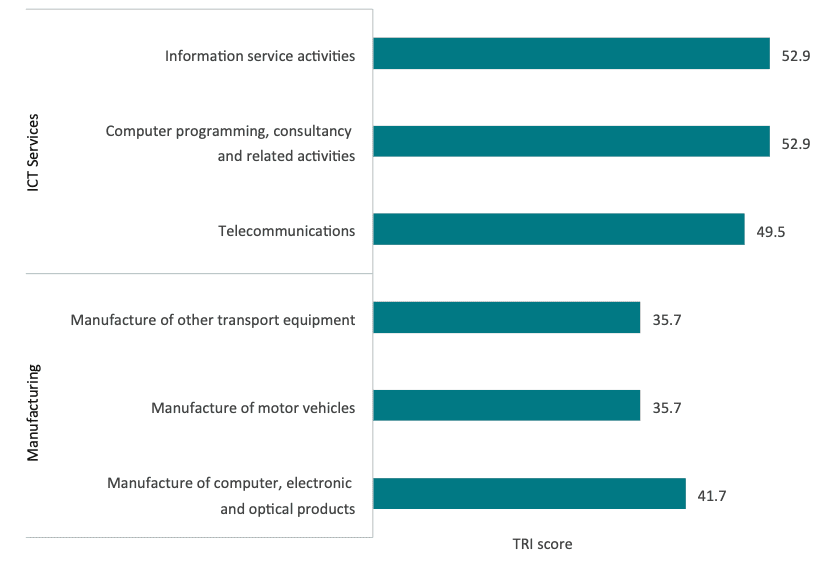 Source: Eurostat; authors’ calculations.
Figure 6 shows that firm size plays a major role in TRI performance, with large companies (more than 250 employees) significantly more likely to score highly than medium or small firms. Across the EU, large companies have an average TRI score of 57.6 percent, compared to 42.5 percent for medium-sized firms (50-249 employees) and just 27.9 percent for small firms (10-49 employees).
This difference in digital technology uptake is understandable, as large companies generally have more financial resources to invest in advanced digital tools and infrastructure. For instance, implementing systems such as ERP software often requires significant upfront investment and ongoing maintenance, costs that can be more easily absorbed by larger firms. The fact that fewer than one in three small firms in the EU is digitally intensive is also deeply concerning from an economic standpoint. SMEs are central to the EU economy: they accounted for 53.3 percent of value added and 65.3 percent of total employment in 2023.[8] Given that they make up 99.8 percent of all enterprises, even modest growth in the usage of digital technologies among SMEs can have a substantial impact on the wider economy.
Figure 6: Ranking of ECIPE TRI by firm size, average 2014-2021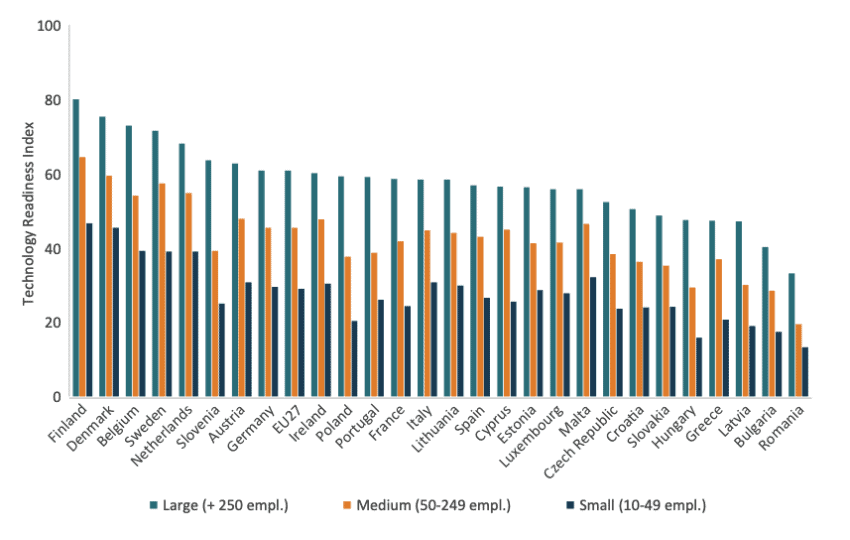 Source: Eurostat; authors’ calculations.
This divergence in the uptake of digital technologies across EU companies of different sizes is even more apparent in the case of AI, where there is a 24-percentage-point gap in adoption between small and large firms.[9] AI diffusion is critical for the EU economy, as its greatest value arises when firms, across the economy, adopt AI solutions. On this front, regardless of company size, the EU is falling behind both its own targets and against global peers. According to the European Commission, only 13.5 percent of EU companies had adopted AI by the end of 2024, far below the target of 75 percent by 2040.[10] By comparison, adoption rates have reached 59 percent in India, 50 percent in China, and 40 percent globally,[11] while the transatlantic gap in AI adoption is estimated at 25 percentage points.[12]
[1] Guinea, O. and Sharma, V. (2025). The Future of European Digital Competitiveness. Report, ECIPE, Brussels, Policy Brief, 5/2025, 20 p.
[2] Eurostat produces a composite indicator known as the Digital Intensity Index (DII), which measures the extent to which businesses adopt a range of digital technologies. The index is based on a selection of 12 technologies. In addition to core tools like cloud computing and Enterprise Resource Planning (ERP) systems, the DII also considers the use of technologies such as 3D printing and whether a firm maintains a website. Depending on the number of technologies adopted, firms are assigned a score and classified into categories ranging from very low to very high digital intensity.
[3] IMF’s AI Preparedness Index (AIPI) can be accessed at: https://www.imf.org/external/datamapper/datasets/AIPI
[4] Throughout the Policy Brief, whenever the TRI is compared across time, it is composed of only three technologies: cloud computing, Enterprise Resource Planning (ERP), and Customer Relationship Management (CRM).
[5] Frontier countries are defined as those at the top of the TRI distribution. In 2014, there is a clear break between Sweden, Finland, Denmark, and the Netherlands having a TRI above 40. In 2021, Belgium, Finland, the Netherlands, Denmark, and Sweden make up the frontier. The frontier definition is roughly equivalent to the performance of the top 15 percent of countries in the distribution.
[6] The bottom 40 percent of distribution is consistent with existing literature of frontier analysis. See for example Berlingieri, G. et al. (2020). Laggard firms, technology diffusion and its structural and policy determinants, OECD Science, Technology and Industry Policy Papers, No. 86, OECD Publishing, Paris. Accessed at: https://doi.org/10.1787/281bd7a9-en.
[7] Greece replaces Austria among the bottom 40 percent countries in 2021.
[8] European Investment Fund. (2023). The European Small Business Finance Outlook 2023 (EIF Working Paper 2023/96).
[9] Guinea, O. and Sharma, V. (2025). The Future of European Digital Competitiveness. Report, ECIPE, Brussels, Policy Brief, 5/2025, 20 p.
[10] European Commission. (2023, September 27). 2025 State of the Digital Decade package. Digital Strategy. Retrieved from https://digital-strategy.ec.europa.eu/en/policies/2025-state-digital-decade-package
[11] B7. (2025, May). B7 final communiqué. Canadian Chamber of Commerce. Retrieved from https://chamber.ca/wp-content/uploads/2025/05/B7_Final_Communique_Final_EN.pdf
[12] Sukharevsky, A., Hazan, E., Smit. S., de la Chevasnerie, M., de Jong, M., Hieronimus, S., Mischke, J., & Dagorret, G. (2024) Time to place our bets: Europe’s AI opportunity. McKinsey & Company. Retrieved from https://www.mckinsey.com/capabilities/quantumblack/our-insights/time-to-place-our-bets-europes-ai-opportunity
3. The Impact of Restrictive Regulation on Digital Technology Uptake
3.1 Regulatory Barriers and the Uptake of Digital Technologies in the EU
The pace at which digital technology is adopted is influenced not only by the type of industry or firm size, but also by the regulatory environment. Restrictive rules can slow down digital innovation, uptake and infrastructure investment, while more open regulatory approaches support wider adoption, boost the digital economy, and help spread new technologies more effectively.[1]
European companies face restrictive regulations at both the EU and national levels. At EU level, regulations affect firms’ ability to build up digital assets such as data and adopt new technologies. For example, the General Data Protection Regulation (GDPR) restricts data collection and storage; the Digital Markets Act (DMA) and Digital Services Act (DSA) limit market access; and the AI Act sets conditions that may constrain product development.[2] At national level, various policy and regulatory barriers also hold back the uptake of digital technologies. These include rigid labour and capital markets,[3] tax and financial systems poorly suited to digital business models, and underinvestment in digital infrastructure[4] – all of which make it harder for firms to adopt new tools and processes.
The impact of these restrictions is evident in the data. The OECD Digital Services Trade Restrictiveness Index (DSTRI) identifies regulatory barriers affecting trade in digitally enabled services across 22 EU member states.[5] These barriers include restrictions related to infrastructure and connectivity, electronic transactions, payment systems, intellectual property rights, and other areas.[6] Table 2 presents the OECD DSTRI alongside the OECD Services Trade Restrictiveness Index (STRI) and the OECD Product Market Regulation (PMR) Index used in this chapter to measure digital and non-digital regulatory barriers, and regulatory heterogeneity.
Table 2: Overview of regulatory restriction indices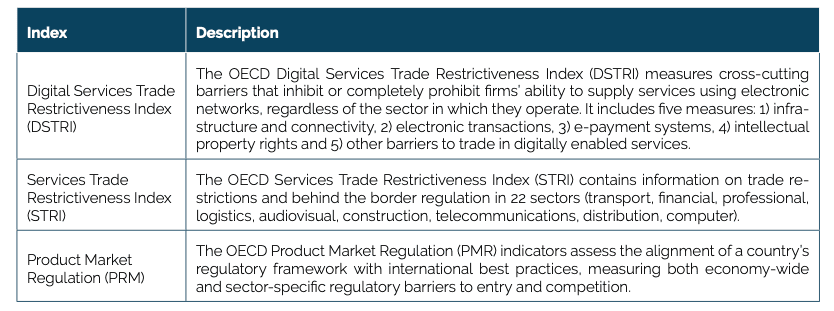 Source: OECD.
Figure 7 compares the DSTRI scores with the TRI scores across EU countries. Both indicators range from 0 to 1: a score of 0 indicates no use of digital technologies by firms (TRI) or fully open digital services trade (DSTRI), while a score of 1 reflects full adoption of digital technologies by firms (TRI) or completely closed markets (DSTRI). When the TRI scores are arranged in descending order, the data reveals a clear negative relationship with the DSTRI. In other words, more restrictive digital services trade regulations are associated with lower levels of digital technology adoption. For example, Finland and Denmark have the highest TRI scores, along with the sixth and seventh lowest levels of restrictions on digital services trade. By contrast, Poland, Greece and Latvia show low TRI scores and high levels of digital trade restrictiveness.
Figure 7: ECIPE TRI and OECD DSTRI across countries, average 2014-2021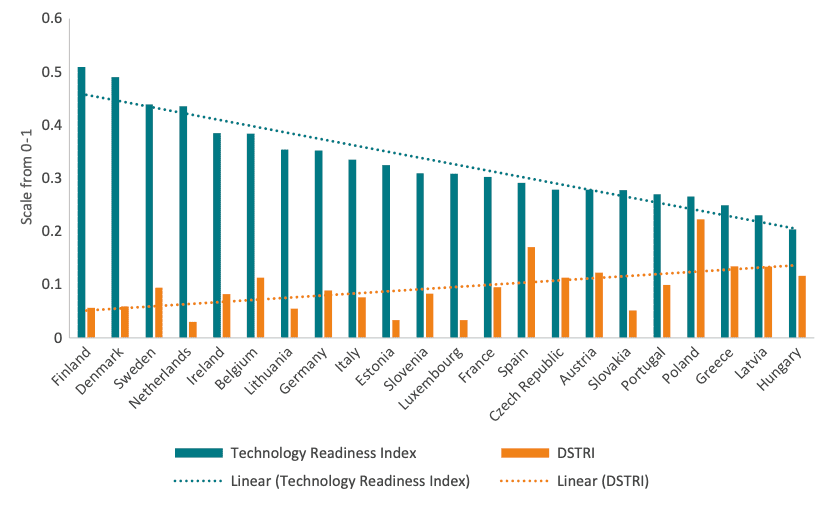 Source: Eurostat; OECD; ECIPE; authors’ calculations.
In this context, it is not surprising that the European Commission announced a simplification package aimed at streamlining aspects of its digital regulation.[7] Yet much more remains to be done. The EU could consider pausing parts of its digital regulatory agenda that pose greater harm to the European economy. For example, according to one study, the Digital Markets Act (DMA) alone could result in losses of over €1,100 per worker.[8]
3.2 Regulatory Barriers to Trade in Services and the Uptake of Digital Technologies
Service industries are central to the digital economy – they develop digital technologies, use them more intensively than the manufacturing sector (see Figure 4 and 5), and support their spread through activities such as professional and consultancy services. A crucial part of this diffusion takes place through cross-border trade in services.
Services can be exported directly, delivered through a foreign subsidiary, or provided in person by professionals crossing borders. Therefore, restrictions on trade in services – such as investment rules and limits on the movement of people – create new barriers that hold back the growth of digital firms and hinder the adoption of digital technologies across the economy. The OECD’s Services Trade Restrictiveness Index (STRI) measures these restrictions across countries and service sectors.
Figure 8 shows, similar to Figure 7, a negative relationship between the restrictiveness of the STRI and the take-up of digital technologies by firms in the EU, as measured by the TRI. EU countries with more restrictive regulations on trade in services – such as Greece or Hungary – tend to have lower TRI scores. By contrast, countries with high TRI scores – such as the Netherlands or Denmark – tend to have lower levels of services trade restrictiveness.
Figure 8: ECIPE TRI and OECD STRI across countries, average 2014-2021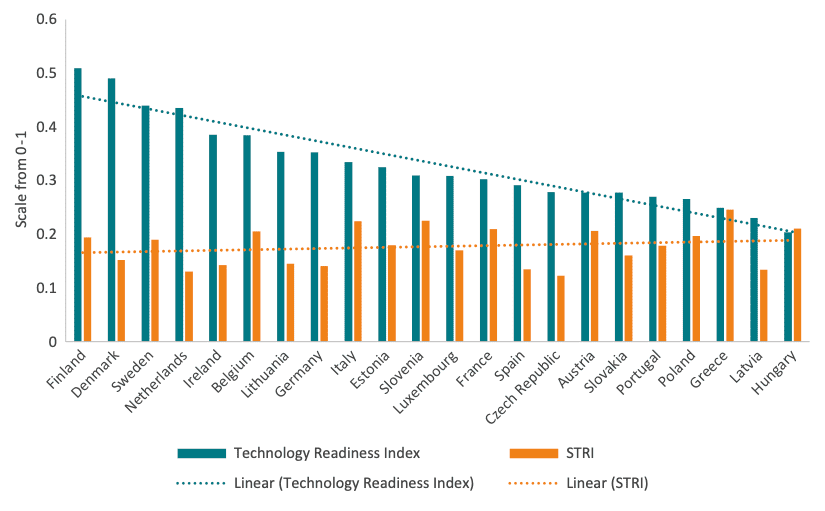 Source: Eurostat; OECD; ECIPE; author’s calculations.
At the sectoral level, regulatory restrictions also affect the adoption of digital technologies. Figure 9 shows that some services sectors are less digitally intensive than others, while also facing greater non-digital services trade restrictions. As shown previously (see Figure 4), firms in the construction and transport sectors tend to have lower TRI scores. At the same time, Figure 9 illustrates that these sectors face higher levels of services trade restrictions compared to wholesale and retail trade, and telecommunications – where firms make greater use of digital technologies.
Figure 9: ECIPE TRI and OECD STRI by sector, 2014-2021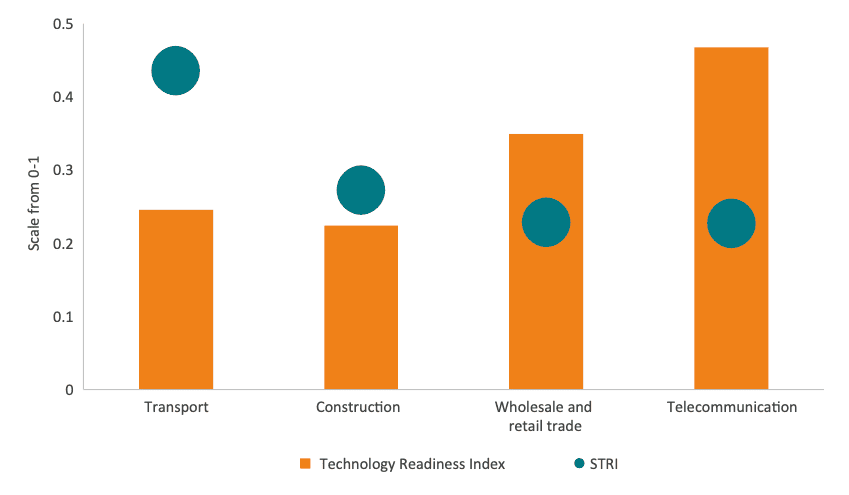 Source: Eurostat; OECD; ECIPE; author’s calculations.
3.3 Regulatory Heterogeneity and Its Impact on Digital Technology Diffusion
In addition to regulatory and trade barriers, European services firms also face a high degree of regulatory heterogeneity. This heterogeneity becomes clear when entry barriers are compared across EU countries. For example, data in Figure 10 shows that the score of the OECD Product Market Regulation for Sweden – which has the lowest entry barriers – is five times lower than the score for Portugal, which was the highest scoring country in the EU.[9]
Figure 10: OECD Product Market Regulation (PMR) Index across countries, 2023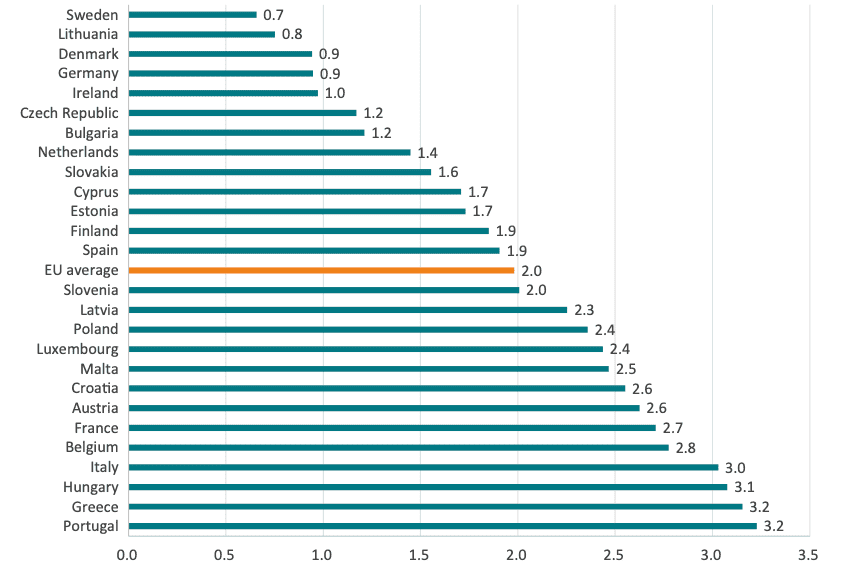 Source: OECD; authors’ calculations.
Figure 11 offers an alternative way to illustrate the variation in regulatory barriers across EU countries. Each box plot shows the minimum, maximum, average (marked with an ‘X’), and interquartile range (the span between the 25th and 75th percentiles), capturing how much regulation levels differ between countries within each sector. The height of each box – representing the gap between the lowest and highest PMR scores in each sector – indicates the degree of regulatory heterogeneity.
Two key insights stand out. First, the degree of variation varies considerably across sectors. Entry barriers are consistently low and similar across countries in telecommunications, while they are high and widely spread in the legal profession. In sectors such as accountancy, some countries have no barriers at all, while others remain highly restrictive. Second, there has been little improvement in regulatory convergence since 2018. In most sectors, the size of the boxes has changed little, indicating that cross-country regulatory differences persist.
Figure 11: Variation in OECD Product Market Regulation Index across EU sectors, 2018 and 2023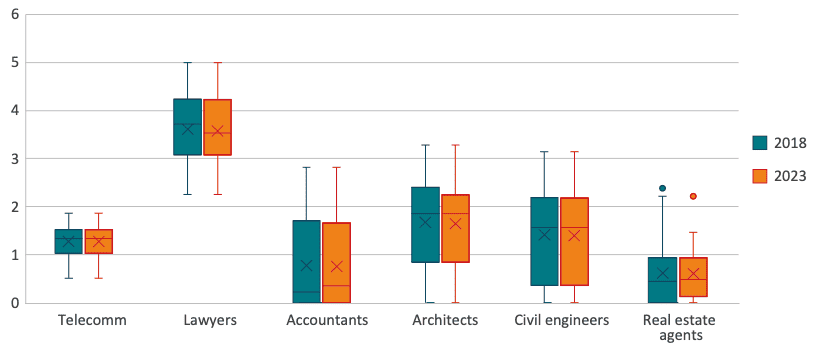 Source: OECD; authors’ calculations.
This asymmetric regulation poses a tangible barrier to the diffusion of digital technologies across borders. For instance, cross-border digital platforms – ranging from e-commerce and cloud computing to communication and business services – play a vital role in connecting markets and massively increasing access to digital technologies.[10] [11] [12] However, when regulations differ significantly between countries, platforms operating in multiple jurisdictions face higher compliance costs and legal uncertainty, which discourage their expansion and reduce their capacity to serve as vectors of technological diffusion.
Overall, the evidence presented in this chapter highlights a consistent pattern: higher regulatory restrictions are associated with lower rates of digital technology adoption among firms. This link becomes clearer when considering the journey of a hypothetical digital firm in the EU.
To operate, this firm must comply with a complex set of EU-wide and national-level regulations, which undermines its ability to develop and build digital capabilities. Despite these hurdles, some companies do succeed in creating and adopting digital technologies and business models. However, once these firms look to scale, they encounter a second set of barriers: restrictions on cross-border services trade. These rules erode one of the key benefits of digital transformation: the ability to reach wider markets at low marginal cost. Moreover, even within the EU’s Single Market, companies often find that their digital services do not meet national regulatory requirements in destination countries. As a result, firms are forced to modify their products, adapt to diverging rules, and absorb the associated compliance costs. This is just a theoretical example, but it illustrates well how regulatory restrictions presented in section 3.1; barriers to market access in section 3.2; and asymmetric regulation in section 3.3 discourage digital adoption and stifle the growth of pan-European digital firms.
A similar argument applies to digital infrastructure investment. The EU is falling behind other countries in terms of computational power.[13] To counter this trend, the European Commission presented the AI Continental Action Plan,[14] which includes a proposal for a Cloud and AI Development Act[15] aimed at tripling EU data centre capacity. However, the EU’s failure to function as a single market has undermined these efforts from the outset. Comparative advantage suggests that data centres should be located where they are cheapest to build. Instead, the European Commission has planned 13 gigafactories across the EU, including in member states with the highest energy costs and the most challenging permitting environments, both critical factors for the success of these facilities.[16] The reason is clear: EU countries prefer a small share of a guaranteed pie rather than allowing the pie to grow larger. Inevitably, this short-sighted domestic bias comes at the expense of the EU’s overall economic competitiveness. Meanwhile, China is investing $141 billion in AI,[17] building 250 AI computing centres[18] and over 60 percent of the €700 billion gap in corporate R&D investment between the EU and the US is attributed to European firms underinvesting in technology.[19]
Finally, regulatory restrictions apply both within the EU and between the EU and the rest of the world. If the EU is serious about enhancing competitiveness and accelerating the diffusion of digital technologies, it must avoid measures that restrict firms’ access to best-in-class digital tools – just as it must guard against the introduction of new market barriers within the Single Market. This includes maintaining open digital trade and procurement markets, particularly with partners like the US, whose digital firms are among the EU’s most important suppliers of digital technologies. European firms rely on US technology to enhance their competitiveness while developing highly specialised, high-value products. European success stories, such as Mistral in generative AI, Helsing in defence AI, and ASML in semiconductors, demonstrate that openness to cutting-edge technologies and infrastructure can coexist with world-class innovation. As the Draghi Report notes, “accelerating innovation and technological progress in Europe will require a high degree of trade openness towards countries that provide key technologies in which the EU is currently deficient.” [20] [21]
[1] Ding, J. (2024). Technology and the Rise of Great Powers: How Diffusion Shapes Economic Competition, Princeton University Press.
[2] Erixon, F. and Guinea, O. (2024). From Compliance to Constraint: How Digital Regulation Impacts Productivity and Innovation in Europe, EconPol Forum 6/2024 November Volume 25.
[3] Amoroso, S. and Martino, R. (2020). Regulations and technology gap in Europe: the role of firm dynamics, JRC Working Papers on Corporate R&D and Innovation No 04/2020, Joint Research Centre
[4] Erixon, F., Guinea, O. and Pandya, D. (2025). Strengthening the Supply-Side Innovation in EU Telecommunications. Report, ECIPE, Brussels, Policy Brief, 12/2025, 26 p.
[5] The DSTRI scores were unavailable for: Bulgaria, Croatia, Cyprus, Malta, and Romania.
[6] At the same time, it is important to note that EU regulations such as the DMA, DSA, and the AI Act, cover many different aspects of the digital economy. These comprehensive regulations combine features of product regulation, market access regulation, and regulations governing firms’ behaviour, concepts traditionally used in competition policy to prevent abuse of market dominance. As such, they are difficult to classify under previous indicators that measure regulatory restrictiveness, such as the OECD Product Market Regulation (PMR) or the OECD Digital Services Trade Restrictiveness Index (DSTRI). This means that the DSTRI scores might underestimate the degree of digital restrictiveness in the EU member states.
[7] European Commission. (2025, March 19). Commission proposes simplification measures to save EU businesses a further €400 million per year. Retrieved from https://ec.europa.eu/commission/presscorner/detail/en/ip_25_1277
[8] Cennamo, C., Kretschmer, T., Constantiou, I., & Garcés, E. (2025). Economic impact of the Digital Markets Act on European businesses and the European economy. LAMA Economic Research. Retrieved from https://www.dmcforum.net/publications/economic-impact-of-the-digital-markets-act-on-european-businesses-and-the-european-economy/
[9] The data analysis also reveals a negative correlation between the OECD PMR Index and the TRI. EU countries with higher PMR scores tend to have lower TRI scores and vice versa.
[10] Atkinson, R. D. (2018). How ICT Can Restore Lagging European Productivity Growth. Information Technology & Innovation Foundation. Retrieved from https://www2.itif.org/2018-ict-eu-productivity-growth.pdf
[11] Tadelis, S., Hooton, C., Manjeer, U., Deisenroth, D., Wernerfelt, N., Dadson, N., & Greenbaum, L. (2023). Learning, sophistication, and the returns to advertising: Implications for differences in firm performance (No. w31201). National Bureau of Economic Research.
[12] Garicano, L., & Santaló (2024). Can platform-supported digitalisation raise the productivity of European firms. IE Center for the Governance of Change. Retrieved from https://www.ie.edu/cgc/news-and-events/news/new-report-digital-platforms-increase-european-smes-productivity/
[13] Epoch (2025). AI supercomputers. Retrieved from https://epoch.ai/data/ai-supercomputers#data-insights
[14] European Commission. (2025, April 9). The AI Continent Action Plan. Retrieved from https://digital-strategy.ec.europa.eu/en/library/ai-continent-action-plan
[15] European Commission. (2025). AI-Continent – New Cloud and AI Development Act. Retrieved from https://ec.europa.eu/info/law/better-regulation/have-your-say/initiatives/14628-AI-Continent-new-cloud-and-AI-development-act_en
[16] De la Feld, S. (2025, April 9). EU plans to build five Gigafactories to develop cutting-edge artificial intelligence models. EUNews, Retrieved from https://www.eunews.it/en/2025/04/09/eu-plans-to-build-five-gigafactories-to-develop-cutting-edge-artificial-intelligence-models/
[17] Ma, S. (2024, September 6). China’s state-owned firms splash 1 trillion yuan on emerging hi-tech industries. South China Morning Post. Retrieved from https://www.scmp.com/economy/china-economy/article/3277506/chinas-state-owned-firms-splash-1-trillion-yuan-emerging-hi-tech-industries
[18] Strider & SCSP. (2025). China’s AI infrastructure surge. Retrieved from https://content.striderintel.com/wp-content/uploads/2025/05/Strider-SCSP-China-AI-Infrastructure-Surge-Report.pdf
[19] World Economic Forum. (2025). Europe in the intelligent age: How to accelerate Europe’s digital and AI transformation. Retrieved from https://reports.weforum.org/docs/WEF_Europe_in_the_Intelligent_Age_2025.pdf
[20] Draghi, M. (2024). The future of European competitiveness: A competitiveness strategy for Europe. European Commission. p. 20.
[21] Unfortunately, regulatory uncertainty and overly burdensome rules have already caused some digital technology companies to delay, or in some cases abandon, AI product launches in the EU. Source: Jackson, F. (2025, April 8). EU AI rules delay tech rollouts, but civil societies say safety comes first. TechRepublic. Retrieved from https://www.techrepublic.com/article/news-eu-ai-laws-tech-giants-civil-groups/
4. How Regulation of the Digital Economy Affects Europe’s Competitiveness
4.1 Digital Uptake and Competitiveness
Economic research shows that digital technologies positively affect GDP growth.[1] Hence, the growing adoption of digital technologies – such as those captured by the TRI – has proven to be beneficial to the economy.[2] Figure 12 shows the relationship between the TRI and competitiveness, using labour productivity (Panel A) and value added (Panel B) as proxies. In both cases, the relationship is positive: countries with higher TRI scores tend to have, on average, higher levels of labour productivity and generate greater value added.[3]
Figure 12: Relationship between ECIPE TRI and labour productivity (Panel A) and value added (Panel B), average 2014-2021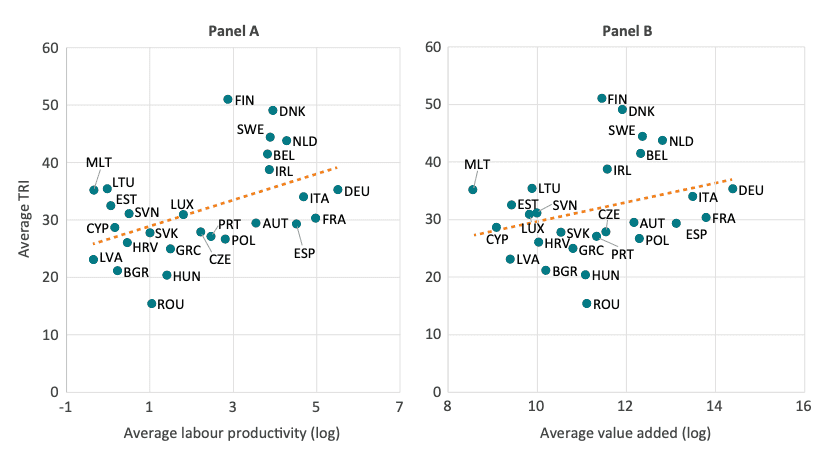 Source: Eurostat; authors’ calculations. Note: Labour productivity is measured by apparent labour productivity, computed as value added at factor costs divided by the number of persons employed.
Figure 13 plots sectoral TRI scores against average labour productivity, with larger bubbles representing sectors that contribute more value added. A positive correlation is evident between productivity and technology adoption: sectors with higher TRI scores tend to report higher levels of labour productivity.
Figure 13: Labour productivity and ECIPE TRI across EU sectors, average 2014-2021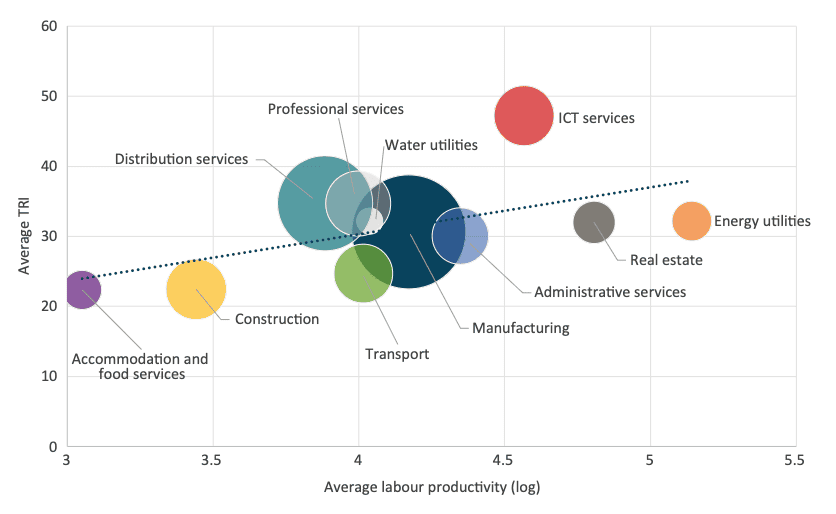 Source: Eurostat; authors’ calculations. Note: Bubble sizes are represented by sector value added.
4.2 Estimating the Impact of Regulation on Competitiveness
Chapter 2 showed that countries and sectors differ in their levels of digital adoption. Chapter 3 highlighted disparities between regulatory restrictions and the uptake of digital technologies. The previous section demonstrated a positive link between digital technology and competitiveness, as measured by labour productivity and value added. This section brings these dynamics together to empirically estimate the impact of regulation on digital technology adoption – and, through that channel, on competitiveness.
Figure 14 shows that competitiveness is influenced by digital technology adoption (TRI) and its interaction with trade restrictions (see Annex D for a detailed overview of the model and robustness checks). This interaction captures the combined effect of digital intensity and regulatory restrictions on firms’ competitiveness. The results show that, on average across sectors and years, a 10 percent increase in the combined effect of STRI and digital readiness (TRI) is associated with a 1.3 percent decline in value added.[4] This suggests that digital technologies are less effective in boosting sector performance when firms operate in more restrictive services trade environments.[5] Similarly, the interaction between DSTRI and TRI is also negative. However, the coefficients are not statistically significant, meaning we cannot draw firm conclusions about the impact.
Figure 14: Impact of a 10 percent increase in the interaction between services restrictions and the ECIPE TRI on sector competitiveness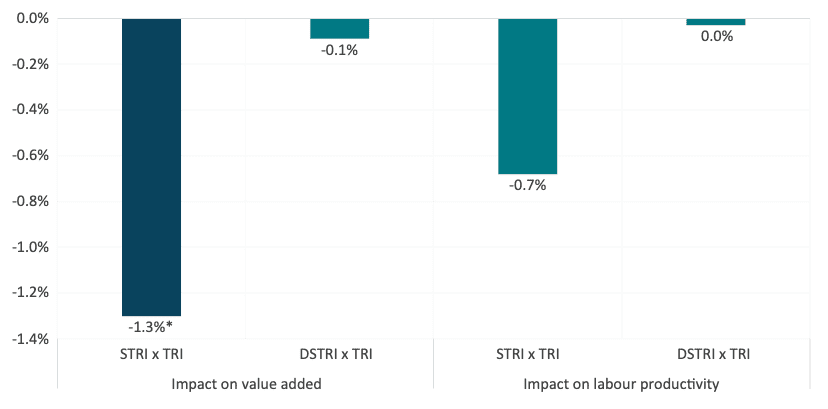 Source: Authors’ calculations. Note: * indicates statistically significant results.
These results present two critical findings for EU policymakers:
i. Digital technology adoption boosts competitiveness, but achieving higher levels of adoption requires policymakers to address regulatory restrictions. Among these, broader services trade restrictions are a key obstacle to sectoral competitiveness. This suggests that removing regulatory constraints, such as market access limitations, discriminatory practices, and restrictions on establishment or the movement of service suppliers, could generate significant economic gains. Another way to frame this important result is that removing digital barriers alone will have only limited impact if broader services trade restrictions remain in place.
ii. Services trade restrictions are a direct barrier not only to competitiveness, but also to the diffusion of technology. They limit cross-border competition between firms, preventing the transfer of knowledge and business best practices from European leaders to national followers. This lack of diffusion through market competition contributes to the lack of convergence in the adoption of digital technologies across countries and sectors.
[1] Brynjolfsson, E. and Hitt, L. M. (2000). Beyond computation: Information technology, organizational transformation and business performance. Journal of Economic Perspectives, 14(4), 23–48.
[2] Polder, M., van Leeuwen, G., Mohnen, P. and Raymond, W. (2010). Product, process and organizational innovation: Drivers, complementarity and productivity effects. UNU-MERIT Working Paper 2010-035.
[3] Europe’s sluggish uptake of digital technologies is also contributing to the widening productivity gap with the United States. In the late 1990s, the average EU worker produced 95 percent of what their American counterpart generated per hour. Since then, productivity has declined in relative terms, coinciding with the expansion of the digital economy, suggesting that Europe’s slower adoption of transformative technologies is weighing heavily on its economic performance. Source: Fairless, T. and Luhnow, D. (2025). The Tech Industry Is Huge—and Europe’s Share of It Is Very Small. The Wall Street Journal. Accessed at: https://www.wsj.com/tech/europe-big-tech-ai-1f3f862c
[4] To put this number into perspective, a 1.3 percent drop in value added is roughly equivalent to the gross value-added growth the Swedish telecommunication sector gained from 2014 to 2015.
[5] As shown in Table D2, in the model where STRI is interacted with TRI, the coefficient on TRI as a standalone control variable is positive and statistically significant. As expected, digital technology adoption is positively associated with sectoral competitiveness.
5. Conclusion
The European Union finds itself at a pivotal juncture on the state of its future competitiveness. While much political attention has focused on industrial policy, this Policy Brief has argued that reducing internal regulatory barriers and promoting openness to world-leading technologies from outside the EU are essential for Europe’s long-term economic growth.
Digital adoption and diffusion are key drivers of productivity and competitiveness. Widespread uptake and integration of digital technologies across sectors, firms, and borders drive productivity and enhance competitiveness. However, the TRI highlights large and persistent disparities across EU member states (see Figure 1), sectors (see Figure 4 and 5), and firm sizes (see Figure 6). While digital frontrunners – particularly Nordic countries and knowledge-intensive service sectors – demonstrate high levels of technological integration, less advanced countries and SMEs continue to fall behind. Importantly, there is limited evidence of convergence within EU countries and between the EU and global digital frontrunners.
Regulatory barriers help to explain these disparities. Restrictive regulation can significantly hinder the development of the digital sector. Evidence shows a negative correlation between digital and non-digital regulatory barriers and the uptake of digital technologies across the EU. Given the significance of regulatory barriers – within the EU, between member states, and between the EU and the rest of the world – policymakers should take a step back and re-evaluate digital regulation, particularly the provisions with the greatest negative economic impact. This matters because countries and sectors with higher uptake of digital technologies tend to perform better economically – reinforcing the case that boosting firm-level digital adoption is critical for growth.[1]
This Policy Brief demonstrates that Europe’s potential is being held back by a complex web of regulatory and market access barriers. Services trade restrictions have a statistically significant negative impact on sectoral competitiveness – particularly in terms of value creation. In addition, product market regulation across the EU suffers from regulatory asymmetry – fragmenting the EU’s Single Market, curbing technological diffusion, and preventing European firms from fully realising the benefits of digital technologies.
These findings are crucial for the ongoing debate on how the EU should respond to its competitiveness challenge. To date, EU policy has focused heavily on regulating digital markets, while giving too little attention to enabling the diffusion of existing technologies across the wider economy. The evidence shows that without structural reforms, digital technologies will remain underused – and Europe’s competitiveness will continue to decline.
[1] Guinea, O. and Sharma, V. (2025). The Future of European Digital Competitiveness. Report, ECIPE, Brussels, Policy Brief, 5/2025, 20 p.
References
Amoroso, S. and Martino, R. (2020). Regulations and technology gap in Europe: the role of firm dynamics, JRC Working Papers on Corporate R&D and Innovation No 04/2020, Joint Research Centre
Atkinson, R. D. (2018). How ICT Can Restore Lagging European Productivity Growth. Information Technology & Innovation Foundation. Retrieved from https://www2.itif.org/2018-ict-eu-productivity-growth.pdf
B7. (2025, May). B7 final communiqué. Canadian Chamber of Commerce. Retrieved from https://chamber.ca/wp-content/uploads/2025/05/B7_Final_Communique_Final_EN.pdf
Barone, G. and Cingano, F. (2011). Service Regulation and Growth: Evidence from OECD Countries, Economic Journal 121, 931–957.
Berggren, H., & Karpaty, P. (2024). Cloud Services and Export Performance – Evidence and implications for EU policy. National Board of Trade Sweden. Retrieved from https://www.kommerskollegium.se/analyser-och-seminarier/publikationer/rapporter/2024/cloud-services-and-export-performance/
Berlingieri, G. et al. (2020). Laggard firms, technology diffusion and its structural and policy determinants, OECD Science, Technology and Industry Policy Papers, No. 86, OECD Publishing, Paris. Accessed at: https://doi.org/10.1787/281bd7a9-en.
Brynjolfsson, E. and Hitt, L. M. (2000). Beyond computation: Information technology, organizational transformation and business performance. Journal of Economic Perspectives, 14(4), 23–48.
Cennamo, C., Kretschmer, T., Constantiou, I., & Garcés, E. (2025). Economic impact of the Digital Markets Act on European businesses and the European economy. LAMA Economic Research. Retrieved from https://www.dmcforum.net/publications/economic-impact-of-the-digital-markets-act-on-european-businesses-and-the-european-economy/
De la Feld, S. (2025, April 9). EU plans to build five Gigafactories to develop cutting-edge artificial intelligence models. EUNews, Retrieved from https://www.eunews.it/en/2025/04/09/eu-plans-to-build-five-gigafactories-to-develop-cutting-edge-artificial-intelligence-models/
Ding, J. (2024), Technology and the Rise of Great Powers: How Diffusion Shapes Economic Competition, Princeton University Press.
Draghi, M. (2024). The future of European competitiveness: A competitiveness strategy for Europe. European Commission.
Epoch (2025). AI supercomputers. Retrieved from https://epoch.ai/data/ai-supercomputers#data-insights
Erixon, F. and Guinea, O. (2024). From Compliance to Constraint: How Digital Regulation Impacts Productivity and Innovation in Europe, EconPol Forum 6/2024 November Volume 25.
Erixon, F., Guinea, O. and Pandya, D. (2025). Strengthening the Supply-Side Innovation in EU Telecommunications. Report, ECIPE, Brussels, Policy Brief, 12/2025, 26 p.
European Investment Fund. (2023). The European Small Business Finance Outlook 2023 (EIF Working Paper 2023/96).
European Commission. (2023, September 27). 2025 State of the Digital Decade package. Digital Strategy. Retrieved from https://digital-strategy.ec.europa.eu/en/policies/2025-state-digital-decade-package
European Commission. (2025). AI-Continent – New Cloud and AI Development Act. Retrieved from https://ec.europa.eu/info/law/better-regulation/have-your-say/initiatives/14628-AI-Continent-new-cloud-and-AI-development-act_en
European Commission. (2025, April 9). The AI Continent Action Plan. Retrieved from https://digital-strategy.ec.europa.eu/en/library/ai-continent-action-plan
European Commission. (2025, March 19). Commission proposes simplification measures to save EU businesses a further €400 million per year. Retrieved from https://ec.europa.eu/commission/presscorner/detail/en/ip_25_1277
Fairless, T. and Luhnow, D. (2025). The Tech Industry Is Huge—and Europe’s Share of It Is Very Small. The Wall Street Journal. Accessed at: https://www.wsj.com/tech/europe-big-tech-ai-1f3f862c
Ferracane, M., Kren, J. and van der Marel, E. (2020a). Do Data Policy Restrictions Impact the Productivity Performance of Firms and Industries?, Review of International Economics, Vol. 28, No. 3, pages 676-722.
Ferracane, M. & van der Marel, E. (2020b). Patterns of Trade Restrictiveness in Online Platforms: A First Look, The World Economy, Vol. 43, Issue 11, Special Issue: The Effects of Services Trade Policies, pages 2932-2959.
Ferracane, M. and van der Marel, E. (2021). Do Data Flows Restrictions Inhibit Trade in Services?, Review of World Economics, Vol. 157, No. 4, pages 727-776.
Garicano, L., & Santaló (2024). Can platform-supported digitalisation raise the productivity of European firms. IE Center for the Governance of Change. Retrieved from https://www.ie.edu/cgc/news-and-events/news/new-report-digital-platforms-increase-european-smes-productivity/
Grous, A. (2019). The Transformative Effect of Cloud on Firm Productivity and Performance: Defining the benefits and impact of cloud as a 21st Century digital enabler.
Guinea, O. and du Roy, O. (2025). Rules Without End: EU’s Reluctance to Let Go of Regulation. Blog, ECIPE, Available at: https://ecipe.org/blog/rules-without-end-eu-regulation/
Guinea, O. and Sharma, V. (2025). The Future of European Digital Competitiveness. Report, ECIPE, Brussels, Policy Brief, 5/2025, 20 p.
Jackson, F. (2025, April 8). EU AI rules delay tech rollouts, but civil societies say safety comes first. TechRepublic. Retrieved from https://www.techrepublic.com/article/news-eu-ai-laws-tech-giants-civil-groups/
Jin, W., & McElheran, K. (2017). Economies before scale: learning, survival and performance of young plants in the age of cloud computing. Rotman School of Management Working Paper, (3112901).
Ma, S. (2024, September 6). China’s state-owned firms splash 1 trillion yuan on emerging hi-tech industries. South China Morning Post. Retrieved from https://www.scmp.com/economy/china-economy/article/3277506/chinas-state-owned-firms-splash-1-trillion-yuan-emerging-hi-tech-industries
Mueller, B. & Castro, D. (2021). The Value of Personalized Advertising in Europe. Center for Data Innovation.
Polder, M., van Leeuwen, G., Mohnen, P. and Raymond, W. (2010). Product, process and organizational innovation: Drivers, complementarity and productivity effects. UNU-MERIT Working Paper 2010-035.
Presidente, G. & Frey, C.B. (2022). The GDPR effect: How data privacy regulation shaped firm performance globally. VoxEU. CEPR.
Strider & SCSP. (2025). China’s AI infrastructure surge. Retrieved from https://content.striderintel.com/wp-content/uploads/2025/05/Strider-SCSP-China-AI-Infrastructure-Surge-Report.pdf
Sukharevsky, A., Hazan, E., Smit. S., de la Chevasnerie, M., de Jong, M., Hieronimus, S., Mischke, J., & Dagorret, G. (2024) Time to place our bets: Europe’s AI opportunity. McKinsey & Company. Retrieved from https://www.mckinsey.com/capabilities/quantumblack/our-insights/time-to-place-our-bets-europes-ai-opportunity
Tadelis, S., Hooton, C., Manjeer, U., Deisenroth, D., Wernerfelt, N., Dadson, N., & Greenbaum, L. (2023). Learning, sophistication, and the returns to advertising: Implications for differences in firm performance (No. w31201). National Bureau of Economic Research.
World Economic Forum. (2025). Europe in the intelligent age: How to accelerate Europe’s digital and AI transformation. Retrieved from https://reports.weforum.org/docs/WEF_Europe_in_the_Intelligent_Age_2025.pdf