Published
Russia Import Dependency Problem
By: Fredrik Erixon Oscar Guinea Vanika Sharma Renata Zilli
Subjects: Russia & Eurasia

There’s a lot of talk about Europe’s dependency on the Russian economy – especially the flow into Europe of oil, gas, grains, and some gases like neon. While it is important for Europe to break this dependency, there is an undercurrent in some of the commentary about trade dependencies between the EU and Russia that suggests the escalation of sanctions to hit Europe harder than Russia. This is not correct.
Europe has had some trade sanctions against Russia since 2014, when the country first invaded Ukraine and annexed Crimea. This sanctions programme altered European exports and reduced its size. Europe’s exports of goods to Russia in 2021 was about 89 billion euro compared with 118 billion euro ten years prior. EU countries that are proximately close to Russia were then affected not just by EU sanctions but also Russia’s counter sanctions, for instance of agricultural products. But they weathered the storm quickly. For instance, Estonia’s exports of dairy products to Russia dropped by 66 percent between 2013 and 2014. However, the country’s exports of dairy products to other countries went up, leading to only a 1 percent decline in total dairy exports in that year.
A macro analysis of EU-Russia trade tells a different story about general dependencies. Obviously, the new sanctions will hurt the global economy. Russia is a global exporter of commodities that are traded globally, and the Russian invasion has already pushed up prices of many raw materials and agricultural commodities. There are products in which a significant supply comes from Russia, and which needs to be found somewhere else. As Poland prime minister Mateusz Morawiecki learned from its Australian counterpart when trying to replace Russian coal with coal coming from Australia, these adjustments take some time and require additional resources. There is also a lesson here: the concentration of market power in the production of any product carries geopolitical risks.
Uncoupling the Russian economy from the West will have costs but they will hit the Russian economy far, far harder. In 2020, less than 2 percent of EU total exports and imports went and came from Russia while for the Russian economy this percentage was equal to 34 percent. This difference alone shows how asymmetrical the economic effects of the sanctions will be. Add to that the geographical scope of the sanctions. Many countries are sanctioning Russia, leaving it with few chances to reallocate its total trade, while the sanctions only affect a small portion of Europe’s total trade. It is one thing to find new trading partners for 2 percent of your total trade. It is a totally different thing to find substitutes for one third of your total trade.
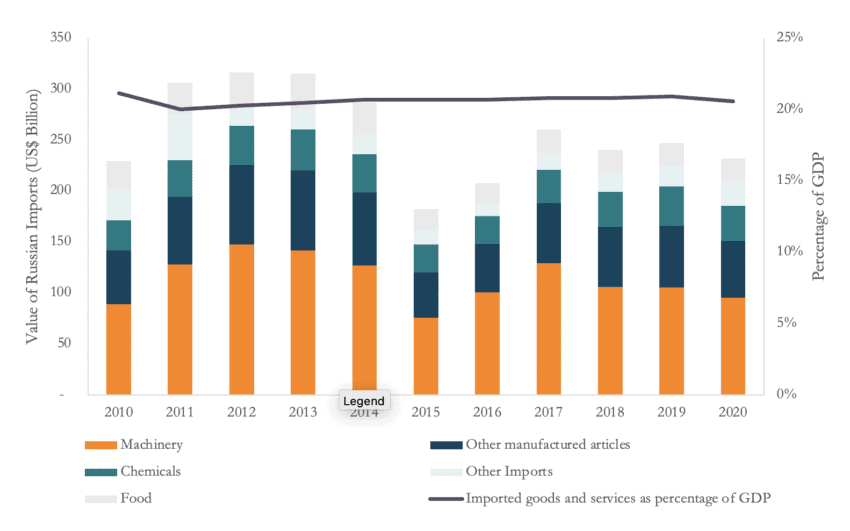
The effects of the Western sanctions on the Russian economy are proof that the Russian economy is much more intertwined with the West than most people think. Russian imports of goods and services as a percentage of its GDP were 21 percent in 2020, lower than the OECD average (26%) but larger than India (19%), China (16%), Brazil (15%), and the United States (13%). The EU is Russia’s main supplier of foreign goods, accounting for 34 percent of Russian total imports, significantly more than China which represents 24 percent. The EU and the US together supply 40 percent of Russian total imports. As a result of the trade and financial sanctions, and the associated financial and reputational risks that now come with any transaction with a Russian entity, this trade is rapidly shrinking to a fraction of what it was.
Figure 1 below shows Russian imports broken down by economic sector and its value as a percentage of Russia GDP between 2010 and 2020. The data shows that Russia’s main imports are machinery, chemicals, and other manufacturing goods, and that Russia depends on the rest of the world for the supply of many complex products. One factor explaining Russia’s sectoral trade profile and dependency is its poor labour productivity. Russian labour productivity in the industrial sector is 21 percent of US and 36 percent of EU’s labour productivity. In other words, the Russian economy needs five workers to do the job of one US factory worker.
Figure 1: Russian imports per sector and imported goods and services as a percentage of Russian GDP

Source: UNCOMTRADE, World Bank, authors’ calculations.
Moreover, Russia’s dependency on the West’s manufacturing capacity – particularly European – is shown in the value that foreign businesses add to the Russian economy. Four of every ten dollars of Russian demand for manufacturing goods came from outside Russia and the EU alone contributed 14 percent to Russian’s total demand of manufacturing goods. In comparison China – the factory of the world – added 9 percent. To pay for these imports, Russia exports minerals, oil, and gas. In 2020, exports of these products represented 59 percent of Russian total exports while Russian exports of machinery and chemicals were 5 percent and 6 percent respectively. Russia’s trade profile is one in which Russia exports minerals, oil, and gas and imports manufacturing products.
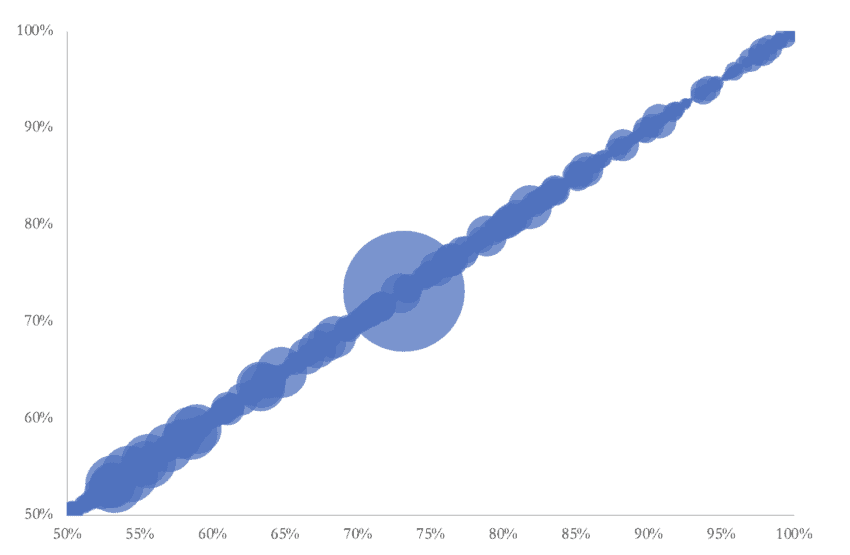
The effect of the sanctions in the Russian economy will be felt sector by sector as Russian companies stop receiving foreign products, technology, and expertise. Many imported products are relatively sophisticated, which will make finding alternative suppliers much more difficult. The Russian economy relies heavily on EU and US companies for many imported products. In 2020, there were 1,716 product categories (out of 4,385) with a value of €57 billion (28 percent of Russian total imports) for which at least half of Russia’s imports came from the EU and the US. Figure 2 plots each individual product category for which EU and US businesses supply at least 50 percent of Russian imports. The size of the bubbles corresponds to the value of the products. Some of the most important product categories were medicines, vehicles parts, IT components, machinery’s parts like valves and pipes, and iron and steel. Figure 2 also shows that for some product categories, Russia’s dependency on the EU and the US is much higher than 50 percent. There were €22 billion of Russian imported products for which 75 percent came from the EU and the US, €7 billion for which this ratio was 85 percent, and €2 billion for which more than 95 percent of Russian imports were sourced from the EU and the US. In comparison, there were only ten product categories (out of 9,000) with a value of €8 billion (0.5 percent of EU imports) that the EU buys mostly from Russia – and half of the import value of these products were oil and gas.
Figure 2: Russian imported product with half or more of imported value sourced from the EU and the US (2020)

Source: UNCOMTRADE, authors’ calculations.
Understanding Russian import dependency, the number of product categories, and value of these products that Russia imports from the EU and the US is crucial to appreciate the economic shock to the Russian economy. The sudden stop in many of these exchanges will be difficult to overcome. There are significant amounts of imports on machinery, pharmaceuticals, chemicals, transport equipment, and electronics that Russia buys from the EU and the US. Some of it can be imported from elsewhere, but trade substitution of this scale in an economy under siege and faced with hard Foreign Exchange sanctions will take a very long time.
Timely and informative. Thanks for the stats!
Thank you Mia. You are very kind.
Very interesting. But can you explain the last graph? How are the axes labelled? Thank you
Hi Nigel,
Thanks for your comment. The two axis of the graph are the same thing (that’s why the 45 degree line). We decided to show the graph in this way but it could have been a bar chart. The variable we plot the data against is the share of Russian imports from the EU and US and we present the product categories for which this proportion is higher than 50%. The size of the bubbles indicate the value of the imports. Hope this is helpful.
Thank you for sharing this informative blog with us. This is really helpful. keep sharing these kinds of blogs.
Thank you. We are glad you found the blog interesting. Many thanks for your encouragement.
Found this blog very informative thanks for sharing.
Overall world scenario has changed with import export dependencies on countries. Recent war situations has changed the tourist visiting scenarios as well.
Everyone needs to keep a positive approach towards the things and increase the prosperity.
Thank you. While establishing the asymetrical Russian dependence on imported manufacturing goods from the West, you don’t consider that they are continuing to access these goods through third countries. This sanction work-around is likely producing higher costs for Western goods and is likely a source of inflation and a depreciating currency issue, is a factor needs study.
very good article, i did lot enjoy it .
This blog provides a thorough analysis of EU-Russia trade dependencies and the impact of sanctions. The historical context of sanctions since 2014 highlights how the EU has adapted, reducing its exports to Russia and redirecting trade. The macro analysis shows that while global repercussions are inevitable, Russia, being more intertwined with the West, will suffer more.
Data on Russia’s reliance on sophisticated imports from the EU and US, coupled with its lower labor productivity, underscores the long-term challenges it faces. The high dependency on Western imports in sectors like machinery, chemicals, and IT components makes finding substitutes difficult. The comparison of import dependency ratios reveals the severity of the economic impact on Russia.
Overall, the blog effectively argues that while Europe will face challenges, the economic blow to Russia will be significantly harsher due to its deep dependencies and the complexity of trade substitution.