Enhancing Technology Diffusion in the EU amid Tough Structural Challenges
Published By: Matthias Bauer Elena Sisto Oscar du Roy
Subjects: Digital Economy European Union Sectors Services
Summary
To remain globally competitive, the EU must empower firms to adopt the best technology solutions available on global markets. Building on a strong tradition of innovation, the EU relies on corporations across industries to drive the diffusion of technology through the commercialisation of technological innovations. Technology diffusion is crucial for embedding new technologies into society and is essential for sustaining industrial competitiveness. EU and Member State governments must prioritise enhancing the EU’s “diffusion capacity” – the ability to effectively spread and adopt innovations across Member States.
EU Contributors and Beneficiaries in Trade in Technology Products and Services (Section 2)
Knowledge and Technology Intensive (KTI) products and services are essential drivers of innovation and economic growth, pushing technological boundaries, and boosting productivity across multiple industries. KTI sectors are defined by their significant research and development efforts, commercialising technologies that impact a wide range of industries. Over the past decade, the EU’s KTI manufacturing sectors have become increasingly reliant on imported digitally enabled services – such as ICT and high value-added professional services – to maintain export competitiveness. This trend highlights the integration of high-tech industries in the global economy and the critical role of cross-border technology and service flows allowing EU firms to sustain strong positions in the global market.
Western and Nordic EU countries generally possess stronger diffusion capacities, allowing them to more effectively adopt, integrate, and capitalise on advanced technologies and high-tech services, thereby amplifying their economic advantages. Technology creation in the EU is heavily driven by key contributors such as Luxembourg, Ireland, Denmark, Germany, and the Netherlands, which have established themselves as leaders in many high-tech manufacturing and services industries. Companies in these countries excel in sectors like biopharmaceuticals, digital and digitally enabled services, and advanced manufacturing. Countries like Austria, France, Germany, and Central and Eastern European (CEE) countries emerge as significant beneficiaries of technology diffusion, actively importing advanced technologies to strengthen their manufacturing and service sectors. Companies in CEE countries integrate high-tech products and services into their operations, enhancing their industrial capabilities and accelerating overall economic development.
Tech Divide and Skills Challenges in CEE Economies (Section 3)
The economic divide between Western/Nordic and CEE countries is closely linked to their differing capacities for diffusing knowledge and technology. EU countries like Sweden and Ireland have advanced digital economies with strong R&D investment, while CEE countries are still more dependent on traditional manufacturing and have lower digital integration. This disparity limits their participation in the digital economy and widens the economic gap within the Single Market. It leaves CEE countries vulnerable to protectionist EU policies that could restrict their access to global technology.
The digital intensity of businesses across the EU also reveals stark regional disparities, with Nordic countries leading in digital adoption and CEE countries lagging behind. This growing digital divide not only risks deepening economic inequalities and undermining competitiveness but also threatens to drive skilled workers away from less digitally advanced regions. The EU’s shortfall in STEM education further exacerbates these issues, as the region struggles to keep pace with global leaders like China, which produces a vast number of STEM graduates, and the US, which benefits from its global talent pool and strong innovation ecosystem.
Policy Recommendations to Push Technology Diffusion in the EU (Section 4)
To improve EU’s global competitiveness and accelerate Member States’ technology diffusion capacities, priority should be given to reducing internal market trade barriers and harmonising regulations, enabling firms – especially SMEs – to adopt innovations more easily. Advancing international trade liberalisation and fostering global regulatory alignment is essential for EU firms to access and integrate cutting-edge technologies from around the world. Importantly, a return to a liberal rules-based global trading order and the reduction of unilateral regulatory actions are critical to preserving the global competitiveness of European industries, ensuring firms can thrive in a more open, cooperative environment.
By strengthening openness to trade and foreign investment, EU policymakers would enhance economic integration and unlock new growth opportunities across all Member States. Encouraging corporate R&D and innovation through tax reforms and investment incentives, such as full expensing in technology-driven industries, would drive growth and help attract leading industry players. Continued investment in advanced digital infrastructure, including critical technologies such as AI and cloud technologies, is essential to keeping European firms competitive in the rapidly evolving global digital economy.
Finally, addressing the growing digital skills gap through targeted investments in STEM education, and digital literacy will be crucial to preparing a future-ready workforce, particularly in regions like CEE that faces more significant challenges.
1. Technology Diffusion: Why It’s Critical for Europe’s Future Competitiveness
The effectiveness of technology diffusion – spreading and adopting innovations within and across regions – is primarily driven by firms that commercialise these advancements. This commercialisation process is essential for integrating new technologies into the economy and is primarily facilitated by firms that create, adopt, and spread these innovations both within the EU and globally. Countries like China and the US show that technology diffusion through company-led commercialisation is crucial for maintaining competitive advantage, economic growth, and global leadership. For the EU, enhancing diffusion capacities by addressing internal market barriers to trade and improving digital skills is important to improve Europe’s position in the global technology landscape.
Technology has always been a critical driver of economic development. The field of science and technology studies has identified its pivotal role in economic growth.[1] However, relatively little attention has been paid to the underlying conditions and factors that are necessary for the adoption and diffusion of new technologies across border. Neglecting drivers and impediments for cross-border technology diffusion can lead to ineffective economic policies, and, in the context of the EU, can put Member States at a structural disadvantage when economic and technological developments are more and more thriving outside the EU. Recognising policy conditions conducive to technology diffusion is crucial to ensure that the EU remains competitive in the global economy.
Understanding Technology Diffusion
Technology diffusion involves the spread of knowledge, skills, and capabilities across different firms, public sectors organisations, people, and regions, integrating innovations into existing practices through specific stages. These stages include innovation, development, diffusion, and adoption.[2] The process also involves awareness, interest, evaluation, trial, and continued use, explaining how new technologies become widespread and integrated into regular use (Box 1).
Box 1: Technology diffusion theory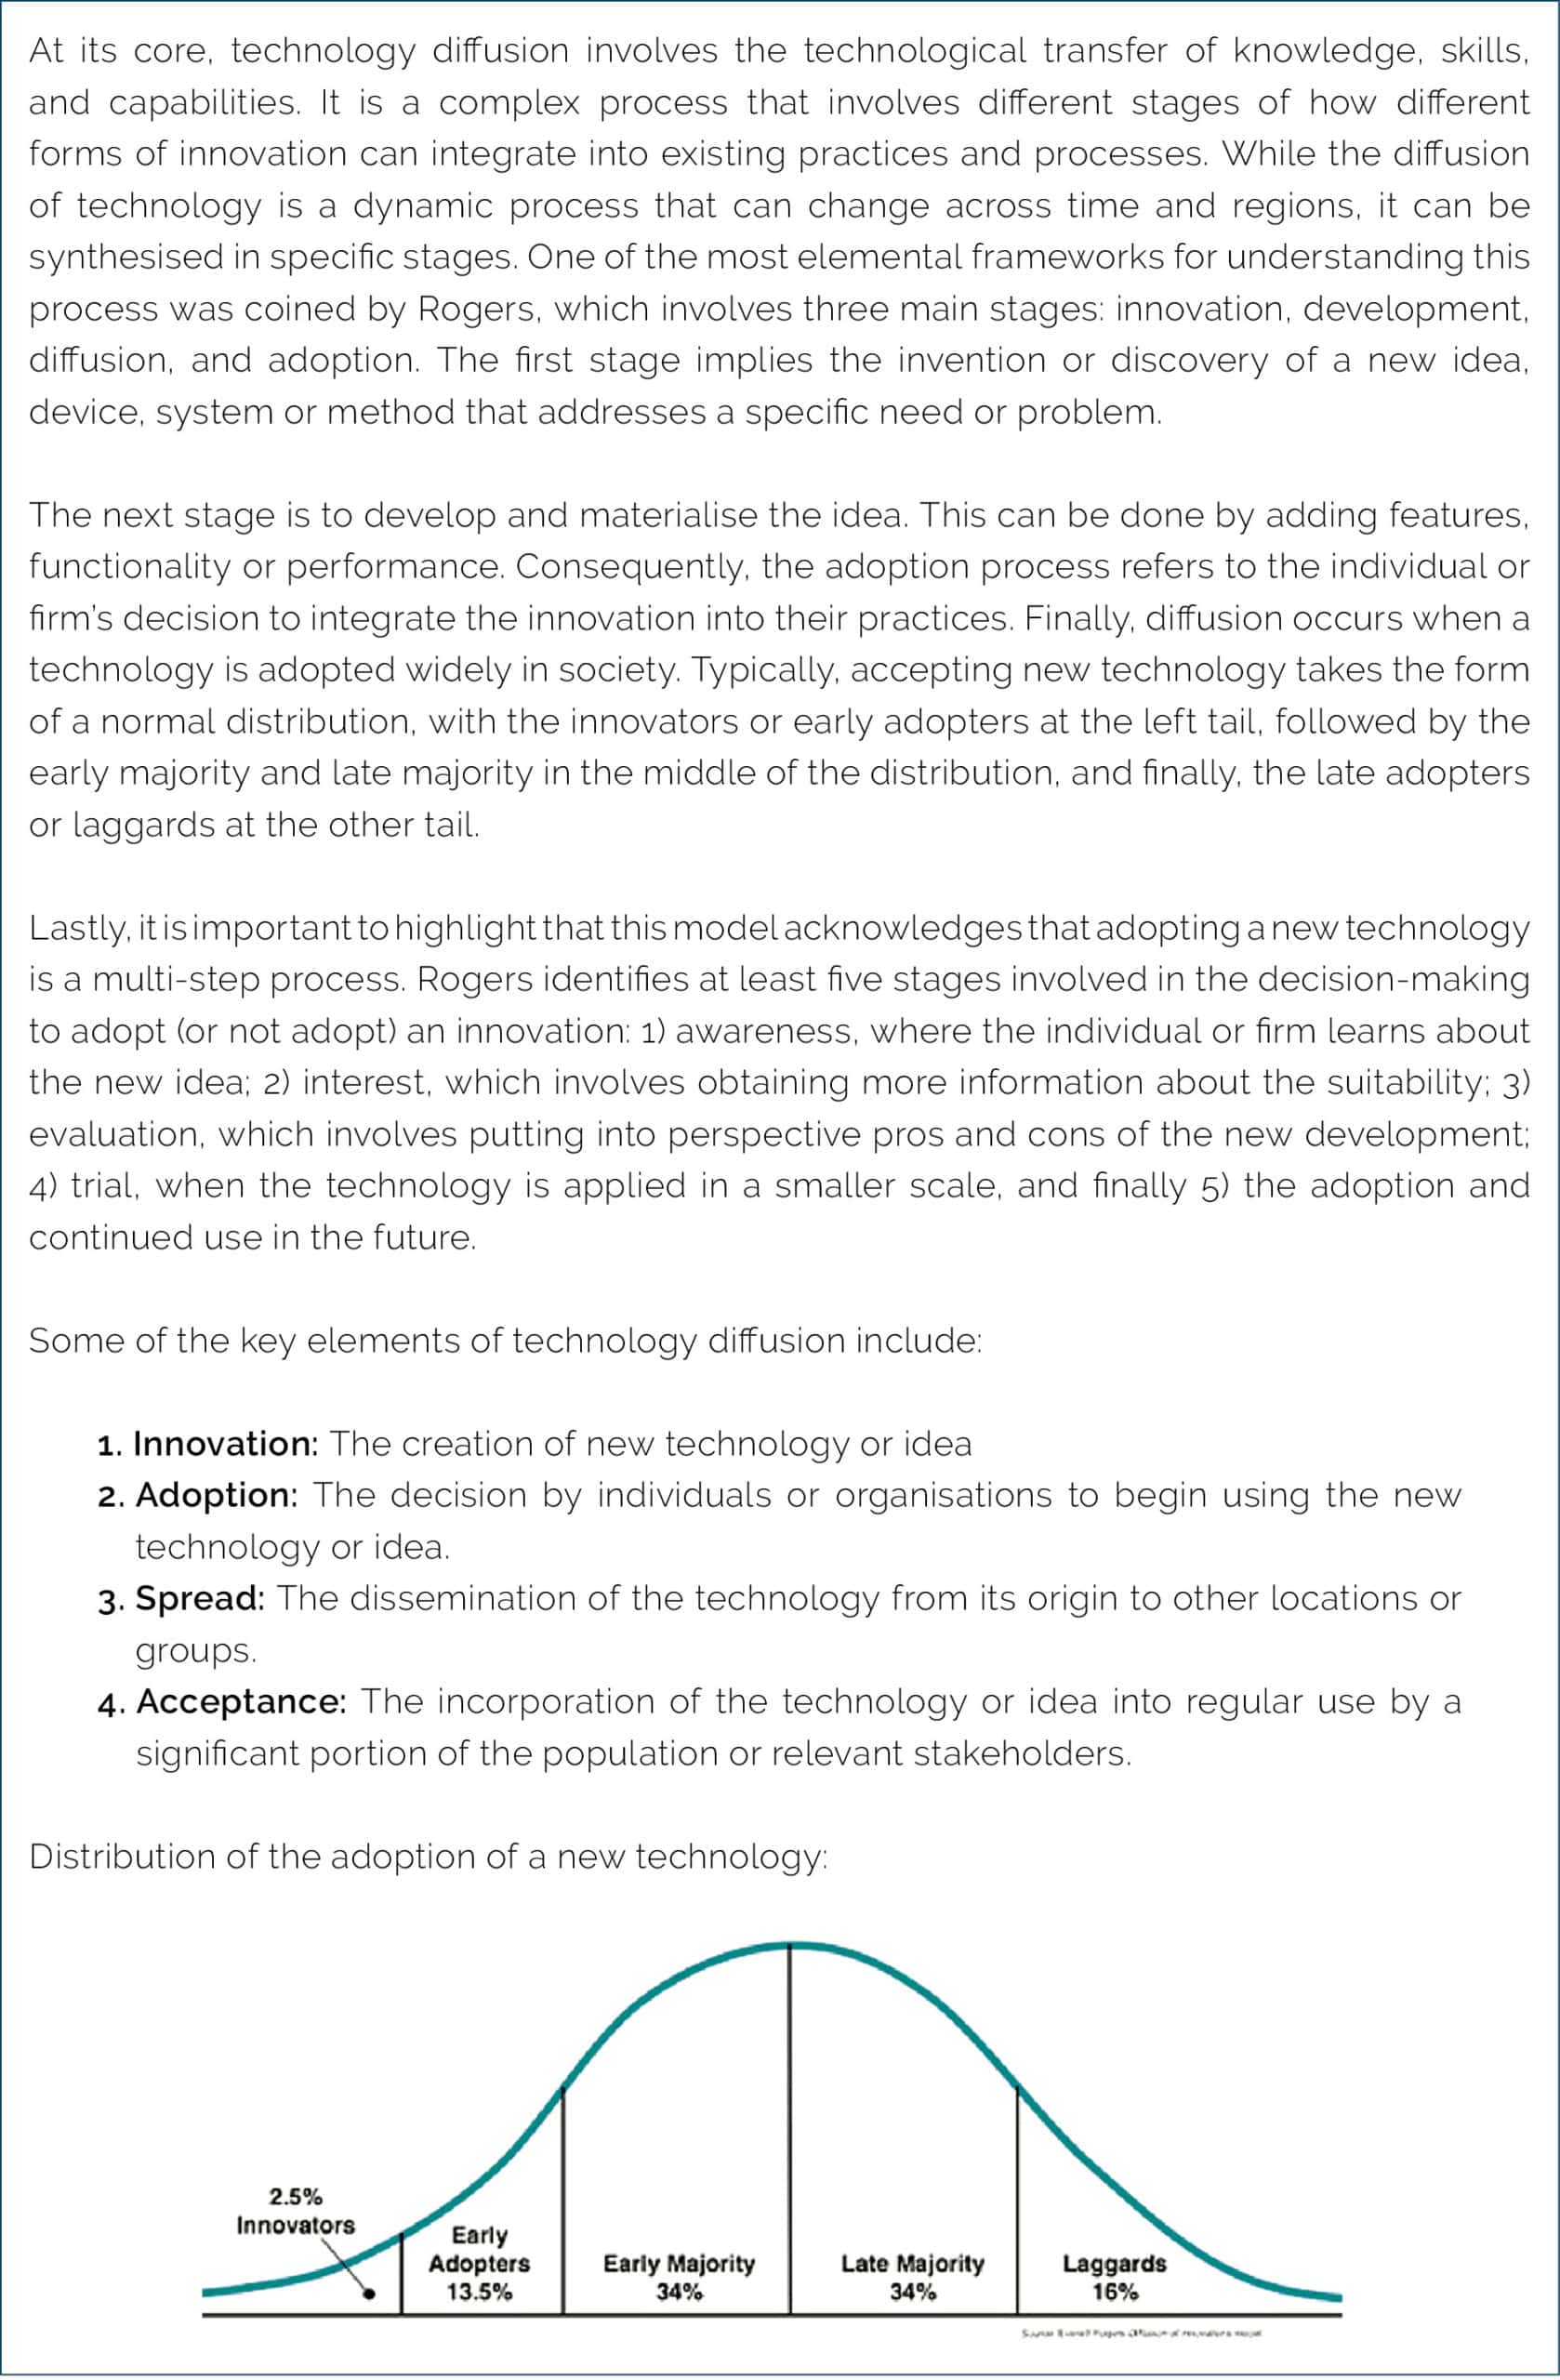 Source: Rogers’ Innovation Diffusion Theory (1962, 1995). See footnote 2.
The Importance of Distinguishing Technology Creation from Technology Diffusion
For policymakers aiming for long-term objectives, it is essential to differentiate between technology creation and dissemination (diffusion in a narrower sense):
- Technology Creation: This involves the development of new innovations, requiring substantial investments in R&D, education, and infrastructure to generate cutting-edge technologies and maintain a competitive edge.
- Technology Dissemination: This focuses on spreading and commercialising these innovations across industries and regions. Effective diffusion enhances productivity and economic growth by integrating advanced technologies into everyday use, requiring policies that reduce commercial barriers, incentivise adoption, and ensure conducive institutional and market conditions.
The Role of Exports and Imports
Measuring technology creation and diffusion can be approached by analysing the exports and imports of knowledge and technology-intensive (KTI) products and services. These trade activities reflect the movement of technological knowledge across borders, indicating the level of technological advancement and adoption in different regions (see Box 2).
- Exports: High levels of technology-intensive exports suggest a robust technology adoption and creation environment. Countries leading in exports of advanced technologies often have relatively strong R&D capabilities and innovation infrastructure.
- Imports: Significant imports of technology-intensive products can indicate policy conditions conducive to the adoption and diffusion of new technologies. It reflects a country’s openness to integrating advanced technologies from abroad, essential for catching up with foreign innovators.
Box 2: Why trade and investment openness are key for technology access and diffusion
Why Is Technology Diffusion Becoming More and More Important for the EU?
The EU’s decreasing share of global GDP and increasing dependence on “non-EU” technologies highlight the urgent need for policy changes. Improving access to advanced technologies and services is essential for enhancing quality, productivity, and the international competitiveness of EU companies. Immediate action is necessary to ensure that the EU can maintain its technological edge and secure its position as a leader in global innovation. Policymakers must focus on enhancing trade and investment openness, providing the right incentives for firms and public sector institutions to test, experiment with, and adopt new technologies.
For the EU to maintain and regain global economic leadership, policymakers must also focus on improving “diffusion capacity”. Expanding the concept of technology diffusion, only having a strong innovation capacity is not enough for a jurisdiction to maintain economic growth and global leadership. Without the ability to effectively diffuse these innovations, even ground-breaking technological advancements may not lead to sustained economic success. Unlike innovation capacity, which focuses on the creation of new technologies or scientific breakthroughs, diffusion capacity is concerned with how well and how quickly these innovations are commercialised across different sectors of society.[3] Key aspects of diffusion capacity are:
- Institutional Support: Successful diffusion requires strong institutions that can bridge the gap between research and practical application. This involves universities, government bodies, and private sector entities collaborating to ensure that new technologies are transferred effectively from the lab to the marketplace.
- Infrastructure and Networks: The physical and digital infrastructure of a country is crucial for the widespread adoption of new technologies. This includes transportation systems, broadband access, and energy grids that support the rollout and implementation of innovations.
- Human Capital and Skills: A well-educated and skilled workforce is essential for understanding and implementing new technologies. This requires ongoing training and education in specific areas relevant to the innovations being adopted.
- Economic and Policy Environment: The regulatory and economic policies of a country can either facilitate or hinder the diffusion of technology. Policies that promote competition, ease market entry, and support SMEs are particularly important for encouraging the spread of innovations.
- Cultural and Social Factors: The attitudes of firms and consumers toward innovation play a significant role in diffusion. If the culture is open to change and sees the benefits of new technologies, adoption will be faster and more widespread.
- Commercialisation and Market Mechanisms: Turning innovations into marketable products and services is a key part of diffusion capacity. This requires an entrepreneurial ecosystem, access to venture capital, and the ability to reach global markets.
Historical examples of the US and the Soviet Union illustrate this. During the late 19th century, the US excelled not in innovation itself but in diffusion. Despite lagging behind European powers in creating new technologies, the US effectively adopted and scaled these innovations, driving its rise as an economic superpower. By contrast, in the early postwar period the Soviet Union demonstrated strong innovation capacity with fairly significant technological achievements. However, it struggled with diffusion, failing to integrate these innovations across its economy. This diffusion deficit contributed to economic stagnation and ultimately the Soviet Union’s collapse.[4]
European companies have long exhibited strong innovation capacity, as evidenced by their sustained high levels of research and development (R&D) activity, along with impressive scientific and commercial output. However, the EU now faces structural challenges in diffusion capacity. Barriers within the Single Market, restrictive trade policies, high tax levels, complex tax regimes, and limited access to capital impede the widespread adoption of innovations. Additionally, challenges in technological literacy and infrastructure hinder the EU’s ability to fully integrate new technologies across its economy.
The remainder of this paper is structured into three parts:
- Patterns in Trade in Knowledge and Technology-Intensive (KTI) Industries: Section 2 will explore EU and global trade patterns in KTI industries, showing how the EU compares with other regions and identifying key areas for improvement.
- The Prevailing Challenge of Economic and Technological Divergences in the EU: Section 3 will look into additional aspects of technology diffusion beyond imports and exports, examining differences in R&D-intensities in production and skills between economically more and less developed countries in the EU.
- Policies to Improve Technology Diffusion in EU Member States: Section 4 will address specific policies that can improve technology diffusion by enhancing innovation, adoption, and spread of new technologies. It will provide recommendations for creating an environment conducive to technological advancements and ensuring the EU remains competitive on the global stage.
[1] See, e.g., Zhao (2018). Technology and Economic Growth: From Robert Solow to Paul. Available at https://onlinelibrary.wiley.com/doi/epdf/10.1002/hbe2.116.
[2] See, e.g., Miller, R. L. (2015). Rogers’ Innovation Diffusion Theory (1962, 1995). In M. Al-Suqri & A. Al-Aufi (Eds.), Information Seeking Behavior and Technology Adoption: Theories and Trends (pp. 261-274). IGI Global. Available at https://doi.org/10.4018/978-1-4666-8156-9.ch016.
[3] Ding, J. (2023). The diffusion deficit in scientific and technological power: re-assessing China’s rise. Available at https://www.tandfonline.com/doi/full/10.1080/09692290.2023.2173633#abstract.
[4] Ibid.
2. KTI Products and Services: Engines of Technological Progress and Economic Development
Knowledge and Technology Intensive (KTI) sectors are critical for technology diffusion. Measuring technology creation and diffusion through exports and imports of technology-intensive products and services provides valuable insights into a region’s technological capabilities. Characterised by their focus on research, development, and advanced technologies, these sectors drive innovation and technological advancements across industries. By pushing the frontiers of technology, KTI sectors create innovations that other sectors can adopt to enhance productivity and efficiency (see Box 3).
Box 3: The KTI products and services for economic development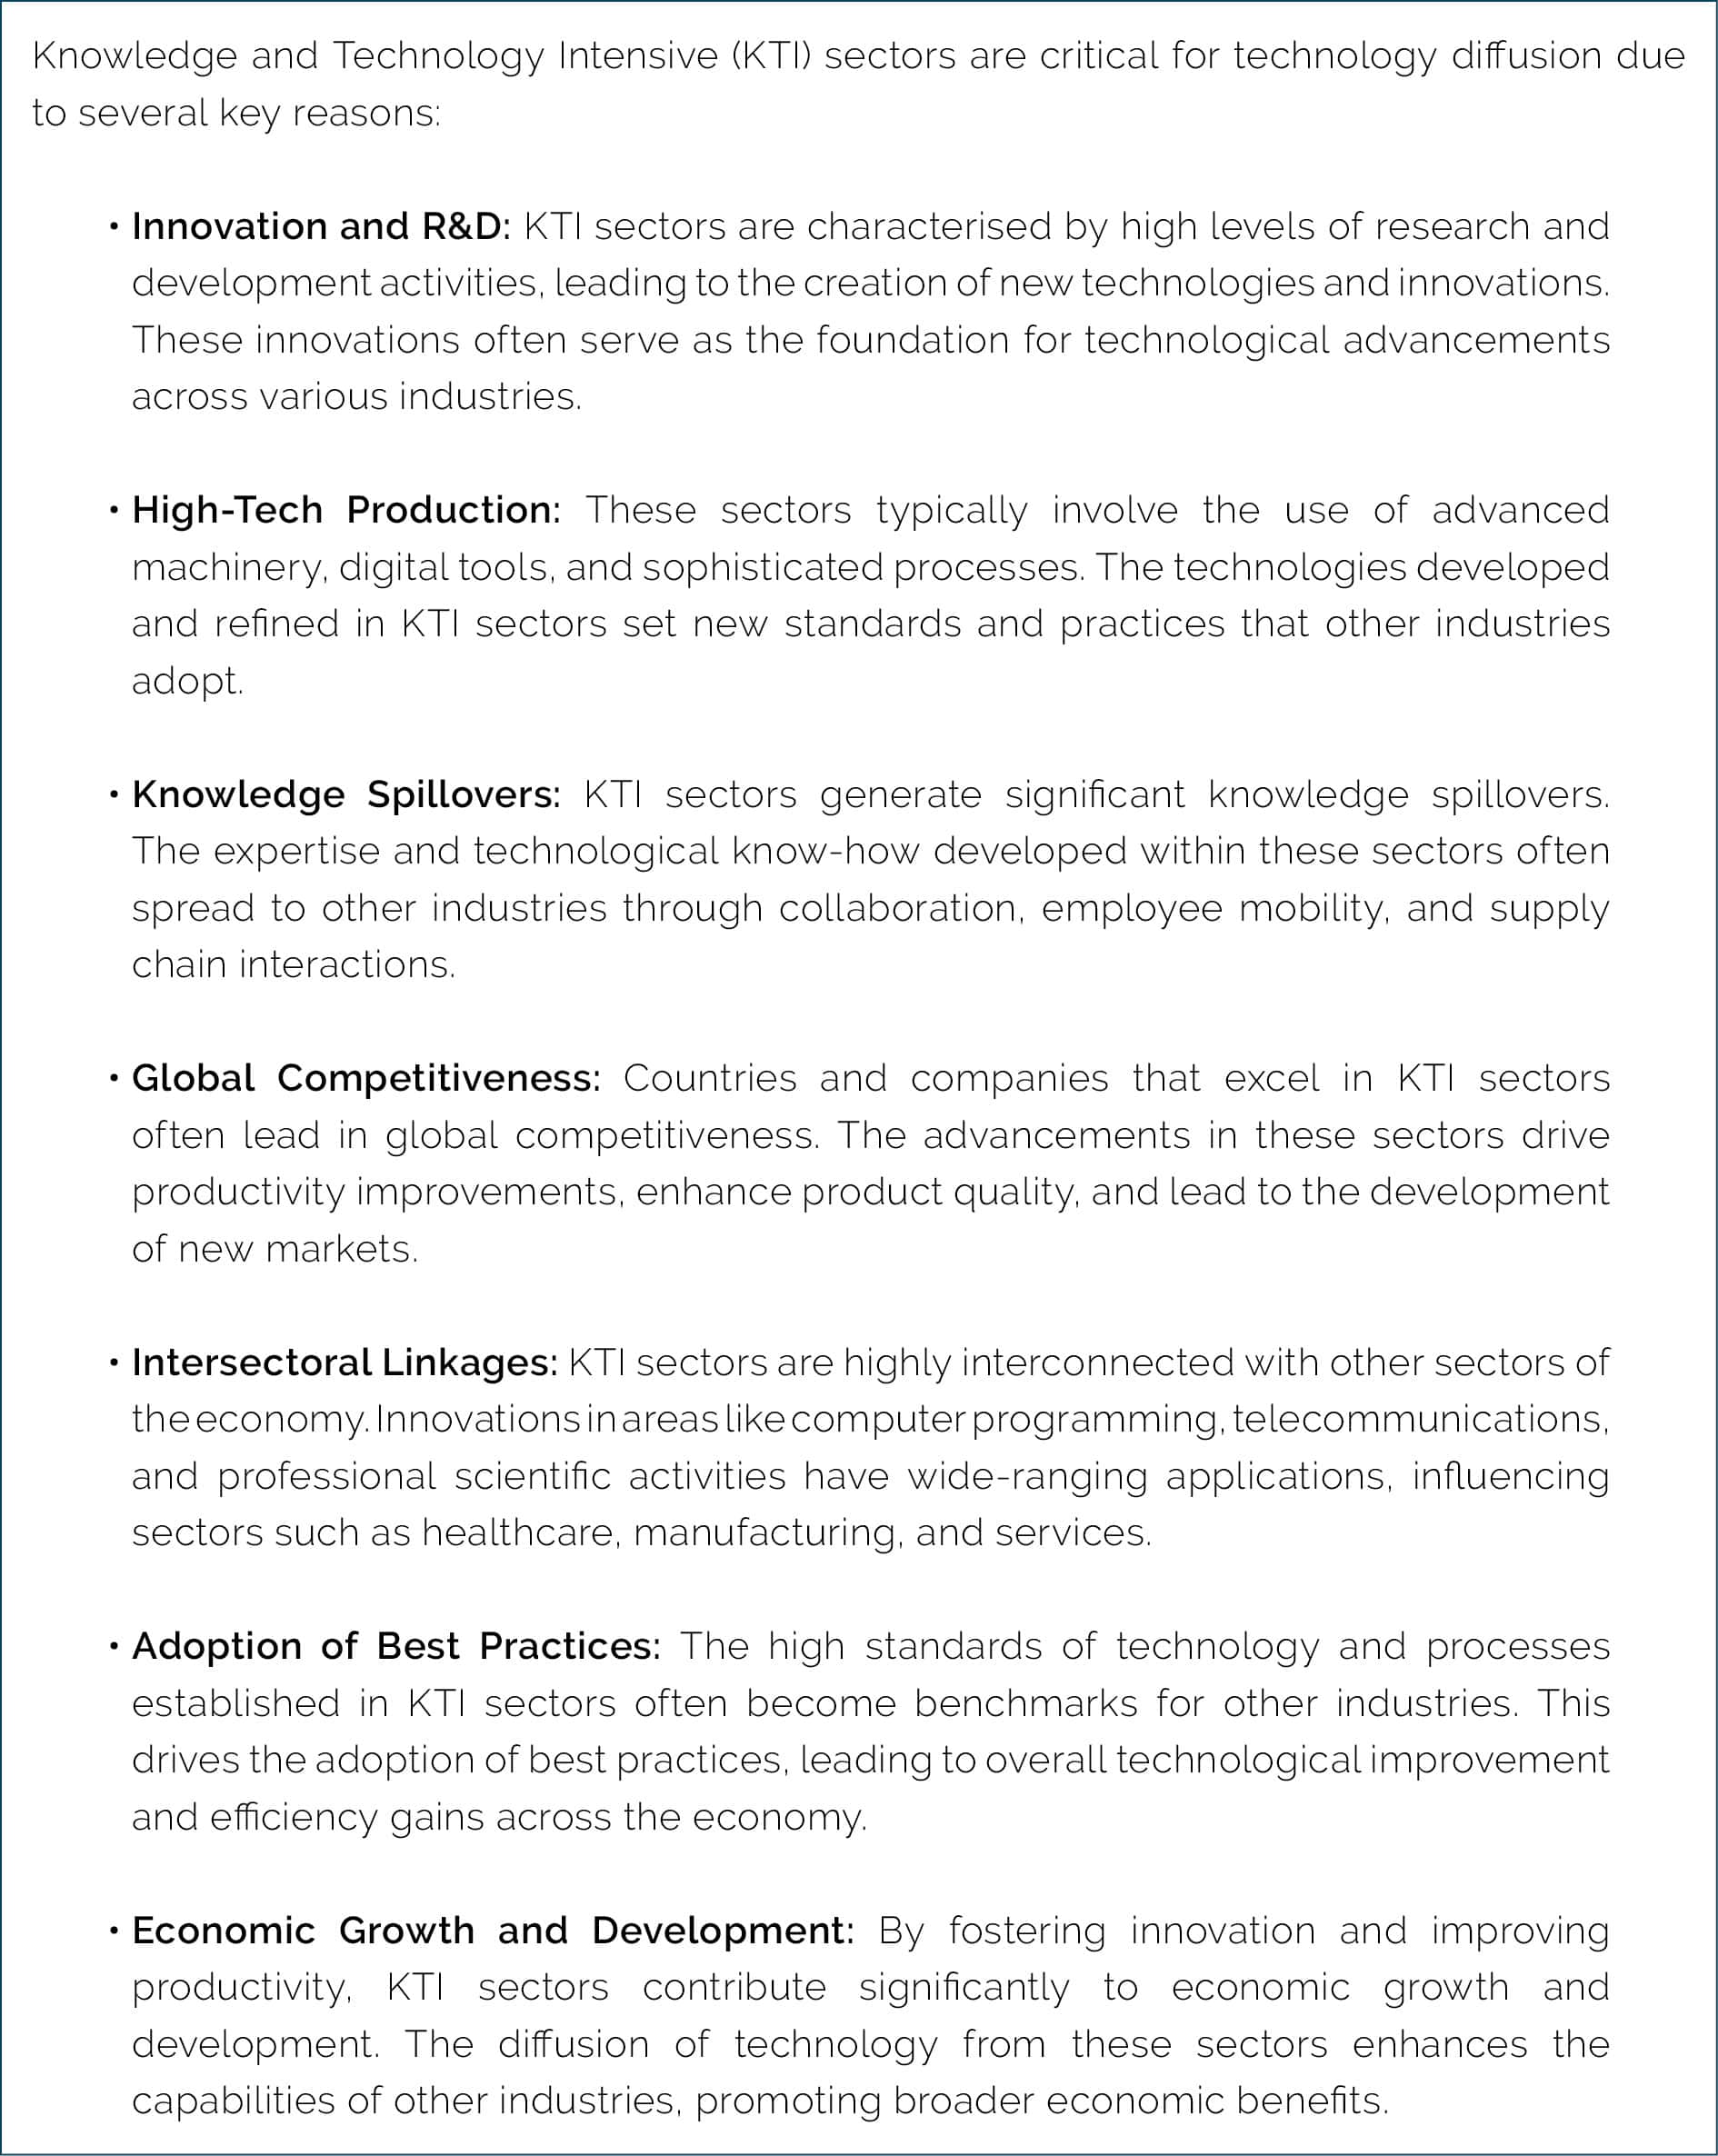
Overall, KTI sectors act as engines of technological change, facilitating the spread of new technologies and practices across the global economy. Their role in generating and disseminating cutting-edge technologies ensures that advancements permeate various industries, leading to widespread economic and social benefits. This cycle of innovation and diffusion positions KTI sectors as pivotal to sustained economic growth and development globally.
The EU, particularly Western European Member States, has historically been a hub for companies and industries specialising in KTI technologies, products, and services. For example, countries like Germany excel in advanced manufacturing, while France and the UK are leaders in aerospace, pharmaceuticals, and biotechnology. Companies such as Airbus, Ericsson, and ASML exemplify the region’s global influence in cutting-edge technologies and high-tech services.
While the EU continues to be a significant player in the trade of KTI goods and services, recent data indicates that other regions outside Europe have made substantial advancements. This shift in the global technological and economic landscape, coupled with the growing research and development capacities worldwide, suggests that the EU’s export surpluses in these sectors may diminish or even vanish in certain areas.
A lower export surplus in the EU, or individual Member States, may not necessarily pose a significant problem if EU citizens and companies continue to adopt technologies from abroad and integrate them into their own R&D and production processes. By importing advanced technologies, Member States can enhance domestic innovation capabilities and gain and maintain competitive advantages without relying solely on export-driven growth. This approach fosters economic resilience and diversification, enabling the EU to remain a vital player in the global technological landscape. Leveraging global advancements through imports and the attraction of investments can stimulate domestic industries, leading to the development of competitive products and services that can be exported, thereby contributing to economic development.
Leveraging both technology imports and exports also aligns with the broader goal of contributing to the global public good by participating in the international division of labour. Embracing global technological innovations enhances the EU’s integration into the global economy, fostering stronger international relationships and trade partnerships. Focusing on adopting and enhancing imported technologies not only benefits the EU but also reinforces its commitment to international cooperation and development, ensuring that it remains at the forefront of global economic and technological progress.
Below, we outline major patterns in EU trade in manufacturing and services sectors for which the use of technological capacities (equipment, infrastructure) and expertise is high (see Table 1).[1] The analysis is performed along two dimensions. First in relation to the EU’s trade with its main partners, such as the US, China, Japan, South Korea. Second, specific EU countries dynamics are also investigated, with a focus on intra-EU trade volumes.
Table 1: Knowledge and Technology Intensive sectors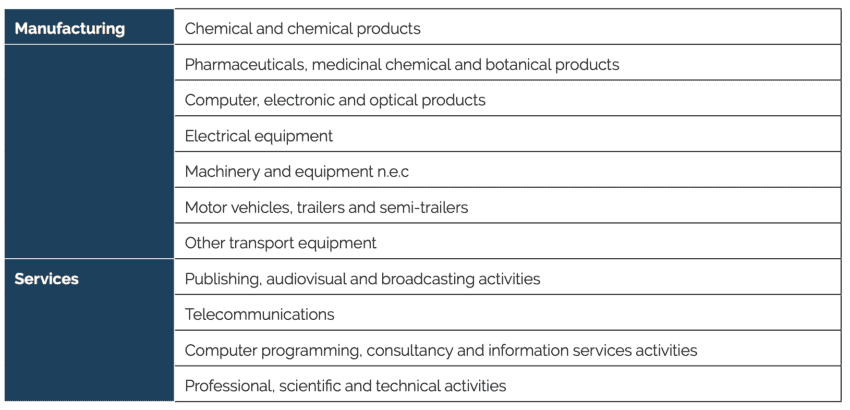 Source: National Science Board.
2.1. EU Trade in KTI Products and Services with Major Partner Countries
Figure 1 and Figure 2 illustrates the EU’s trade position with China, Japan, South Korea, and the US in 2020 in aggregate Knowledge and Technology Intensive (KTI) products and services sectors.
2.1.1. EU KTI Products Trade
In 2020, the EU imported KTI products primarily from China, amounting to USD 188.9 billion, making it the largest import source. Imports from the US totalled USD 76.2 billion, followed by Japan with USD 32.8 billion, and South Korea at USD 27.6 billion. The total imports from non-EU countries reached USD 558 billion, while imports within the EU were USD 798 billion, indicating substantial internal trade activity.
On the export side, the EU’s largest export destination was the US, with exports valued at USD 200 billion. Exports to China were USD 134 billion, followed by Japan at USD 33 billion and South Korea at USD 23.8 billion. Total exports to non-EU countries amounted to USD 945 billion, and exports within the EU were USD 813.4 billion.
The trade balance reveals that the EU had a trade surplus in extra-EU trade of USD 387 billion. The highest surplus was registered for trade with the US (USD 124 billion). In contrast, there was a trade deficit with China (USD 54.5 billion), South Korea (USD 3.8 billion), and within the EU (USD 15.2 billion).
Figure 1: EU trade in KTI products in 2020 by trading partner (in billion USD)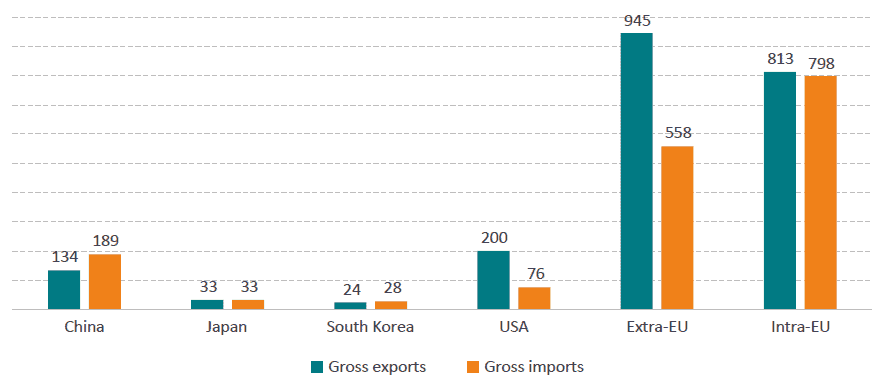 Source: Authors’ calculations based on OECD-TiVa.
2.1.2. EU KTI Services Trade
Contrary to products, the KTI trade balance for services highlights the EU’s difficulty to innovate and produce in high tech sectors. In 2020, the EU imported KTI services primarily from the US, amounting to USD 112 billion, making it the largest import source. Imports from China totalled USD 21.2 billion, followed by Japan with USD 7.3 billion, and South Korea at USD 3.5 billion. The total imports from non-EU countries reached USD 339 billion, while imports within the EU were USD 391 billion, indicating significant internal trade activity.
On the export side, the EU’s largest market was the US, with exports valued at USD 58 billion. Exports to China were USD 27.4 billion, followed by Japan at USD 22.5 billion and South Korea at USD 5.4 billion. Total exports to non-EU countries amounted to USD 339 billion, and exports within the EU were USD 387 billion.
The trade balance reveals that the EU had the highest surplus with Japan (USD 15.2 billion), followed by China (USD 6.2 billion) and South Korea (USD 1.9 billion). The largest deficit was with the US, at USD 53.8 billion.
Figure 2: Extra-EU trade in KTI services in 2020 by trading partner (in billion USD)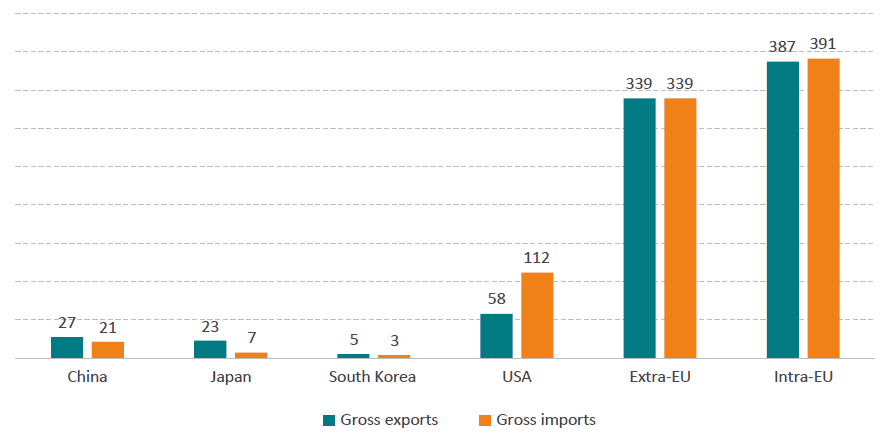 Source: Authors’ calculations based on OECD-TiVa.
In 2020, the EU’s trade balance in knowledge and technology-intensive (KTI) products and services showcased significant surpluses in several manufacturing categories. The highest surplus was in machinery and equipment, amounting to USD 148.3 billion, followed closely by motor vehicles, trailers, and semi-trailers with a surplus of USD 131.9 billion. Pharmaceuticals, medicinal chemical, and botanical products also displayed a strong trade surplus of USD 94.2 billion, highlighting the EU’s leading role in these sectors. Chemical and chemical products added a surplus of USD 41.8 billion, while other transport equipment contributed USD 31.7 billion. The EU also saw a surplus in computer programming, consultancy, and information services activities (USD 21.1 billion), reflecting its competitive advantage in certain high-tech services. Electrical equipment rounded out the surplus categories with USD 15.8 billion. These substantial surpluses indicate the EU’s robust export capabilities and its ability to maintain a competitive edge in various high-value sectors.
On the other hand, the EU experienced notable trade deficits in specific high-tech and service sectors. The largest deficit was in computer, electronic, and optical products, which amounted to USD -75.7 billion, indicating a significant reliance on imports in this category. Publishing, audiovisual, and broadcasting activities also recorded a deficit of USD -16.1 billion, followed by telecommunications with a USD -4.1 billion deficit. Professional, scientific, and technical activities had a smaller deficit of USD -3.2 billion. These deficits highlight the areas where the EU imports more than it exports, particularly in high-tech products and specialised services. Despite these deficits, the overall trade balance remains positive due to the substantial surpluses in other key sectors. This balanced trade performance underscores the EU’s strength in manufacturing and certain service industries, while also pointing to potential areas for improvement in high-tech product innovation and production.
Figure 3: Extra-EU trade in KTI products and services in 2020 (in billion USD)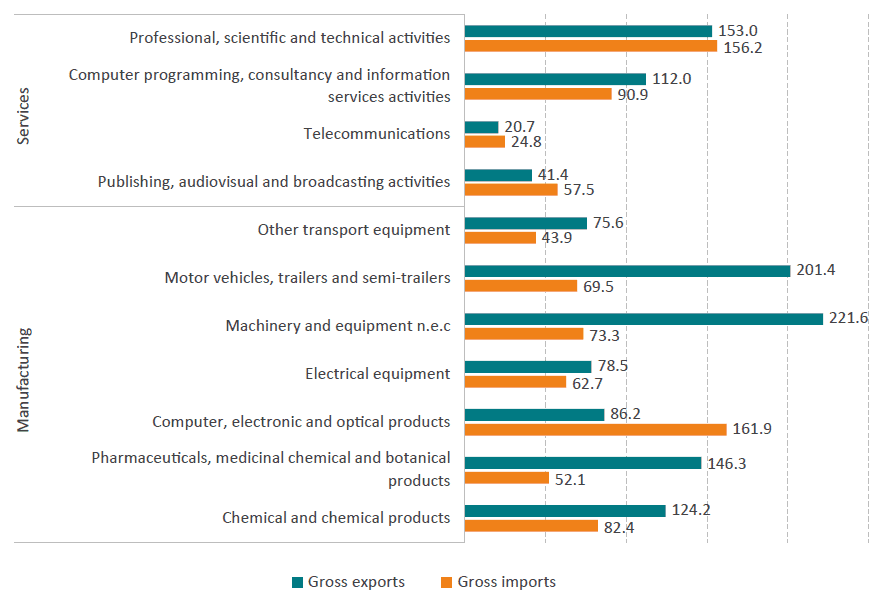 Source: Authors’ calculations based on OECD-TiVa.
2.2. Trade and Technology Diffusion: Key Insights from KTI Sectors
Technology diffusion plays a crucial role in enhancing the competitiveness and economic growth of countries. To provide a meaningful comparison between countries of different sizes, the following analysis focuses on trade per capita figures rather than aggregate trade flows by country. This approach allows us to better understand the relative contribution and benefits of technology diffusion within each country, offering a more accurate picture of the technological landscape across nations of varying population sizes. Below, technology creation and diffusion patterns are discussed for five KTI sectors. Summary information for all 11 KTI sectors is provided in Table 2. Detailed data and analysis is provided in Annex II and Annex III.
Generally, the patterns of technology diffusion within the EU and between the EU and other countries highlight a dynamic landscape where both advanced and developing economies play crucial roles. While several small open economies like Luxembourg, Ireland, and Slovenia are major contributors to technology creation, others such as Lithuania, Latvia, and Malta are significant beneficiaries of technology imports. At the same time, as will be shown below, many economically less developed EU countries have successfully increased their contributions to technology creation and exports, showcasing the potential for future growth. The interplay between these dynamics underscores the importance of technology diffusion in fostering economic development and competitiveness within the EU.
2.2.1. Contributors to Technology Creation in the EU
Several EU countries have established themselves as key contributors to technology creation through robust production and export activities. Available data from 2020 shows that Ireland stands out prominently across several sectors, reflecting its strong export capabilities and strategic positioning within the EU. The most striking example is in the Pharmaceuticals, Medicinal, Chemical, and Botanical Products sector, where Ireland recorded an exceptional USD 12,037 per capita in exports, far surpassing other countries. This remarkable figure underscores Ireland’s strength in pharmaceutical manufacturing and innovation, making it a critical player in the global health sector. Additionally, Ireland leads the Computer, Electronic, and Optical Products sector with exports of USD 3,644 per capita, highlighting its significant role in high-tech manufacturing and IT services. The country also excels in Chemicals and Chemical Products, achieving USD 2,951 per capita, which emphasises its advanced chemical industry. Furthermore, in the Publishing, Audiovisual, and Broadcasting Activities sector, Ireland reached USD 2,800 per capita, showcasing its vibrant media and content creation industries. Such figures collectively underscore Ireland’s dominance and strategic importance in these high-value sectors within the EU.
Luxembourg also demonstrates remarkable performance, particularly in sectors linked to high technology and professional services, positioning itself as a hub for advanced economic activities. In the Computer Programming, Consultancy, and Information Services Activities sector, Luxembourg achieved an impressive USD 13,994 per capita, illustrating its robust ICT sector and its capacity for innovation in digital services. This is complemented by Luxembourg’s performance in Professional, Scientific, and Technical Activities, where it recorded USD 10,381 per capita, reflecting the country’s strength in providing high-value professional services and its appeal as a business and financial centre. Moreover, Luxembourg leads the Telecommunications sector with USD 2,094 per capita, indicating a highly developed telecommunications infrastructure and a strong export-oriented service industry. These high per capita export values highlight Luxembourg’s advanced technological infrastructure and its strategic role in providing high-value services within the EU market.
Denmark and Slovakia also emerge as leaders in their respective high-value sectors, each showcasing unique strengths that contribute significantly to the EU’s export economy. Denmark excels in the Machinery and Equipment sector with exports of USD 1,216 per capita, reflecting its industrial expertise and capacity for manufacturing complex machinery. Denmark also performs strongly in the Pharmaceuticals, Medicinal, Chemical, and Botanical Products sector, reaching USD 2,072 per capita, which underscores its competence in pharmaceutical production and biotechnology. On the other hand, Slovakia is notable for its achievements in the Motor Vehicles, Trailers, and Semi-Trailers sector, boasting the highest per capita exports of USD 2,605. This highlights Slovakia’s pivotal role in the automotive industry, driven by significant investments from global car manufacturers and a highly skilled workforce. These high figures for Denmark and Slovakia reflect their specialised industrial strengths and their significant roles in enhancing the EU’s competitive edge in global markets.
In contrast to the smaller EU countries with exceptionally high per capita exports in specific sectors, the larger economies of Germany, France, and Italy maintain substantial export volumes, reflecting their diversified industrial bases and extensive economic infrastructures. Large EU economies leverage their extensive industrial bases, technological advancements, and skilled workforces to maintain robust export performance across multiple sectors.
Germany, for instance, shows notable performance in several sectors, underscoring its role as an industrial powerhouse in Europe. In the Chemicals and Chemical Products sector, Germany achieves USD 479 per capita in extra-EU exports and USD 533 per capita in intra-EU exports, highlighting its robust chemical industry. Furthermore, Germany’s automotive sector is highly significant, with exports of USD 1,181 per capita in extra-EU and USD 955 per capita in intra-EU for Motor Vehicles, Trailers, and Semi-Trailers. This reinforces Germany’s position as a global leader in automotive manufacturing. Additionally, Germany is strong in Machinery and Equipment, with extra-EU exports of USD 1,160 per capita, reflecting its advanced engineering and machinery production capabilities.
France also demonstrates considerable export strength, particularly in high-value and specialised sectors. In the Other Transport Equipment sector, France leads with extra-EU exports of USD 527 per capita and intra-EU exports of USD 189 per capita, showcasing its prowess in aerospace and other advanced transport equipment manufacturing. France’s role in Publishing, Audiovisual, and Broadcasting Activities is also notable, with exports reaching USD 527 per capita, indicating a significant presence in media and cultural industries. Italy, while not mentioned in the table, similarly maintains a strong export profile across various sectors. Italy’s renowned Machinery and Equipment sector, along with its Automotive and Chemical industries, contribute significantly to its export economy. Both France and Italy benefit from diversified industrial bases, strong manufacturing traditions, and extensive networks of small and medium-sized enterprises (SMEs), which bolster their export capacities across a wide range of goods and services.
2.2.2. Beneficiaries of Technology Diffusion in the EU
Ireland also is a major beneficiary of technology diffusion, showcasing the highest import per capita in multiple sectors. In the Chemicals and Chemical Products sector, Ireland imported USD 1,223 per capita (extra-EU) and USD 824 per capita (intra-EU). Ireland also leads in the Computer, Electronic, and Optical Products sector with USD 1,352 per capita (extra-EU) and USD 489 per capita (intra-EU). Furthermore, Ireland shows significant imports in Publishing, Audiovisual, and Broadcasting Activities with USD 3,465 per capita (extra-EU) and USD 2,053 per capita (intra-EU), as well as in Professional, Scientific, and Technical Activities with USD 5,077 per capita (intra-EU).
Luxembourg also demonstrates high import per capita across several sectors, indicating its role as a key beneficiary of technology diffusion. In the Telecommunications sector, Luxembourg leads with imports of USD 1,154 per capita (extra-EU) and USD 1,451 per capita (intra-EU). Luxembourg also shows high import per capita in Computer Programming, Consultancy, and Information Services Activities with USD 12,587 per capita (intra-EU) and USD 6,148 per capita (extra-EU). Additionally, Luxembourg is a top importer in Professional, Scientific, and Technical Activities with USD 9,769 per capita (intra-EU) and USD 5,692 per capita (extra-EU), highlighting its reliance on and integration with high-value technology sectors.
Belgium and Austria also stand out as significant beneficiaries of technology diffusion. Belgium shows high imports per capita in the Pharmaceuticals, Medicinal, Chemical and Botanical Products sector with USD 948 per capita (intra-EU) and USD 713 per capita (extra-EU). Belgium also imports substantially in Motor Vehicles, Trailers, and Semi-Trailers with USD 1,048 per capita (intra-EU). Austria, on the other hand, demonstrates high import per capita in Chemicals and Chemical Products with USD 823 per capita (intra-EU) and Machinery and Equipment with USD 1,075 per capita (intra-EU). These figures reflect their significant roles in absorbing and integrating advanced technologies into their economies.
Germany, as one of the largest EU economies, demonstrates substantial import activity across various sectors, indicating its significant role in technology diffusion within the region. In the Chemicals and Chemical Products sector, Germany’s imports reached USD 410 per capita (intra-EU) and USD 284 per capita (extra-EU), underscoring its reliance on chemical imports to support its vast industrial base. The Pharmaceuticals, Medicinal, Chemical and Botanical Products sector also shows Germany’s strong import activity, with USD 172 per capita (extra-EU) and significant intra-EU imports. Additionally, Germany is a major importer of Computer, Electronic, and Optical Products, with USD 654 per capita (extra-EU), reflecting its dependence on advanced electronic components to fuel its manufacturing and technological industries. The high import figures in these sectors highlight Germany’s role as a central hub for integrating and utilising advanced technologies from both within and outside the EU.
France and Italy, while not always at the top of the per capita import charts, are still key players in the technology diffusion landscape of the EU. France shows notable import levels in specific high-tech sectors. For example, in the Publishing, Audiovisual, and Broadcasting Activities sector, France’s significant role is reflected through substantial imports, supporting its vibrant cultural and media industries. Although specific per capita figures for France’s imports in the table are not available, its overall import profile remains robust, particularly in high-value and specialised sectors. Italy, similarly, has substantial import activity in sectors crucial for its economy. In the Pharmaceuticals, Medicinal, Chemical and Botanical Products sector, Italy’s imports reached USD 170 per capita (intra-EU), indicating its reliance on pharmaceutical imports to support its healthcare and biotech industries. These import activities in France and Italy underscore their significant roles in adopting and integrating advanced technologies, thereby enhancing their industrial capacities and economic growth within the EU.
2.2.3. Net Contributors to Technology Diffusion
Ireland is a major net contributor to technology diffusion, showcasing the highest trade balance per capita in multiple sectors. In the Pharmaceuticals, Medicinal, Chemical and Botanical Products sector, Ireland had a trade balance of USD 11,463 per capita (extra-EU) and USD 3,498 per capita (intra-EU). Ireland also leads in the Computer, Electronic, and Optical Products sector with USD 2,292 per capita (extra-EU) and USD 1,650 per capita (intra-EU). Furthermore, Ireland shows significant trade balances in Chemicals and Chemical Products with USD 1,728 per capita (extra-EU) and USD 1,138 per capita (intra-EU), as well as in Publishing, Audiovisual, and Broadcasting Activities with USD 3,465 per capita (extra-EU) and USD 2,053 per capita (intra-EU).
Luxembourg also demonstrates high trade balance per capita across several sectors, indicating its role as a key net contributor to technology diffusion. In the Computer Programming, Consultancy, and Information Services Activities sector, Luxembourg had a trade balance of USD 9,889 per capita (intra-EU) and USD 941 per capita (extra-EU). Luxembourg also shows high trade balance per capita in Publishing, Audiovisual, and Broadcasting Activities with USD 4,361 per capita (extra-EU) and USD 156 per capita (intra-EU). Additionally, Luxembourg is a top contributor in Professional, Scientific, and Technical Activities with USD 5,692 per capita (extra-EU) and USD 612 per capita (intra-EU), highlighting its strong export capabilities in high-value technology sectors.
Germany and Slovakia emerge as significant contributors in specific high-value sectors. Germany shows strong trade balances in the Machinery and Equipment sector with USD 910 per capita (extra-EU) and USD 435 per capita (intra-EU), and in Motor Vehicles, Trailers, and Semi-Trailers with USD 947 per capita (extra-EU) and USD 302 per capita (intra-EU). Slovakia leads in the Motor Vehicles, Trailers, and Semi-Trailers sector with a trade balance of USD 2,078 per capita (extra-EU) and USD 1,978 per capita (intra-EU), highlighting its significant role in the automotive industry. These figures reflect their industrial strengths and substantial contributions to technology diffusion within the EU.
2.3. The Vital Role of Open Trade in Driving Technology Diffusion and EU Competitiveness
While large countries might manage better due to their extensive internal markets and diverse economies, both small and large EU Member States benefit from open trade policies that promote technology diffusion. Overly interventionist or protectionist policies could impede this diffusion, undermining economic growth, innovation, and competitiveness across the EU. Therefore, a balanced approach that fosters open trade while protecting strategic interests is crucial for maintaining the EU’s economic dynamism and technological leadership.
Small countries such as Luxembourg, Ireland, and Slovenia, which have established themselves as major contributors to technology creation and major beneficiaries of technology imports from EU and non-EU markets, could be disproportionately affected. These countries rely heavily on the free movement of goods, services, and technology across borders to maintain their high per capita trade balances. For instance, Ireland’s exceptional performance in sectors like Pharmaceuticals and High-Tech Manufacturing is closely tied to its ability to export and import without substantial barriers.
Large EU countries like Germany, France, and Italy, while also affected, might be better equipped to handle the adverse impacts of protectionist policies due to their diversified industrial bases and larger domestic markets. However, these countries still benefit significantly from open trade policies that allow them to export high-value goods and integrate advanced technologies from other countries. Germany’s strong trade balances in sectors such as Machinery, Chemicals, and Automotive reflect its need for both importing advanced components and exporting finished products. Restrictive policies could disrupt these supply chains, increase production costs, and reduce the overall efficiency of its industries. Similarly, France and Italy, which maintain substantial import and export volumes in high-tech and specialised sectors, would face challenges in sustaining their economic growth and technological advancements if trade barriers were increased.
It is also essential to consider the importance of free trade in services sectors, especially in Computer Programming, Consultancy, and Information Services Activities and Professional, Scientific, and Technical Activities, or generally digitally enabled services. These sectors are critical inputs to the production, distribution, and extensive R&D and product development in other sectors, including Machinery, Electrical Equipment, Pharmaceuticals, and Chemical Products. Free trade in digitally enabled services facilitates innovation and efficiency across various industries by ensuring that firms have access to top-tier professional and technical expertise, advanced digital tools, and comprehensive consultancy services. Such integration not only enhances the capabilities of traditional manufacturing sectors but also drives forward technological advancements, productivity gains, and economic growth within the EU. This vital role of digitally enabled services in the broader industrial landscape will be further outlined in the next section where we look into relevant input-output tables.
Table 2: Top 5 contributors to and beneficiaries from technology diffusion in Knowledge and Technology Intensive sectors, by EU Member State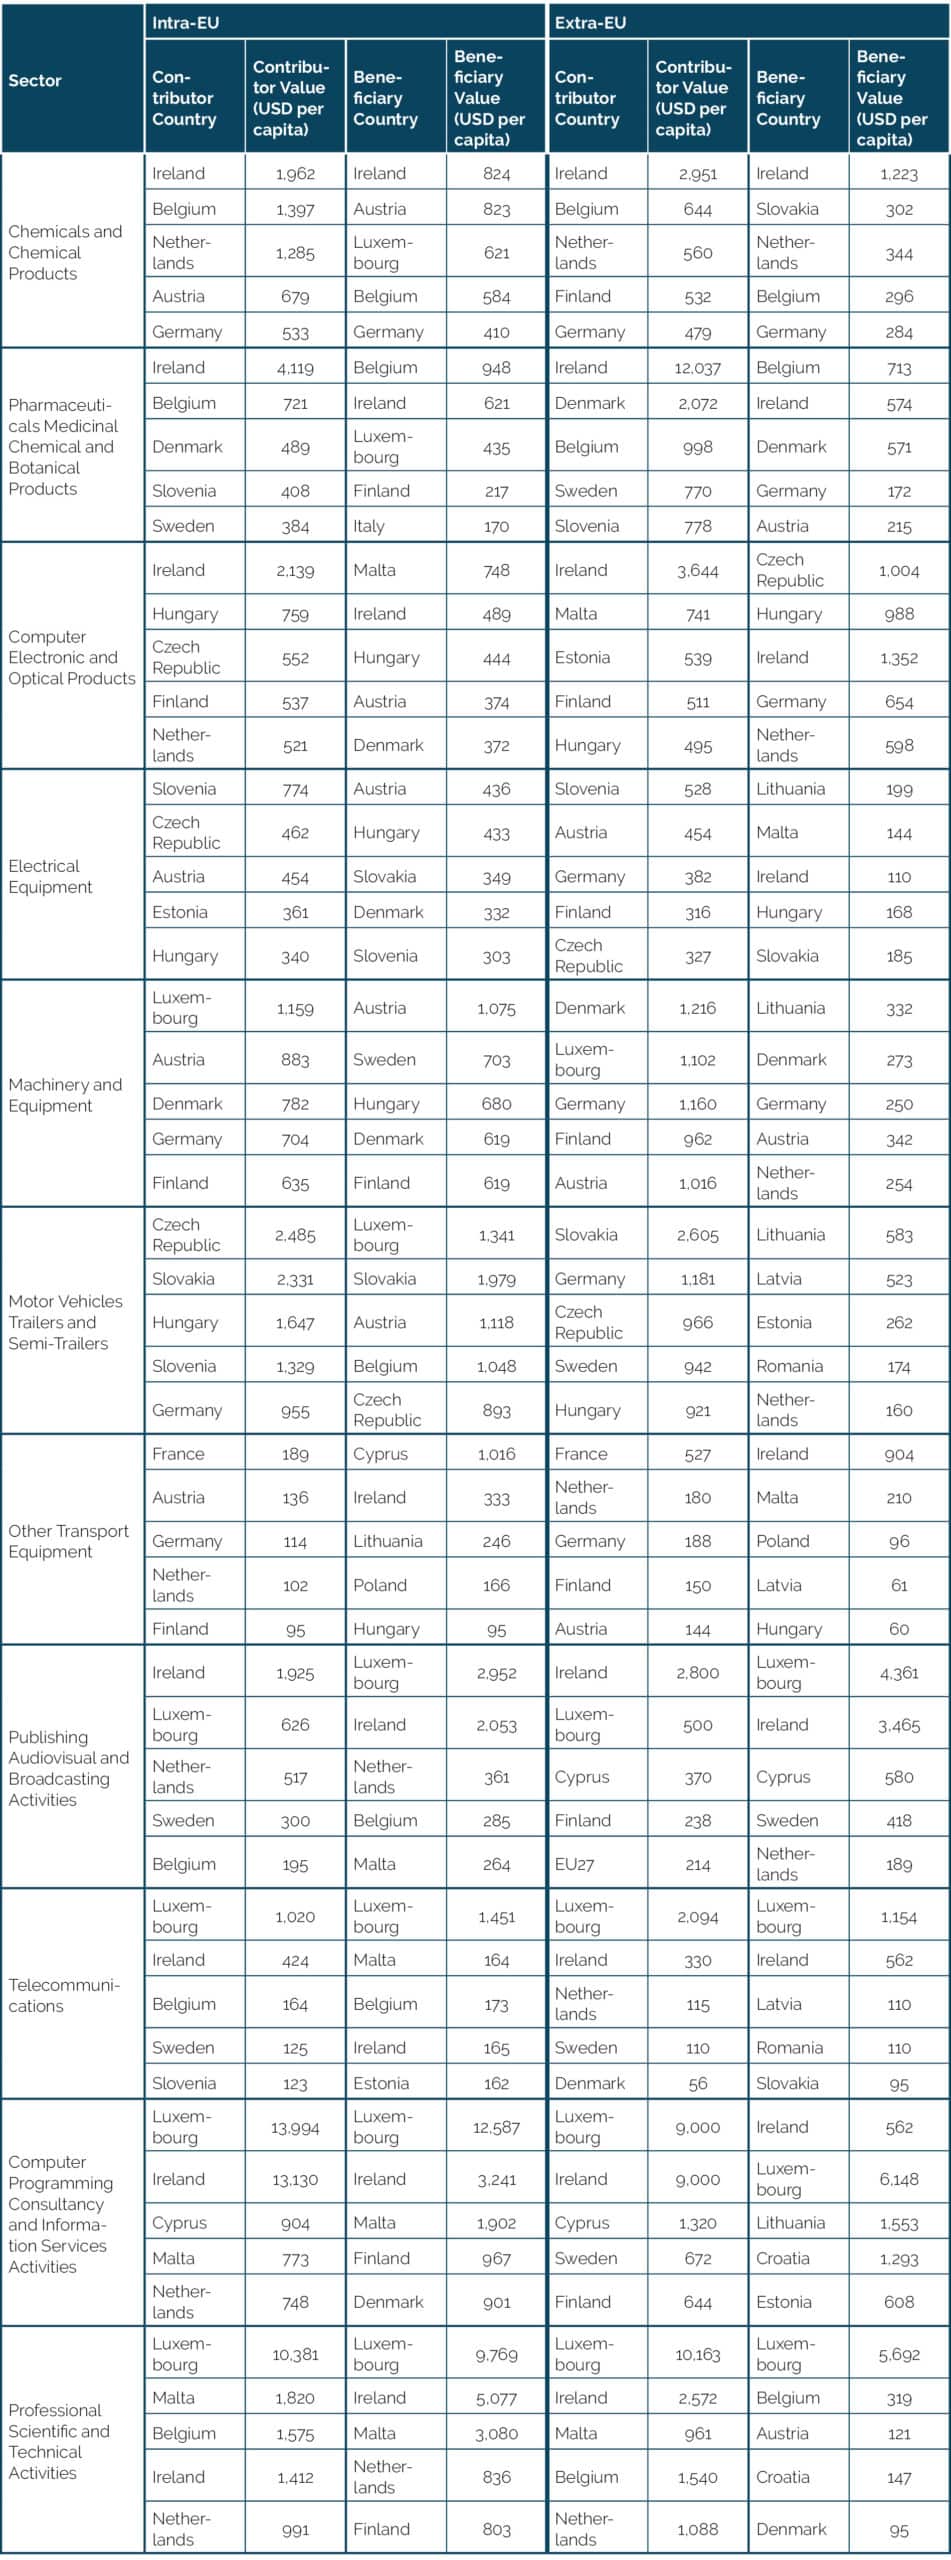 Source: Authors’ calculations based on OECD-TiVa. Note detailed data and analysis is provided in Annex II and Annex III.
2.4. How Imported Tech Services Fuel EU Knowledge-Intensive Sectors
Trade in value-added data reveals that a significant portion of value-added from digitally enabled services, like ICT and professional services, originates within the EU. However, knowledge- and technology-intensive sectors also rely extensively and increasingly on international services imports. This trend reflects the globalisation of these industries. Between 2010 and 2020, there was a decline in domestic value-added from ICT and professional services across most KTI manufacturing sectors, indicating a growing reliance on foreign inputs. The decline in domestic value-added across most KTI manufacturing sectors highlights the critical role that global trade in digital-intensive services now plays in sustaining the EU’s competitiveness, both within manufacturing and across the broader economy.
EU imports from non-EU origins are critical for the production and exports of KTI sectors. In this section, we exemplarily examine the crucial role of digitally enabled services, particularly computer programming, consultancy, and information services as well as professional, scientific, and technical services in bolstering the export competitiveness of EU manufacturing sectors. By leveraging data from the OECD TiVA input-output tables, we illustrate how inputs from these service sectors are essential to produce and export electrical equipment, pharmaceutical products, and machinery and equipment. This analysis allows to understand how imported services, and especially digitally-intensive ones, are embodied into the manufacturing supply chain. These services include various externally sourced IT services, R&D activities, and technical and legal consulting activities. Not only do they improve manufacturing productivity; they also contribute to the overall diffusion of knowledge and ideas across borders.
Table 3 shows the evolution of the value-added content of ICT and professional, scientific, and technical services to the gross exports of different manufacturing sectors for the EU between 2010 and 2020. The analysis allows to identify where a given country or region, such as the EU, sources its imports, which are embodied downstream in a domestic industry’s exports to the rest of world, and from what specific industry. Several noteworthy observations can be drawn from the data:
- Most of the value-added originating from digitally enabled services such as ICT, software, R&D, technical consulting, and legal advice originates in the EU. For instance, in 2020, for gross EU exports of machinery and equipment to the rest of the world, USD 15.8 billion was sourced within the EU, and USD 3.2 billion was imported from outside of the EU. In other words, 83 percent of services inputs into machinery and equipment in the EU were domestically sourced, and 17 percent externally. In comparison, the domestic-foreign value added repartition of those services into the entire EU manufacturing sector was 79 percent domestically sourced (USD 92.4 billion), and 21 percent outside of the EU (USD 25.3 billion).
- Knowledge- and technology-intensive EU manufacturing sectors such as pharmaceuticals and computer and electronic products rely much less on EU-originating ICT and professional services. In 2020, compared to the total manufacturing sector, the pharmaceutical sector sourced 29 percent of such services from outside the EU, and the electronics sector 25 percent. The data indicates that these sectors are relying more on competitive services originating outside the EU, Companies in these sectors are turning to international sources for critical ICT and professional services, reflecting the globalisation of these industries.
- Lastly, the analysis allows to investigate the trend between 2010 and 2020. Overall, in every knowledge-and technology-intensive manufacturing sector (included in our analysis) but for computer products did the domestic value added of ICT and professional service decrease between 2010 and 2020. That means over time a growing proportion of inputs from those services came from abroad, highlighting the importance of trade of digital intensive services. For the entire European manufacturing sector, the domestic value added decreased by 2 percentage points (p.p.), while the largest decrease occurred for the chemical sector, with a decrease of 4 percentage points, from 81 to 77 percent.
Table 3: ICT and professional services value-added content of gross exports for selected sectors in the EU, in USD billion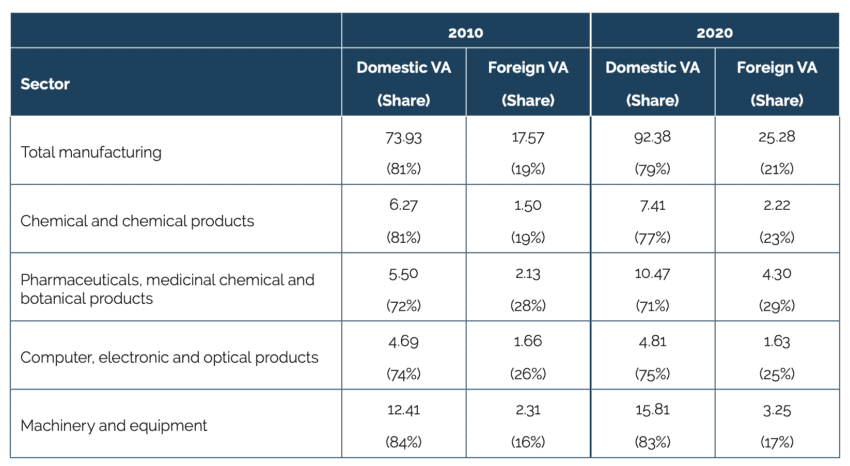 Source: authors’ calculations based on OECD Input Output tables.
[1] Industries are chosen according to the definition of the National Science Board in the US See NSB (2024). Production Patterns and Trends of Knowledge- and Technology-Intensive Industries. Available at https://ncses.nsf.gov/pubs/nsb20226/production-patterns-and-trends-of-knowledge-and-technology-intensive-industries.
3. The Challenge of Economic and Technological Disparities Between Western and Eastern Europe
An overarching objective of the EU is economic convergence, but despite several political efforts, the gap between Western Europe and CEE countries remains a persistent challenge.[1] The economic and technological landscape within the EU showcases a significant divide between Western/Nordic and CEE countries, particularly evident in the trade in value-added data for high-tech services and traditional manufacturing sectors (see above analysis). Western and Nordic countries, like Luxembourg, Ireland, and the Nordic nations, have established strong digital economies with increasing shares in high-tech services, investing heavily in R&D and exhibiting robust growth dynamics. Conversely, CEE countries still rely more on traditional manufacturing sectors, although they are gradually catching up in the services sector. Notable differences also appear in sectors like machinery, automotive, and pharmaceuticals, where Western nations maintain substantial leads in both production and innovation. This divide is further reflected in digital capabilities and workforce skills. Nordic countries, along with some Western European nations, boast the highest percentages of ICT specialists and significant investments in ICT training, leading to stronger and more technology-driven economies.
3.1. Industry Specialisation and the High-Tech Gap Between Western and Eastern Europe
As concerns R&D-intensive manufacturing and service sectors, several economic and technological indicators exhibit a significant economic divide between Western/Nordic and CEE countries. This gap is particularly evident when comparing the trade in value-added data (OECD-TiVa) of high-tech services and traditional manufacturing sectors. Western and Nordic countries boast a strong presence in high-tech services, with this share steadily increasing over time, reflecting their advanced digital economies. CEE countries, on the other hand, still rely more heavily on traditional manufacturing, though they are showing signs of catching up in the services sector.
The Nordic countries in particular are leaders in digital services and data-related technologies. They boast a relatively high number of data suppliers per capita (57-90) and strong firm growth dynamics (around 5 high-growth firms per 100,000 inhabitants). Additionally, their digital services sectors show significant investments in R&D (over 3% of value added), suggesting a strong focus on innovation and commercialisation in technology-intensive activities.[2]
In contrast to the profound Western and Nordic leadership in the high-tech ICT sector, the landscape for traditional manufacturing sectors like machinery and equipment is more balanced. While Western and Nordic countries still hold a significant share in traditional manufacturing, with Germany being a prime example due to its established industrial base, CEE countries are also active players. However, their value-added share in this sector still significantly lags their Western counterparts.
The automotive sector presents a similar picture to machinery and equipment. Western European giants leverage their established industries for a strong presence. However, an interesting divergence emerges when comparing France and Germany. While both are large EU economies, France, with its large domestic market, shows less on R&D within manufacturing sectors compared to its digital services sector. This suggests a possible prioritisation of established production lines over cutting-edge innovation. In contrast, CEE countries like Czechia, Slovakia, and Hungary have made significant strides. These nations boast a growing automotive manufacturing base, often fuelled by foreign direct investments. Notably, they score high in R&D for manufacturing, suggesting a focus on innovation alongside production.[3]
The picture is even starker when we look at pharmaceutical manufacturing. This sector is prominent in Western Europe, with countries like Belgium and Ireland leading due to their substantial pharmaceutical industries. Eastern Europe, on the other hand, has a less developed pharmaceutical manufacturing sector, highlighting a concentration of high-tech pharmaceutical expertise in the West.
Figure 4: Value-added share of manufacturing and services sectors in GDP in 2020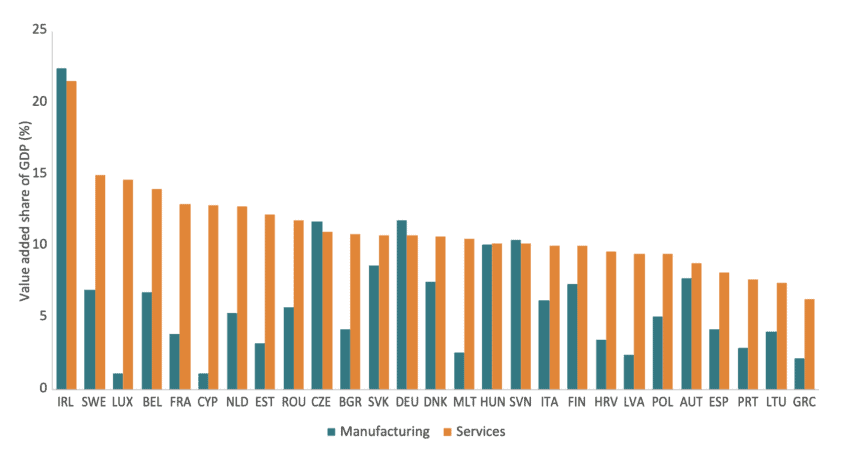 Note: The graph compares the value-added share of GDP from high-tech manufacturing (C20, C21, C26) and services (J, M) for each EU country in 2020. Manufacturing categories are based on OECD’s R&D intensity classification (Galindo-Rueda & Verger, 2016). Source: OECD TiVA and author’s calculations.
The relative importance of different economic activities in each country becomes clear when we examine the value-added share of different sectors in their GDP (data for 2020). Western European powerhouses like Germany (11.8 percent traditional manufacturing, 10.7 percent high-tech services) and Ireland (22.4 percent traditional manufacturing, 21.6 percent high-tech services) demonstrate a balanced economic structure, contributing significantly to both sectors. However, the Netherlands stands out as a service-oriented leader with a hefty 13 percent value-added share in high-tech services compared to just 5 percent in traditional manufacturing.
In contrast, Nordic countries like Sweden (6.5 percent traditional manufacturing, 10.4 percent high-tech services) and Finland (6.2 percent traditional manufacturing, 10.0 percent high-tech services), along with Estonia, showcase a strong emphasis on high-tech services. This reflects their relatively advanced digital economies.
CEE countries, on the other hand, reveal a higher focus on traditional manufacturing compared to high-tech services. This points towards a more industrial-based economy with a slower diffusion of technology-driven services. For example, the Czech Republic’s value-added share is 11.7 percent in traditional manufacturing but only 11 percent in high-tech services. Similarly, Hungary shows a 10.1 percent share in traditional manufacturing versus 10.2 percent in high-tech services.
3.2. The EU’s Struggle to Close Gaps in ICT Skills and STEM Education
While the EU has strengths in STEM education and digital skills in certain regions, the internal disparities and current shortfall in ICT specialists pose risks to its global competitiveness, especially against the backdrop of rapid advancements in China and the enduring innovation capabilities of the US.
A significant digital divide separates Western/Nordic countries from Eastern Europe within the EU. This gap is not simply about access to technology, but also about the skills needed to leverage it effectively.
ICT specialists are individuals with the technical skills to design, develop, implement, and manage information systems. The EU has ambitious digital targets, aiming for 20 million ICT specialists by 2030. However, the current numbers paint a worrying picture, with only 10 million employed in 2023. This shortfall significantly impacts the digital capabilities of the workforce.[4] The disparity is evident when we compare the share of ICT specialists with the value-added contribution of high-tech sectors. Nordic countries, boasting strong digital economies, have the highest percentage of employed ICT specialists, ranging from 6 to 8.7 percent. This is similar to their share of value-added from high-tech sectors. Other digital hubs like Luxembourg, the Netherlands, Ireland, and Estonia also show a strong presence of ICT specialists.
While the EU average for companies providing training in ICT skills sits at 22 percent (2022), Nordic countries like Finland, Sweden, and Denmark lead the way with a staggering 34-40 percent investment.[5] This focus on training translates to a more skilled workforce prepared for the digital age. Interestingly, the picture is not a clear East-West divide. Countries like Poland, Czechia, and Croatia outperform some Western European nations like France, Italy, and Spain in terms of training investments. This highlights two key points: First, the Nordics have a clear advantage in their industry structure and workforce development. Second, the gap with Eastern Europe could be bridged with continued investment in training and education.
The composition of new graduates paints a picture of geographic disparities in STEM education within the EU (2021 data on master’s level graduates).[6] Northern Europe leads the pack with Germany (34.5 percent) and Sweden (32.6 percent) boasting the highest shares of STEM graduates. Denmark (30.9 percent) and Norway (26.1 percent) follow closely behind. For Information and Communication Technology (ICT) graduates specifically, Estonia (10.3 percent) and Ireland (10.5 percent) hold the top positions.
Southern and some CEE countries have lower overall shares of STEM graduates. Spain sits at 15.8 percent, while Greece has a slightly higher figure at 23.7 percent. CEE countries like Poland (20.4 percent), Slovakia (19.5 percent), and Hungary (18.9 percent) demonstrate moderate levels of STEM graduates. However, it’s important to note the disparity in ICT graduates compared to the Nordics and some Western European nations. Slovakia and Czechia have ICT graduate rates of 3.3 percent and 5 percent respectively, highlighting the gap in this crucial digital skillset.
In the global race for digital dominance, the EU faces a significant challenge due to internal disparities and a shortfall in ICT specialists. While the EU has historically been a leader in many technological areas, the rapidly changing global landscape requires a reassessment of its position, particularly when compared to China and the US.[7]
China’s Advantage
China has emerged as a powerhouse in STEM education, producing the largest number of STEM graduates in the world. In 2020 alone, China produced 3.57 million STEM graduates, a figure that dwarfs those of other countries, including the EU Member States. This massive output provides China with a vast pool of technically skilled professionals, which is crucial for advancing in critical areas such as AI, biotechnology, and advanced materials. Chinese investments in education, research, and technology infrastructure have positioned it as a formidable competitor in the global technology race. The sheer scale of its STEM graduate production gives China a significant edge in driving future technological innovation and sustaining economic growth in the long term.
The US Edge
The US, while producing fewer STEM graduates than China, maintains a strong position through its ability to attract and retain global talent. The US is home to some of the world’s leading universities and research institutions, which draw top students and researchers from around the globe. Moreover, the US has established a robust ecosystem for innovation, supported by significant venture capital investments, strong intellectual property protections, and a culture that encourages entrepreneurship. Despite only 20 percent of its graduates being in STEM fields, the US compensates for this by integrating global talent into its workforce, which drives advancements in emerging technologies. The recent focus on expanding AI education and workforce development underlines the US’s commitment to maintaining its technological leadership.
3.3. How Uneven Digital Skills and Intensities Impact Competitiveness and Equality in the EU
The disparity in digital intensities across the EU mirrors the uneven distribution of digital skills, limiting Eastern Europe’s participation in the digital economy and risking deeper inequalities, reduced competitiveness, and potential talent migration without targeted investments in digital skills and infrastructure.
“Digital intensity”, a measure of how extensively firms utilise digital technologies (AI, cloud computing, e-business sales), reveals a significant disparity. Nordic countries are far ahead of Eastern Europe in business uptake of these technologies, with Western Europe hovering around the EU average, particularly for SMEs.[8] This is especially true for AI usage, where Nordic businesses report a 15% adoption rate compared to a mere 4 percent in Hungary, Poland, Bulgaria, and Romania.[9]
The digital divide within the EU presents a complex challenge. While CEE countries are showing signs of catching up, continued investment in high-tech services, workforce development, and digital infrastructure is crucial for a more cohesive and competitive EU in the long run. This economic disparity could lead to several potential consequences:
- Widening inequality: A persistent gap in high-tech sectors could exacerbate existing economic inequalities between Western and Eastern Europe.
- Reduced competitiveness: Without a strong digital foundation, the EU may struggle to compete in the global economy.
- Brain drain: A lack of high-tech opportunities in Eastern Europe could lead to skilled workers migrating westward, further hindering growth.
Digital intensities of EU firms relate to the broader issue of digital skills and the uneven distribution of these skills across Member States. The disparity in digital skills across the EU not only limits the ability of CEE countries to fully participate in the digital economy but also reinforces the challenges these regions face in attracting high-tech industries and retaining skilled workers. Without targeted investments to boost digital skills and infrastructure in lagging regions, the EU risks deepening existing inequalities, undermining its overall competitiveness, and potentially driving talent away from less developed areas to more digitally advanced regions within the Union.
[1] The preamble to the Treaty of the European Union (TEU) states that Member States are “resolved to achieve the strengthening and the convergence of their economies […]”.
[2] Erixon, F., Guinea, O., van der Marel, E., & Sisto, E. (2022). After the DMA, the DSA and the new AI regulation: Mapping the economic consequences of and responses to new digital regulations in Europe. ECIPE Occasional Paper 03/2022. European Centre for International Political Economy (ECIPE).
[3] Ibid.
[4] Eurostat (2024). Employed ICT specialists – total. [Data set]. https://ec.europa.eu/eurostat/databrowser/bookmark/bde9f33a-48c9-4e28-b2cd-63a7043294be?lang=en
[5] Eurostat (2024). Enterprises that provided training to develop/upgrade ICT skills of their personnel by size class of enterprise. [Data set]. https://ec.europa.eu/eurostat/databrowser/bookmark/900364a9-ea90-4bdc-92ba-8fc7cf8f0b59?lang=en
[6] OECD (2023). Graduates by field (STEM as a share of new graduates). [Data set] https://stats.oecd.org/Index.aspx?DataSetCode=EDU_GRAD_FIELD#
[7] See, e.g., CSET (2023). The Global Distribution of STEM Graduates: Which Countries Lead the Way? Available at https://cset.georgetown.edu/article/the-global-distribution-of-stem-graduates-which-countries-lead-the-way/.
[8] Eurostat (2024). Digital Intensity by size class of enterprise. [Data set]. https://ec.europa.eu/eurostat/databrowser/bookmark/ec7dea88-6e16-416e-9944-36ffec539213?lang=en
[9] Eurostat (2024). Artificial intelligence by size class of enterprise. [Data set].https://ec.europa.eu/eurostat/databrowser/bookmark/db83e353-8a47-4123-b6d1-4ddded78ad54?lang=en
4. Concluding Remarks and Policy Recommendations to Push Technology Diffusion in the EU
EU Member States face significant challenges in strengthening or preserving the competitive edge of European firms in technology creation and adoption. To close the widening technology gap between European and global companies and to foster economic convergence within the EU, there is an urgent need for a comprehensive policy agenda. This agenda must focus on ensuring the smooth diffusion of technology through home-grown innovation, effective commercialisation, and robust trade and investment strategies.
4.1. The Need to Recognise Diffusion Capacity
The EU, along with its Member State governments, must navigate a complex landscape of economic and technological challenges to ensure that European companies remain competitive on the global stage. Streamlining governance and removing internal barriers to technology diffusion are essential steps to enhance the competitiveness of firms operating within the EU Single Market. However, this approach must consider not only the capacity to innovate but also the ability to diffuse these innovations across the economy – a lesson highlighted by historical comparisons of rising powers like the US and the Soviet Union.
Traditionally, assessments of a jurisdiction’s scientific and technological capabilities have focused predominantly on innovation capacity – the ability to produce new technologies and groundbreaking advancements. However, this focus can be misleading if not paired with an equal consideration of diffusion capacity, which refers to a region’s ability to widely adopt and integrate these innovations across its economy.
The historical cases of the US and the Soviet Union underscore the importance of technology diffusion to sustain long-term economic growth and technological leadership, which remain crucial for the competitiveness of European firms and the process of economic convergence between Western Europe and Central and Eastern European Member States.
4.2. EU Single Market Policymaking and the Precautionary Principle
The EU can no longer afford to manage complex bureaucratic regimes. Leading by example through streamlined, efficient governance is necessary to create a more dynamic and competitive economic environment.
To enhance the EU Single Market’s competitiveness and technology adoption, it is crucial to remove internal barriers to technology diffusion by harmonising sector-specific and horizontal regulations, simplifying cross-border commerce, and encouraging technology adoption in SMEs. Without these measures, the EU will maintain a multitude of regulatory inefficiencies and increased compliance costs, making European companies less competitive compared to more streamlined markets like the US and China. For less developed EU Member States, regulatory fragmentation and complex trade processes would continue to hinder market integration and economic growth, further depriving them from opportunities and widening the economic gap within the EU.[1]
The way EU and Member State policymakers balance regulatory frameworks with the precautionary principle can either encourage or hinder the cultural and social factors that drive the diffusion of innovation. The precautionary principle has long guided EU approaches to regulation, particularly in areas such as health, safety, and the environment.[2] While the precautionary principle is important for protecting public welfare and preventing potential harm, it must be applied in a way that does not stifle innovation or place unnecessary burdens on firms. Striking the right balance is crucial; regulations should be designed to manage risks without creating barriers that hinder the adoption of new technologies or the growth of European companies. A more flexible and dynamic regulatory approach, underpinned by the highest standards of good regulatory design and reliable regulatory impact assessments, would balance the benefits of innovation against potential risks, ensuring that the EU remains competitive while safeguarding public interests.[3]
Focusing on skills and education is essential to address the shortage of STEM graduates, support lifelong learning, and bridge regional disparities. Without these initiatives, the EU continues to face a significant skills gap, reducing EU firm productivity and innovation, and putting it at a disadvantage compared to the US and China, which have stronger technological education and workforce development. Moreover, without initiatives to improve STEM education, less developed EU countries may face even more severe skills shortages in the future, as many skilled workers migrate to Western Europe. This limits their ability to attract high-tech industries and investments, adopt foreign technologies, and ultimately exacerbates economic disparities and stunts overall growth.
The EU must reassess corporate, labour, and capital taxation policies to better align with the needs of a rapidly evolving global economy. Simplifying and harmonising tax regimes across EU Member States is crucial, with particular consideration given to abolishing corporate income tax for technology-intensive industries to foster innovation and growth.[4] Reforming corporation tax by shifting from taxing profits at the company level to taxing dividends could mitigate the negative impacts on investment and worker productivity, making the European firms more competitive globally. This approach, inspired by Estonia’s system, could simplify the tax code, reduce avoidance, and maintain or even increase revenue while fostering a more transparent and effective taxation of capital income. While this may be a novel approach for some policymakers, it has the potential to significantly boost private sector investments and underpin sustained economic development within the EU.
Providing targeted support to key sectors such as green technologies and R&D is vital for driving economic and technological advancement. Member States should also consider implementing full expensing, allowing firms to immediately deduct the full cost of investments in these crucial sectors. This policy would incentivise greater investment in innovation by reducing the upfront financial burden, ensuring the EU maintains its competitive edge on the global stage. Prioritising these areas is essential for the EU to remain competitive in the global economy.
4.3. Horizontal Digital Policies
Fostering digital innovation and adoption through balanced regulatory policies and promoting the free flow of data are essential for European companies’ competitiveness across industries. Promoting the free data flow and investing in high-capacity digital infrastructure, including advanced cloud and AI technologies, are essential to prevent European companies from falling behind the US and China in continued digital innovation and the commercialisation of new technologies.
Overly stringent or inconsistent regulations will stifle innovation and make European firms less attractive to tech investments, placing them at a disadvantage compared to competitors from the US and China. While larger EU Member States may be somewhat insulated due to their economic gravity, smaller and less economically developed EU countries would face more severe challenges in innovating and competing in the digital economy, exacerbating economic disparities within the EU.
Supporting latest digital infrastructure developments and enhancing digital skills are also crucial for ensuring that the EU remains at the forefront of technological advancements. Insufficient investment in advanced ICT solutions and a lack of skilled workforce can limit access to digital tools and services, reducing productivity and innovation. This puts the EU firms and citizens at a disadvantage compared to the US and China, where digital integration is more advanced.
4.4. EU Cooperation and Leadership in Global Trade and Investment Policy
Enhancing trade and investment openness is crucial for EU-based companies to maintain or gain a competitive edge in technology creation and adoption. Promoting free trade agreements, attracting FDI, and facilitating cross-border collaboration will enable European firms to access and commercialise new technologies, boost innovation, and integrate seamlessly into global markets. Failing to advance these policies can result in relative economic isolation, reducing the EU’s growth opportunities and leaving it behind other thriving regions like the US and China. For less economically developed EU Member States, these policies are vital for accessing necessary technologies, driving economic growth, and reducing the economic divide within the EU.
A return to a liberal global economic order and a reduction in unilateral regulatory actions are essential for preserving the global competitiveness of European industries. By reaffirming its commitment to economic freedom and lowering trade barriers, the EU can avoid economic isolation and stagnation, enabling EU-based companies to effectively compete with their US and Chinese counterparts. Less economically developed EU Member States will benefit from increased trade opportunities and reduced barriers, fostering their economic growth and integration into global markets.
Cooperation and market liberalisation begins at home. Focusing on the internal market through comprehensive strategies and regulatory coherence is critical for reducing operational costs and enhancing market efficiency. A failure to advance these policies can lead to a fragmented market, reducing the EU’s competitiveness and integration compared to the US and China. For less developed Member States, regulatory fragmentation can create significant barriers to business, limiting their market access and economic growth, thus widening the economic divide within the EU.
4.5. Regulatory Cooperation with Like-Minded Partners
Enhancing global regulatory cooperation through mutual recognition and strategic free trade and technology alliances is vital for EU firms to remain competitive on the global stage.[4] Without these measures, EU policymakers risk increased regulatory fragmentation and barriers to trade and investment, falling behind the US and China. Smaller companies from less developed EU countries will face higher barriers to global markets, limiting their export opportunities and economic growth, potentially widening the economic divide within the EU.
Promoting market-led standardisation and forging a strategic free trade and technology alliance, particularly among OECD countries, are crucial steps for the EU to align with global trade and technology standards, thereby strengthening the competitiveness of European companies. Without progress in these areas, the EU risks becoming entangled in a web of incompatible regulations, often self-imposed, which would make international trade more difficult. Increasing levels of regulatory fragmentation would hit less developed regions the hardest, limiting their access to global markets and stifling their economic growth.[6]
4.6. EU Research and Innovation Policy and Skills Development Support
Increasing R&D expenditure by funding universities and improving conditions for private R&D investments is vital for EU companies and research organisations to sustain their innovation capacity and remain competitive against the US, China, and globally. However, the impact of public investments heavily depends on where the funds are directed. Focusing predominantly on public-private partnerships (PPPs) can significantly improve the chances of successful commercialisation, ensuring better returns on taxpayer money.[7]
A continued shortage of STEM graduates could further widen the skills gap between EU Member States and global competitors like China and the US, making it increasingly challenging for industries to secure the talent necessary for high-tech roles. To counter these adverse effects on investment in knowledge- and technology-intensive industries, it is essential to enhance digital skills through robust ICT qualification programs, lifelong learning initiatives, and innovative frameworks for micro-credentials.[8] Professional staff-centric initiatives can help transforming European R&D investments into market-ready innovations, thereby contributing to the EU’s relative global competitiveness. By contrast, neglecting education and qualification efforts could leave less economically developed Member States struggling with digital skill development, missing out on collaborative opportunities, and ultimately facing greater difficulties in technological adoption and economic growth, thereby hindering the process of economic convergence within the EU.
[1] ECIPE (2024). Reinventing Europe’s Single Market: A Way Forward to Align Ideals and Action. Available at https://ecipe.org/publications/reinventing-europes-single-market-align-ideals-and-action/.
[2] For an unorthodox discussion of the precautionary principle, see AEI (2011). The Problems with Precaution: A Principle without Principle. Available at https://www.aei.org/articles/the-problems-with-precaution-a-principle-without-principle/.
[3] For a discussion of the quality of regulation underpinning the EU’s Digital Markets Act, see ECIPE (2022). The EU Digital Markets Act: Assessing the Quality of Regulation. Available at https://ecipe.org/publications/the-eu-digital-markets-act/. Also see, OECD (2020). Regulatory Impact Assessment, OECD Best Practice Principles for Regulatory Policy. Available at https://www.oecd-ilibrary.org/docserver/7a9638cb-en.pdf?expires=1723709682&id=id&accname=guest&checksum=EC404A2A21477438A40459FAFE291F4Bc.
[4] ECIPE (2023). The Imperative of International Cooperation for EU Competitiveness and Resilience in Technology-Driven Industries. Available at https://ecipe.org/publications/international-cooperation-technology-driven-industries/. Also see ECIPE (2024). Openness as Strength: The Win-Win in EU-US Digital Services Trade. Available at https://ecipe.org/publications/openness-strength-eu-us-digital-services-trade/.
[6] For a broader discussion of the rationale underlying of international cooperation, see OECD (2021). International Regulatory Co-operation, OECD Best Practice Principles for Regulatory Policy. Available at https://www.oecd-ilibrary.org/docserver/5b28b589-en.pdf?expires=1723709488&id=id&accname=guest&checksum=9EEC17BAB48D611C8A1364AAFA928CA8 .
[7] See, e.g., OECD (2023). OECD Principles for Public Governance of Public-Private Partnerships. Available at https://ppp.worldbank.org/public-private-partnership/library/oecd-principles-public-governance-ppps.
[8] See, e.g., European Commission (2022). A European approach to micro-credentials. Available at https://education.ec.europa.eu/education-levels/higher-education/micro-credentials.
Annex I: R&D Spending and Capital Expenditure in the EU and the US
Table 4: Cumulative R&D spending by sector in EU and US in 2022, in EUR billion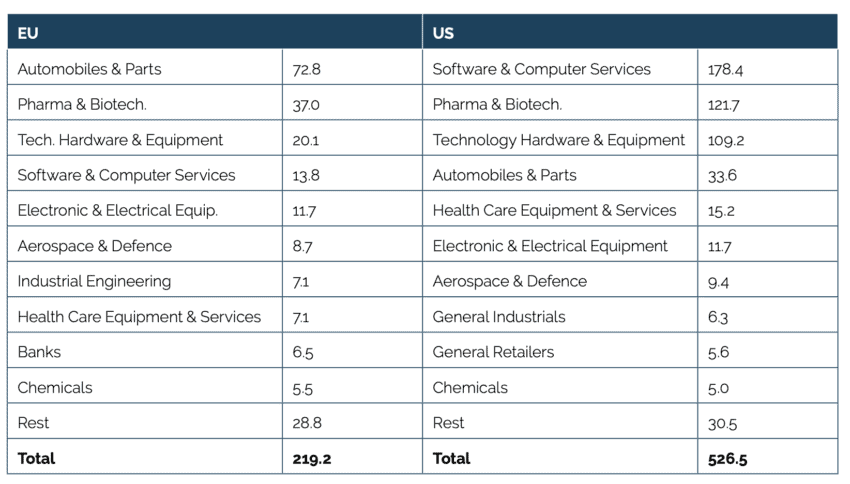 Source: EU Industrial R&D Investment Scoreboard 2023 (World 2,500).
Table 5: Cumulative Capex spending by sector in EU and US in 2022, in EUR billion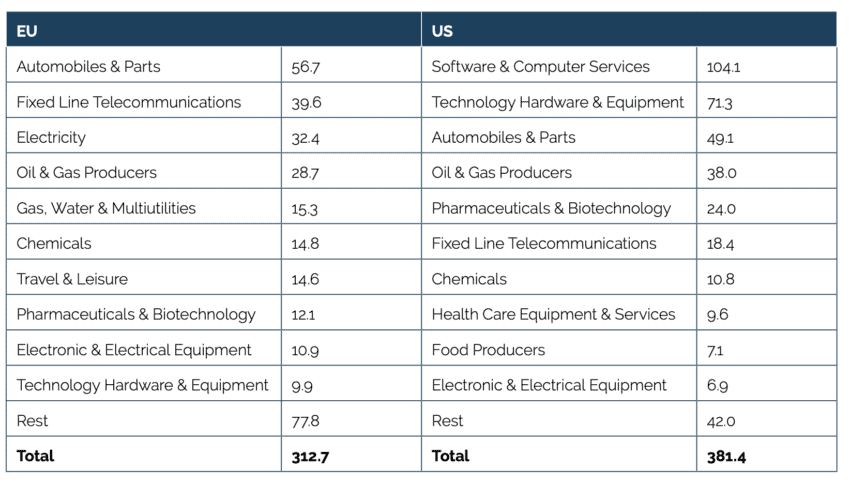 Source: EU Industrial R&D Investment Scoreboard 2023 (World 2,500).
Annex II: Analysis of Patterns in Intra-EU and Extra-EU Trade in Knowledge- and Technology-Intensive Goods and Services
Chemicals and Chemical Products[1]
Contributors to Technology Creation in the EU:
In 2020, the top contributors to technology creation in the EU, as measured by intra-EU exports per capita, were led by Ireland with USD 1,962 per capita. This was followed by Belgium with USD 1,397 per capita, the Netherlands with USD 1,285 per capita, Austria with USD 679 per capita, and Germany with USD 533 per capita. In terms of extra-EU exports per capita, Ireland again led the pack with USD 2,951 per capita. Belgium followed with USD 644 per capita, the Netherlands with USD 560 per capita, Finland with USD 532 per capita, and Germany with USD 479 per capita. These countries have shown substantial contributions to technology creation through their significant export activities within and outside the EU.
Beneficiaries of Technology Diffusion:
Regarding the beneficiaries of technology diffusion in 2020, Ireland topped the list for intra-EU imports per capita with USD 824 per capita. Austria came next with USD 823 per capita, followed by Luxembourg with USD 621 per capita, Belgium with USD 584 per capita, and Germany with USD 410 per capita. For extra-EU imports per capita, Ireland once again led with USD 1,223 per capita. Slovakia followed with USD 302 per capita, the Netherlands with USD 344 per capita, Belgium with USD 296 per capita, and Germany with USD 284 per capita. These countries have been major recipients of technology diffusion through their significant import activities from both within and outside the EU.
Countries with Increased Contribution to Technology Creation and Diffusion:
Between 2010 and 2020, the countries with the highest growth rates in intra-EU exports per capita were led by Ireland, which saw an impressive 730% growth. Latvia followed with 286%, Bulgaria with 95%, Estonia with 70%, and Poland with 63%. In terms of extra-EU exports per capita, Ireland again showed the highest growth at 443%, followed by Lithuania with 133%, Denmark with 57%, Luxembourg with 56%, and Hungary with 48%. For intra-EU imports per capita, Ireland led with a remarkable 795% growth, Slovakia with 144%, Lithuania with 76%, Latvia with 45%, and Romania with 38%. In extra-EU imports per capita, Ireland saw the highest growth at 986%, followed by Estonia with 120%, Bulgaria with 63%, Latvia with 63%, and Hungary with 63%. These figures demonstrate the increasing role these countries have played in both technology creation and diffusion over the last decade.
Trade Balance:
In 2020, the countries with the highest intra-EU trade balance per capita in the chemicals and chemical products sector were led by Ireland with USD 1,138 per capita. Belgium followed with USD 813 per capita, the Netherlands with USD 842 per capita, Germany with USD 123 per capita, and Finland with USD 1 per capita. For extra-EU trade balance per capita, Ireland again led with USD 1,728 per capita, followed by Belgium with USD 348 per capita, Finland with USD 283 per capita, Denmark with USD 263 per capita, and the Netherlands with USD 216 per capita. These trade balances indicate a surplus, showing that these countries have been net exporters of chemicals and chemical products both within and outside the EU.
In summary, Ireland has been a standout contributor in the chemicals and chemical products sector, leading in intra-EU and extra-EU exports, imports, and trade balance per capita. Belgium, the Netherlands, Germany, and Finland also played significant roles in both technology creation and diffusion in this sector, showcasing strong export and import activities and maintaining positive trade balances.
Pharmaceuticals, Medicinal, Chemical and Botanical Products
Contributors to Technology Creation in the EU:
In 2020, the top contributors to technology creation in the EU for pharmaceuticals, medicinal, chemical, and botanical products, as measured by intra-EU exports per capita, were led by Ireland with USD 4,119 per capita. This was followed by Belgium with USD 721 per capita, Denmark with USD 489 per capita, Slovenia with USD 408 per capita, and Sweden with USD 384 per capita. For extra-EU exports per capita, Ireland again topped the list with USD 12,037 per capita. Denmark followed with USD 2,072 per capita, Belgium with USD 998 per capita, Sweden with USD 770 per capita, and Slovenia with USD 778 per capita. These countries have significantly contributed to technology creation through their substantial export activities within and outside the EU.
Beneficiaries of Technology Diffusion:
Regarding the beneficiaries of technology diffusion in 2020, Belgium led intra-EU imports per capita with USD 948 per capita. Ireland followed with USD 621 per capita, Luxembourg with USD 435 per capita, Finland with USD 217 per capita, and Italy with USD 170 per capita. For extra-EU imports per capita, Belgium again led with USD 713 per capita, followed by Ireland with USD 574 per capita, Denmark with USD 571 per capita, Germany with USD 172 per capita, and Austria with USD 215 per capita. These countries have been major recipients of technology diffusion through significant import activities from both within and outside the EU.
Countries with Increased Contribution to Technology Creation and Diffusion:
Between 2010 and 2020, the countries with the highest growth rates in intra-EU exports per capita were led by Bulgaria, which saw an impressive 165% growth. Belgium followed with 106%, Croatia with 84%, Hungary with 82%, and Portugal with 65%. In terms of extra-EU exports per capita, Portugal showed the highest growth at 180%, followed by Belgium with 163%, Denmark with 121%, Cyprus with 117%, and Latvia with 101%. For intra-EU imports per capita, Belgium led with a remarkable 417% growth, Ireland with 291%, Croatia with 215%, Germany with 85%, and Estonia with 69%. In extra-EU imports per capita, Belgium saw the highest growth at 520%, followed by Ireland with 199%, Denmark with 277%, Slovakia with 171%, and Slovenia with 171%. These figures demonstrate the increasing role these countries have played in both technology creation and diffusion over the last decade.
Trade Balance:
In 2020, the countries with the highest intra-EU trade balance per capita in the pharmaceuticals, medicinal, chemical, and botanical products sector were led by Ireland with USD 3,498 per capita. Denmark followed with USD 358 per capita, Slovenia with USD 357 per capita, Sweden with USD 238 per capita, and Belgium with USD 264 per capita. For extra-EU trade balance per capita, Ireland again led with USD 11,463 per capita, followed by Denmark with USD 1,502 per capita, Sweden with USD 706 per capita, Slovenia with USD 506 per capita, and Belgium with USD 285 per capita. These trade balances indicate a surplus, showing that these countries have been net exporters of pharmaceuticals, medicinal, chemical, and botanical products both within and outside the EU.
In summary, Ireland has been a standout contributor in the pharmaceuticals, medicinal, chemical, and botanical products sector, leading in intra-EU and extra-EU exports, imports, and trade balance per capita. Belgium, Denmark, Slovenia, and Sweden also played significant roles in both technology creation and diffusion in this sector, showcasing strong export and import activities and maintaining positive trade balances.
Computer, Electronic, and Optical Products
Contributors to Technology Creation in the EU:
In 2020, the top contributors to technology creation in the EU for computer, electronic, and optical products, as measured by intra-EU exports per capita, were led by Ireland with USD 2,139 per capita. This was followed by Hungary with USD 759 per capita, the Czech Republic with USD 552 per capita, Finland with USD 537 per capita, and the Netherlands with USD 521 per capita. For extra-EU exports per capita, Ireland again topped the list with USD 3,644 per capita. Malta followed with USD 741 per capita, Estonia with USD 539 per capita, Finland with USD 511 per capita, and Hungary with USD 495 per capita. These countries have significantly contributed to technology creation through their substantial export activities within and outside the EU.
Beneficiaries of Technology Diffusion:
Regarding the beneficiaries of technology diffusion in 2020, Malta led intra-EU imports per capita with USD 748 per capita. Ireland followed with USD 489 per capita, Hungary with USD 444 per capita, Austria with USD 374 per capita, and Denmark with USD 372 per capita. For extra-EU imports per capita, the Czech Republic led with USD 1,004 per capita, followed by Hungary with USD 988 per capita, Ireland with USD 1,352 per capita, Germany with USD 654 per capita, and the Netherlands with USD 598 per capita. These countries have been major recipients of technology diffusion through significant import activities from both within and outside the EU.
Countries with Increased Contribution to Technology Creation and Diffusion:
Between 2010 and 2020, the countries with the highest growth rates in intra-EU exports per capita were led by Latvia, which saw an impressive 348% growth. Greece followed with 123%, Belgium with 105%, Bulgaria with 79%, and Estonia with 59%. In terms of extra-EU exports per capita, Latvia showed the highest growth at 747%, followed by Bulgaria with 210%, Ireland with 158%, Portugal with 121%, and Estonia with 76%. For intra-EU imports per capita, Croatia led with a remarkable 163% growth, the Netherlands with 154%, Lithuania with 79%, Romania with 33%, and Bulgaria with 26%. In extra-EU imports per capita, the Netherlands saw the highest growth at 194%, followed by Lithuania with 167%, Latvia with 132%, Sweden with 107%, and Estonia with 71%. These figures demonstrate the increasing role these countries have played in both technology creation and diffusion over the last decade.
Trade Balance:
In 2020, the countries with the highest intra-EU trade balance per capita in the computer, electronic, and optical products sector were led by Ireland with USD 1,650 per capita. Hungary followed with USD 315 per capita, Finland with USD 289 per capita, the Netherlands with USD 306 per capita, and the Czech Republic with USD 266 per capita. For extra-EU trade balance per capita, Ireland again led with USD 2,292 per capita, followed by Malta with USD 280 per capita, Estonia with USD 135 per capita, Denmark with USD 30 per capita, and Latvia with USD -24 per capita. These trade balances indicate a surplus, showing that these countries have been net exporters of computer, electronic, and optical products both within and outside the EU.
In summary, Ireland has been a standout contributor in the computer, electronic, and optical products sector, leading in intra-EU and extra-EU exports, imports, and trade balance per capita. Hungary, Malta, the Czech Republic, and Finland also played significant roles in both technology creation and diffusion in this sector, showcasing strong export and import activities and maintaining positive trade balances.
Electrical Equipment
Contributors to Technology Creation in the EU:
In 2020, the top contributors to technology creation in the EU for electrical equipment, as measured by intra-EU exports per capita, were led by Slovenia with USD 774 per capita. This was followed by the Czech Republic with USD 462 per capita, Austria with USD 454 per capita, Estonia with USD 361 per capita, and Hungary with USD 340 per capita. For extra-EU exports per capita, Slovenia again topped the list with USD 528 per capita. Austria followed with USD 454 per capita, Germany with USD 382 per capita, Finland with USD 316 per capita, and the Czech Republic with USD 327 per capita. These countries have significantly contributed to technology creation through their substantial export activities within and outside the EU.
Beneficiaries of Technology Diffusion:
Regarding the beneficiaries of technology diffusion in 2020, Austria led intra-EU imports per capita with USD 436 per capita. Hungary followed with USD 433 per capita, Slovakia with USD 349 per capita, Denmark with USD 332 per capita, and Slovenia with USD 303 per capita. For extra-EU imports per capita, Lithuania led with USD 199 per capita, followed by Malta with USD 144 per capita, Ireland with USD 110 per capita, Hungary with USD 168 per capita, and Slovakia with USD 185 per capita. These countries have been major recipients of technology diffusion through significant import activities from both within and outside the EU.
Countries with Increased Contribution to Technology Creation and Diffusion:
Between 2010 and 2020, the countries with the highest growth rates in intra-EU exports per capita were led by Latvia, which saw an impressive 358% growth. Lithuania followed with 161%, Ireland with 128%, Luxembourg with 110%, and the Netherlands with 95%. In terms of extra-EU exports per capita, Estonia showed the highest growth at 220%, followed by Latvia with 214%, Ireland with 165%, Romania with 149%, and Lithuania with 153%. For intra-EU imports per capita, Lithuania led with a remarkable 161% growth, followed by Ireland with 76%, Latvia with 63%, Croatia with 40%, and Hungary with 45%. In extra-EU imports per capita, Lithuania saw the highest growth at 199%, followed by Malta with 144%, Poland with 143%, Estonia with 119%, and Bulgaria with 114%. These figures demonstrate the increasing role these countries have played in both technology creation and diffusion over the last decade.
Trade Balance:
In 2020, the countries with the highest intra-EU trade balance per capita in the electrical equipment sector were led by Slovenia with USD 472 per capita. Austria followed with USD 197 per capita, Germany with USD 187 per capita, the Czech Republic with USD 149 per capita, and Poland with USD 110 per capita. For extra-EU trade balance per capita, Slovenia again led with USD 274 per capita, followed by Austria with USD 197 per capita, Germany with USD 187 per capita, Finland with USD 122 per capita, and Italy with USD 75 per capita. These trade balances indicate a surplus, showing that these countries have been net exporters of electrical equipment both within and outside the EU.
In summary, Slovenia has been a standout contributor in the electrical equipment sector, leading in intra-EU and extra-EU exports, imports, and trade balance per capita. Austria, the Czech Republic, Germany, and Finland also played significant roles in both technology creation and diffusion in this sector, showcasing strong export and import activities and maintaining positive trade balances.
Machinery and Equipment
Contributors to Technology Creation in the EU:
In 2020, the top contributors to technology creation in the EU for machinery and equipment, as measured by intra-EU exports per capita, were led by Luxembourg with USD 1,159 per capita. This was followed by Austria with USD 883 per capita, Denmark with USD 782 per capita, Germany with USD 704 per capita, and Finland with USD 635 per capita. For extra-EU exports per capita, Denmark topped the list with USD 1,216 per capita, followed by Luxembourg with USD 1,102 per capita, Germany with USD 1,160 per capita, Finland with USD 962 per capita, and Austria with USD 1,016 per capita. These countries have significantly contributed to technology creation through their substantial export activities within and outside the EU.
Beneficiaries of Technology Diffusion:
Regarding the beneficiaries of technology diffusion in 2020, Austria led intra-EU imports per capita with USD 1,075 per capita. Sweden followed with USD 703 per capita, Hungary with USD 680 per capita, Denmark with USD 619 per capita, and Finland with USD 619 per capita. For extra-EU imports per capita, Lithuania led with USD 332 per capita, followed by Denmark with USD 273 per capita, Germany with USD 250 per capita, Austria with USD 342 per capita, and the Netherlands with USD 254 per capita. These countries have been major recipients of technology diffusion through significant import activities from both within and outside the EU.
Countries with Increased Contribution to Technology Creation and Diffusion:
Between 2010 and 2020, the countries with the highest growth rates in intra-EU exports per capita were led by Latvia, which saw an impressive 273% growth. Lithuania followed with 202%, Bulgaria with 103%, Slovakia with 78%, and Ireland with 71%. In terms of extra-EU exports per capita, Estonia showed the highest growth at 227%, followed by Lithuania with 196%, Bulgaria with 140%, Latvia with 117%, and Luxembourg with 96%. For intra-EU imports per capita, Lithuania led with a remarkable 235% growth, Ireland with 171%, Latvia with 120%, Estonia with 84%, and Slovakia with 71%. In extra-EU imports per capita, Lithuania saw the highest growth at 332%, followed by Bulgaria with 105%, Romania with 104%, Estonia with 100%, and Luxembourg with 96%. These figures demonstrate the increasing role these countries have played in both technology creation and diffusion over the last decade.
Trade Balance:
In 2020, the countries with the highest intra-EU trade balance per capita in the machinery and equipment sector were led by Luxembourg with USD 607 per capita. Germany followed with USD 435 per capita, Austria with USD 435 per capita, Denmark with USD 163 per capita, and the Netherlands with USD 108 per capita. For extra-EU trade balance per capita, Denmark again led with USD 1,069 per capita, followed by Luxembourg with USD 932 per capita, Germany with USD 910 per capita, Finland with USD 726 per capita, and Austria with USD 674 per capita. These trade balances indicate a surplus, showing that these countries have been net exporters of machinery and equipment both within and outside the EU.
In summary, Luxembourg has been a standout contributor in the machinery and equipment sector, leading in intra-EU and extra-EU exports, imports, and trade balance per capita. Austria, Germany, Denmark, and Finland also played significant roles in both technology creation and diffusion in this sector, showcasing strong export and import activities and maintaining positive trade balances.
Motor Vehicles, Trailers, and Semi-Trailers
Contributors to Technology Creation in the EU:
In 2020, the leading contributors to technology creation in the EU for motor vehicles, trailers, and semi-trailers, as measured by intra-EU exports per capita, were the Czech Republic (USD 2,485 per capita), Slovakia (USD 2,331 per capita), Hungary (USD 1,647 per capita), Slovenia (USD 1,329 per capita), and Germany (USD 955 per capita). For extra-EU exports per capita, Slovakia led with USD 2,605 per capita, followed by Germany with USD 1,181 per capita, the Czech Republic with USD 966 per capita, Sweden with USD 942 per capita, and Hungary with USD 921 per capita. These countries have significantly contributed to technology creation through their substantial export activities within and outside the EU.
Beneficiaries of Technology Diffusion:
Regarding the beneficiaries of technology diffusion in 2020, Luxembourg led intra-EU imports per capita with USD 1,341 per capita. Slovakia followed with USD 1,979 per capita, Austria with USD 1,118 per capita, Belgium with USD 1,048 per capita, and the Czech Republic with USD 893 per capita. For extra-EU imports per capita, Lithuania led with USD 583 per capita, Latvia with USD 523 per capita, Estonia with USD 262 per capita, Romania with USD 174 per capita, and the Netherlands with USD 160 per capita. These countries have been major recipients of technology diffusion through significant import activities from both within and outside the EU.
Countries with Increased Contribution to Technology Creation and Diffusion:
Between 2010 and 2020, the countries with the highest growth rates in intra-EU exports per capita were led by Malta (data not available). Lithuania followed with 630%, Latvia with 304%, the Netherlands with 206%, and Romania with 204%. In terms of extra-EU exports per capita, Lithuania showed the highest growth at 1605%, followed by Latvia with 490%, Hungary with 195%, Romania with 191%, and Ireland with 155%. For intra-EU imports per capita, Lithuania led with a remarkable 584% growth, Latvia with 523%, Estonia with 262%, Romania with 174%, and Croatia with 136%. In extra-EU imports per capita, Lithuania saw the highest growth at 1605%, followed by Latvia with 490%, Romania with 191%, Ireland with 155%, and Hungary with 195%. These figures demonstrate the increasing role these countries have played in both technology creation and diffusion over the last decade.
Trade Balance:
In 2020, the countries with the highest intra-EU trade balance per capita in the motor vehicles, trailers, and semi-trailers sector were led by the Czech Republic with USD 1,592 per capita. Slovakia followed with USD 1,978 per capita, Hungary with USD 830 per capita, Slovenia with USD 563 per capita, and Germany with USD 302 per capita. For extra-EU trade balance per capita, Slovakia again led with USD 2,078 per capita, followed by Germany with USD 947 per capita, the Czech Republic with USD 719 per capita, Sweden with USD 819 per capita, and Hungary with USD 798 per capita. These trade balances indicate a surplus, showing that these countries have been net exporters of motor vehicles, trailers, and semi-trailers both within and outside the EU.
In summary, the Czech Republic, Slovakia, Hungary, and Germany have been standout contributors in the motor vehicles, trailers, and semi-trailers sector, leading in intra-EU and extra-EU exports, imports, and trade balance per capita. These countries played significant roles in both technology creation and diffusion in this sector, showcasing strong export and import activities and maintaining positive trade balances.
Other Transport Equipment
Contributors to Technology Creation in the EU:
In 2020, France led the EU in technology creation for other transport equipment with intra-EU exports per capita of USD 189. Austria followed with USD 136, Germany with USD 114, the Netherlands with USD 102, and Finland with USD 95. For extra-EU exports per capita, France again led with USD 527, followed by the Netherlands with USD 180, Germany with USD 188, Finland with USD 150, and Austria with USD 144. These countries were significant contributors to technology creation through their substantial export activities within and outside the EU.
Beneficiaries of Technology Diffusion:
In 2020, Cyprus had the highest intra-EU imports per capita of other transport equipment at USD 1,016. Ireland followed with USD 333, Lithuania with USD 246, Poland with USD 166, and Hungary with USD 95. For extra-EU imports per capita, Ireland led with USD 904, followed by Malta with USD 210, Poland with USD 96, Latvia with USD 61, and Hungary with USD 60. These countries have been major recipients of technology diffusion through significant import activities from both within and outside the EU.
Countries with Increased Contribution to Technology Creation and Diffusion:
Between 2010 and 2020, the countries with the highest growth rates in intra-EU exports per capita were led by Cyprus (data not available), Greece with 3,462%, Poland with 173%, Finland with 164%, and the Netherlands with 126%. In terms of extra-EU exports per capita, Cyprus also showed the highest growth at 927%, followed by Greece with 366%, Ireland with 314%, Portugal with 470%, and Malta with 588%. For intra-EU imports per capita, Romania saw the highest growth at 869%, followed by Lithuania with 336%, Poland with 246%, Latvia with 166%, and Hungary with 166%. In extra-EU imports per capita, Ireland showed the highest growth at 904%, followed by Lithuania with 210%, Poland with 96%, Latvia with 61%, and Hungary with 60%. These figures demonstrate the increasing role these countries have played in both technology creation and diffusion over the last decade.
Trade Balance:
In 2020, France had the highest intra-EU trade balance per capita for other transport equipment at USD 76, followed by the Netherlands with USD 54, Austria with USD 45, Germany with USD 7, and Romania with USD 5. For extra-EU trade balance per capita, France again led with USD 351, followed by Finland with USD 117, the Netherlands with USD 93, Italy with USD 77, and the EU27 average with USD 70. These trade balances indicate a surplus, showing that these countries have been net exporters of other transport equipment both within and outside the EU.
In summary, France, the Netherlands, Germany, and Austria have been standout contributors in the other transport equipment sector, leading in intra-EU and extra-EU exports, imports, and trade balance per capita. These countries played significant roles in both technology creation and diffusion in this sector, showcasing strong export and import activities and maintaining positive trade balances.
Publishing, Audiovisual, and Broadcasting Activities
Contributors to Technology Creation in the EU:
In 2020, Ireland led the EU in technology creation for publishing, audiovisual, and broadcasting activities with intra-EU exports per capita of USD 1,925. Luxembourg followed with USD 626, the Netherlands with USD 517, Sweden with USD 300, and Belgium with USD 195. For extra-EU exports per capita, Ireland again led with USD 2,800, followed by Luxembourg with USD 500, Cyprus with USD 370, Finland with USD 238, and the EU27 average with USD 214. These countries were significant contributors to technology creation through their substantial export activities within and outside the EU.
Beneficiaries of Technology Diffusion:
In 2020, Luxembourg had the highest intra-EU imports per capita of publishing, audiovisual, and broadcasting activities at USD 2,952. Ireland followed with USD 2,053, the Netherlands with USD 361, Belgium with USD 285, and Malta with USD 264. For extra-EU imports per capita, Luxembourg led with USD 4,361, followed by Ireland with USD 3,465, Cyprus with USD 580, Sweden with USD 418, and the Netherlands with USD 189. These countries have been major recipients of technology diffusion through significant import activities from both within and outside the EU.
Countries with Increased Contribution to Technology Creation and Diffusion:
Between 2010 and 2020, the countries with the highest growth rates in intra-EU exports per capita were led by Cyprus with 510%, the Netherlands with 407%, Ireland with 230%, Poland with 123%, and the Czech Republic with 121%. In terms of extra-EU exports per capita, Cyprus showed the highest growth at 525%, followed by Ireland with 317%, Latvia with 174%, Lithuania with 153%, and Slovakia with 121%. For intra-EU imports per capita, Ireland saw the highest growth at 564%, followed by Cyprus with 313%, Romania with 251%, Lithuania with 174%, and Latvia with 147%. In extra-EU imports per capita, Slovakia showed the highest growth at 256%, followed by Ireland with 137%, Sweden with 119%, Romania with 121%, and Cyprus with 111%. These figures demonstrate the increasing role these countries have played in both technology creation and diffusion over the last decade.
Trade Balance:
In 2020, Luxembourg had the highest intra-EU trade balance per capita for publishing, audiovisual, and broadcasting activities at USD 156, followed by Finland with USD 141, the Netherlands with USD 73, Sweden with USD 72, and Hungary with USD 25. For extra-EU trade balance per capita, Luxembourg led with USD 4,361, followed by Ireland with USD 3,465, Cyprus with USD 580, Sweden with USD 418, and the Netherlands with USD 189. These trade balances indicate a surplus, showing that these countries have been net exporters of publishing, audiovisual, and broadcasting activities both within and outside the EU.
In summary, Ireland, Luxembourg, the Netherlands, and Sweden have been standout contributors in the publishing, audiovisual, and broadcasting activities sector, leading in intra-EU and extra-EU exports, imports, and trade balance per capita. These countries played significant roles in both technology creation and diffusion in this sector, showcasing strong export and import activities and maintaining positive trade balances.
Telecommunications
Contributors to Technology Creation in the EU:
In 2020, Luxembourg led the EU in technology creation for telecommunications with intra-EU exports per capita of USD 1,020. Ireland followed with USD 424, Belgium with USD 164, Sweden with USD 125, and Slovenia with USD 123. For extra-EU exports per capita, Luxembourg again led with USD 2,094, followed by Ireland with USD 330, the Netherlands with USD 115, Sweden with USD 110, and Denmark with USD 56. These countries were significant contributors to technology creation through their substantial export activities within and outside the EU.
Beneficiaries of Technology Diffusion:
In 2020, Luxembourg had the highest intra-EU imports per capita of telecommunications at USD 1,451. Malta followed with USD 164, Belgium with USD 173, Ireland with USD 165, and Estonia with USD 162. For extra-EU imports per capita, Luxembourg led with USD 1,154, followed by Ireland with USD 562, Latvia with USD 110, Romania with USD 110, and Slovakia with USD 95. These countries have been major recipients of technology diffusion through significant import activities from both within and outside the EU.
Countries with Increased Contribution to Technology Creation and Diffusion:
Between 2010 and 2020, the countries with the highest growth rates in intra-EU exports per capita were led by Latvia with 271%, Slovakia with 255%, Ireland with 252%, Poland with 77%, and Romania with 68%. In terms of extra-EU exports per capita, Ireland showed the highest growth at 388%, followed by Latvia with 210%, Germany with 154%, Poland with 92%, and the Netherlands with 59%. For intra-EU imports per capita, Slovakia saw the highest growth at 95%, followed by Poland with 84%, Bulgaria with 76%, Latvia with 61%, and Estonia with 47%. In extra-EU imports per capita, Latvia showed the highest growth at 112%, followed by Romania with 110%, Slovakia with 106%, Bulgaria with 88%, and Poland with 81%. These figures demonstrate the increasing role these countries have played in both technology creation and diffusion over the last decade.
Trade Balance:
In 2020, Ireland had the highest intra-EU trade balance per capita for telecommunications at USD 259, followed by Latvia with USD 45, Slovakia with USD 37, Croatia with USD 30, and Romania with USD 15. For extra-EU trade balance per capita, Luxembourg led with USD 941, followed by Croatia with USD 5, Greece with USD 5, Latvia with USD 3, and Slovakia with USD 2. These trade balances indicate a surplus, showing that these countries have been net exporters of telecommunications both within and outside the EU.
In summary, Luxembourg, Ireland, Belgium, and Sweden have been standout contributors in the telecommunications sector, leading in intra-EU and extra-EU exports, imports, and trade balance per capita. These countries played significant roles in both technology creation and diffusion in this sector, showcasing strong export and import activities and maintaining positive trade balances.
Computer Programming, Consultancy, and Information Services Activities
Contributors to Technology Creation in the EU:
In 2020, Luxembourg led the EU in technology creation for computer programming, consultancy, and information services activities with intra-EU exports per capita of USD 13,994. Ireland followed with USD 13,130, Cyprus with USD 904, Malta with USD 773, and the Netherlands with USD 748. For extra-EU exports per capita, Luxembourg again led with USD 9,000, followed by Ireland with USD 9,000, Cyprus with USD 1,320, Sweden with USD 672, and Finland with USD 644. These countries were significant contributors to technology creation through their substantial export activities within and outside the EU.
Beneficiaries of Technology Diffusion:
In 2020, Luxembourg had the highest intra-EU imports per capita of computer programming, consultancy, and information services activities at USD 12,587. Ireland followed with USD 3,241, Malta with USD 1,902, Finland with USD 967, and Denmark with USD 901. For extra-EU imports per capita, Ireland led with USD 562, followed by Luxembourg with USD 6,148, Lithuania with USD 1,553, Croatia with USD 1,293, and Estonia with USD 608. These countries have been major recipients of technology diffusion through significant import activities from both within and outside the EU.
Countries with Increased Contribution to Technology Creation and Diffusion:
Between 2010 and 2020, the countries with the highest growth rates in intra-EU exports per capita were led by Croatia with 1,746%, Lithuania with 1,553%, Latvia with 634%, Portugal with 508%, and Poland with 387%. In terms of extra-EU exports per capita, Lithuania showed the highest growth at 1,553%, followed by Croatia with 1,293%, Estonia with 476%, Portugal with 443%, and Latvia with 404%. For intra-EU imports per capita, Ireland saw the highest growth at 1,081%, followed by Lithuania with 777%, Latvia with 634%, Estonia with 406%, and Cyprus with 401%. In extra-EU imports per capita, Luxembourg showed the highest growth at 783%, followed by Ireland with 783%, Estonia with 608%, Croatia with 416%, and Latvia with 1,553%. These figures demonstrate the increasing role these countries have played in both technology creation and diffusion over the last decade.
Trade Balance:
In 2020, Luxembourg had the highest intra-EU trade balance per capita for computer programming, consultancy, and information services activities at USD 9,889, followed by Ireland with USD 3,917, Cyprus with USD 1,011, Malta with USD 253, and the Netherlands with USD 748. For extra-EU trade balance per capita, Luxembourg led with USD 941, followed by Ireland with USD 5, Cyprus with USD 1,320, Sweden with USD 672, and Finland with USD 644. These trade balances indicate a surplus, showing that these countries have been net exporters of telecommunications both within and outside the EU.
In summary, Luxembourg, Ireland, Cyprus, and Malta have been standout contributors in the computer programming, consultancy, and information services sector, leading in intra-EU and extra-EU exports, imports, and trade balance per capita. These countries played significant roles in both technology creation and diffusion in this sector, showcasing strong export and import activities and maintaining positive trade balances.
Professional, Scientific, and Technical Activities
Contributors to Technology Creation in the EU:
In 2020, Luxembourg led the EU in professional, scientific, and technical activities with intra-EU exports per capita of USD 10,381. Malta followed with USD 1,820, Belgium with USD 1,575, Ireland with USD 1,412, and the Netherlands with USD 991. For extra-EU exports per capita, Luxembourg again led with USD 10,163, followed by Ireland with USD 2,572, Malta with USD 961, Belgium with USD 1,540, and the Netherlands with USD 1,088. These countries were significant contributors to technology creation through their substantial export activities within and outside the EU.
Beneficiaries of Technology Diffusion:
In 2020, Luxembourg had the highest intra-EU imports per capita of professional, scientific, and technical activities at USD 9,769. Ireland followed with USD 5,077, Malta with USD 3,080, the Netherlands with USD 836, and Finland with USD 803. For extra-EU imports per capita, Luxembourg led with USD 5,692, followed by Belgium with USD 319, Austria with USD 121, Croatia with USD 147, and Denmark with USD 95. These countries have been major recipients of technology diffusion through significant import activities from both within and outside the EU.
Countries with Increased Contribution to Technology Creation and Diffusion:
Between 2010 and 2020, the countries with the highest growth rates in intra-EU exports per capita were led by Luxembourg with 544%, followed by Malta with 353%, Romania with 314%, Lithuania with 293%, and Ireland with 246%. In terms of extra-EU exports per capita, Luxembourg showed the highest growth at 1,123%, followed by Malta with 480%, Romania with 342%, Ireland with 322%, and Lithuania with 319%. For intra-EU imports per capita, Ireland saw the highest growth at 288%, followed by Cyprus with 248%, Lithuania with 224%, Estonia with 201%, and Denmark with 125%. In extra-EU imports per capita, Luxembourg showed the highest growth at 140%, followed by Ireland with 92%, Austria with 121%, Croatia with 147%, and Denmark with 95%. These figures demonstrate the increasing role these countries have played in both technology creation and diffusion over the last decade.
Trade Balance:
In 2020, Luxembourg had the highest intra-EU trade balance per capita for professional, scientific, and technical activities at USD 612, followed by Belgium with USD 253, Croatia with USD 71, and the Netherlands with USD 155. For extra-EU trade balance per capita, Luxembourg led with USD 5,692, followed by Belgium with USD 319, Austria with USD 121, Croatia with USD 147, and Denmark with USD 95. These trade balances indicate a surplus, showing that these countries have been net exporters of professional, scientific, and technical activities both within and outside the EU.
In summary, Luxembourg, Ireland, Malta, Belgium, and the Netherlands have been standout contributors in the professional, scientific, and technical activities sector, leading in intra-EU and extra-EU exports, imports, and trade balance per capita. These countries played significant roles in both technology creation and diffusion in this sector, showcasing strong export and import activities and maintaining positive trade balances.
[1] Source: OECD TiVA, World Bank and author’s calculations.
Annex III: Trade in Knowledge- and Technology-Intensive Products
Table 6: EU trade in chemicals and chemical products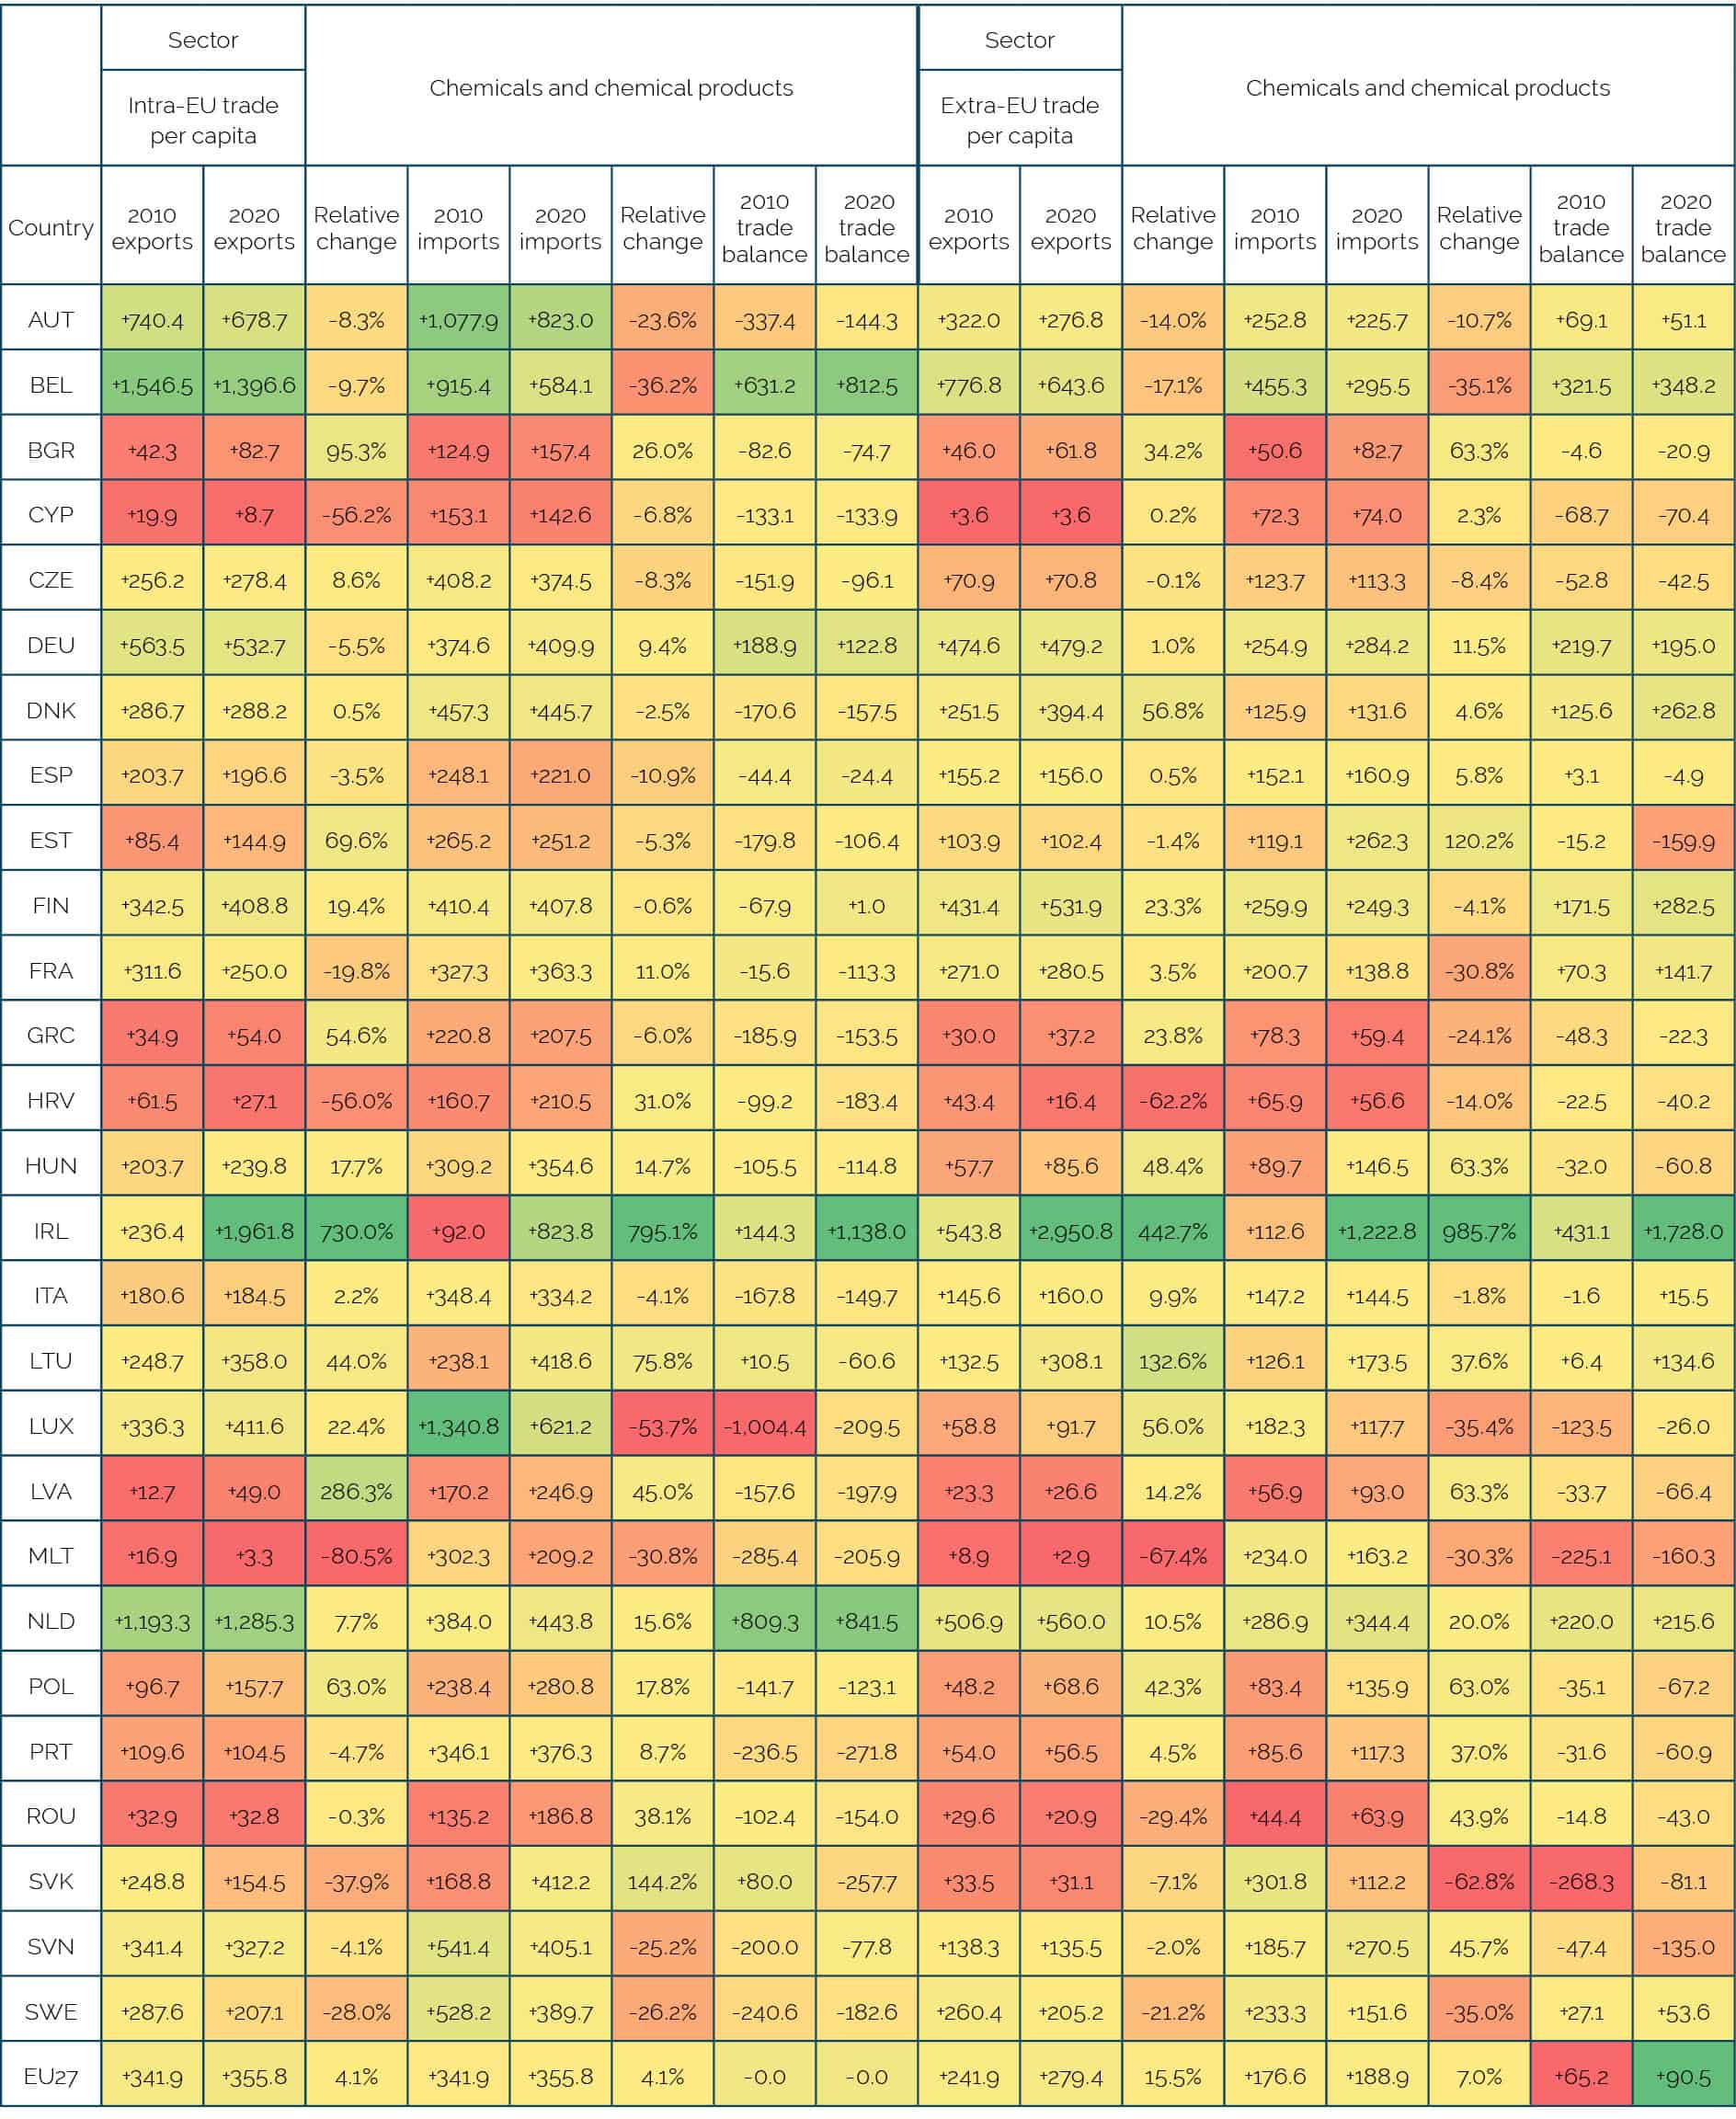 Source: Authors’ calculations based on OECD-TiVa.
Table 7: EU trade in pharmaceuticals, medicinal, chemical and botanical products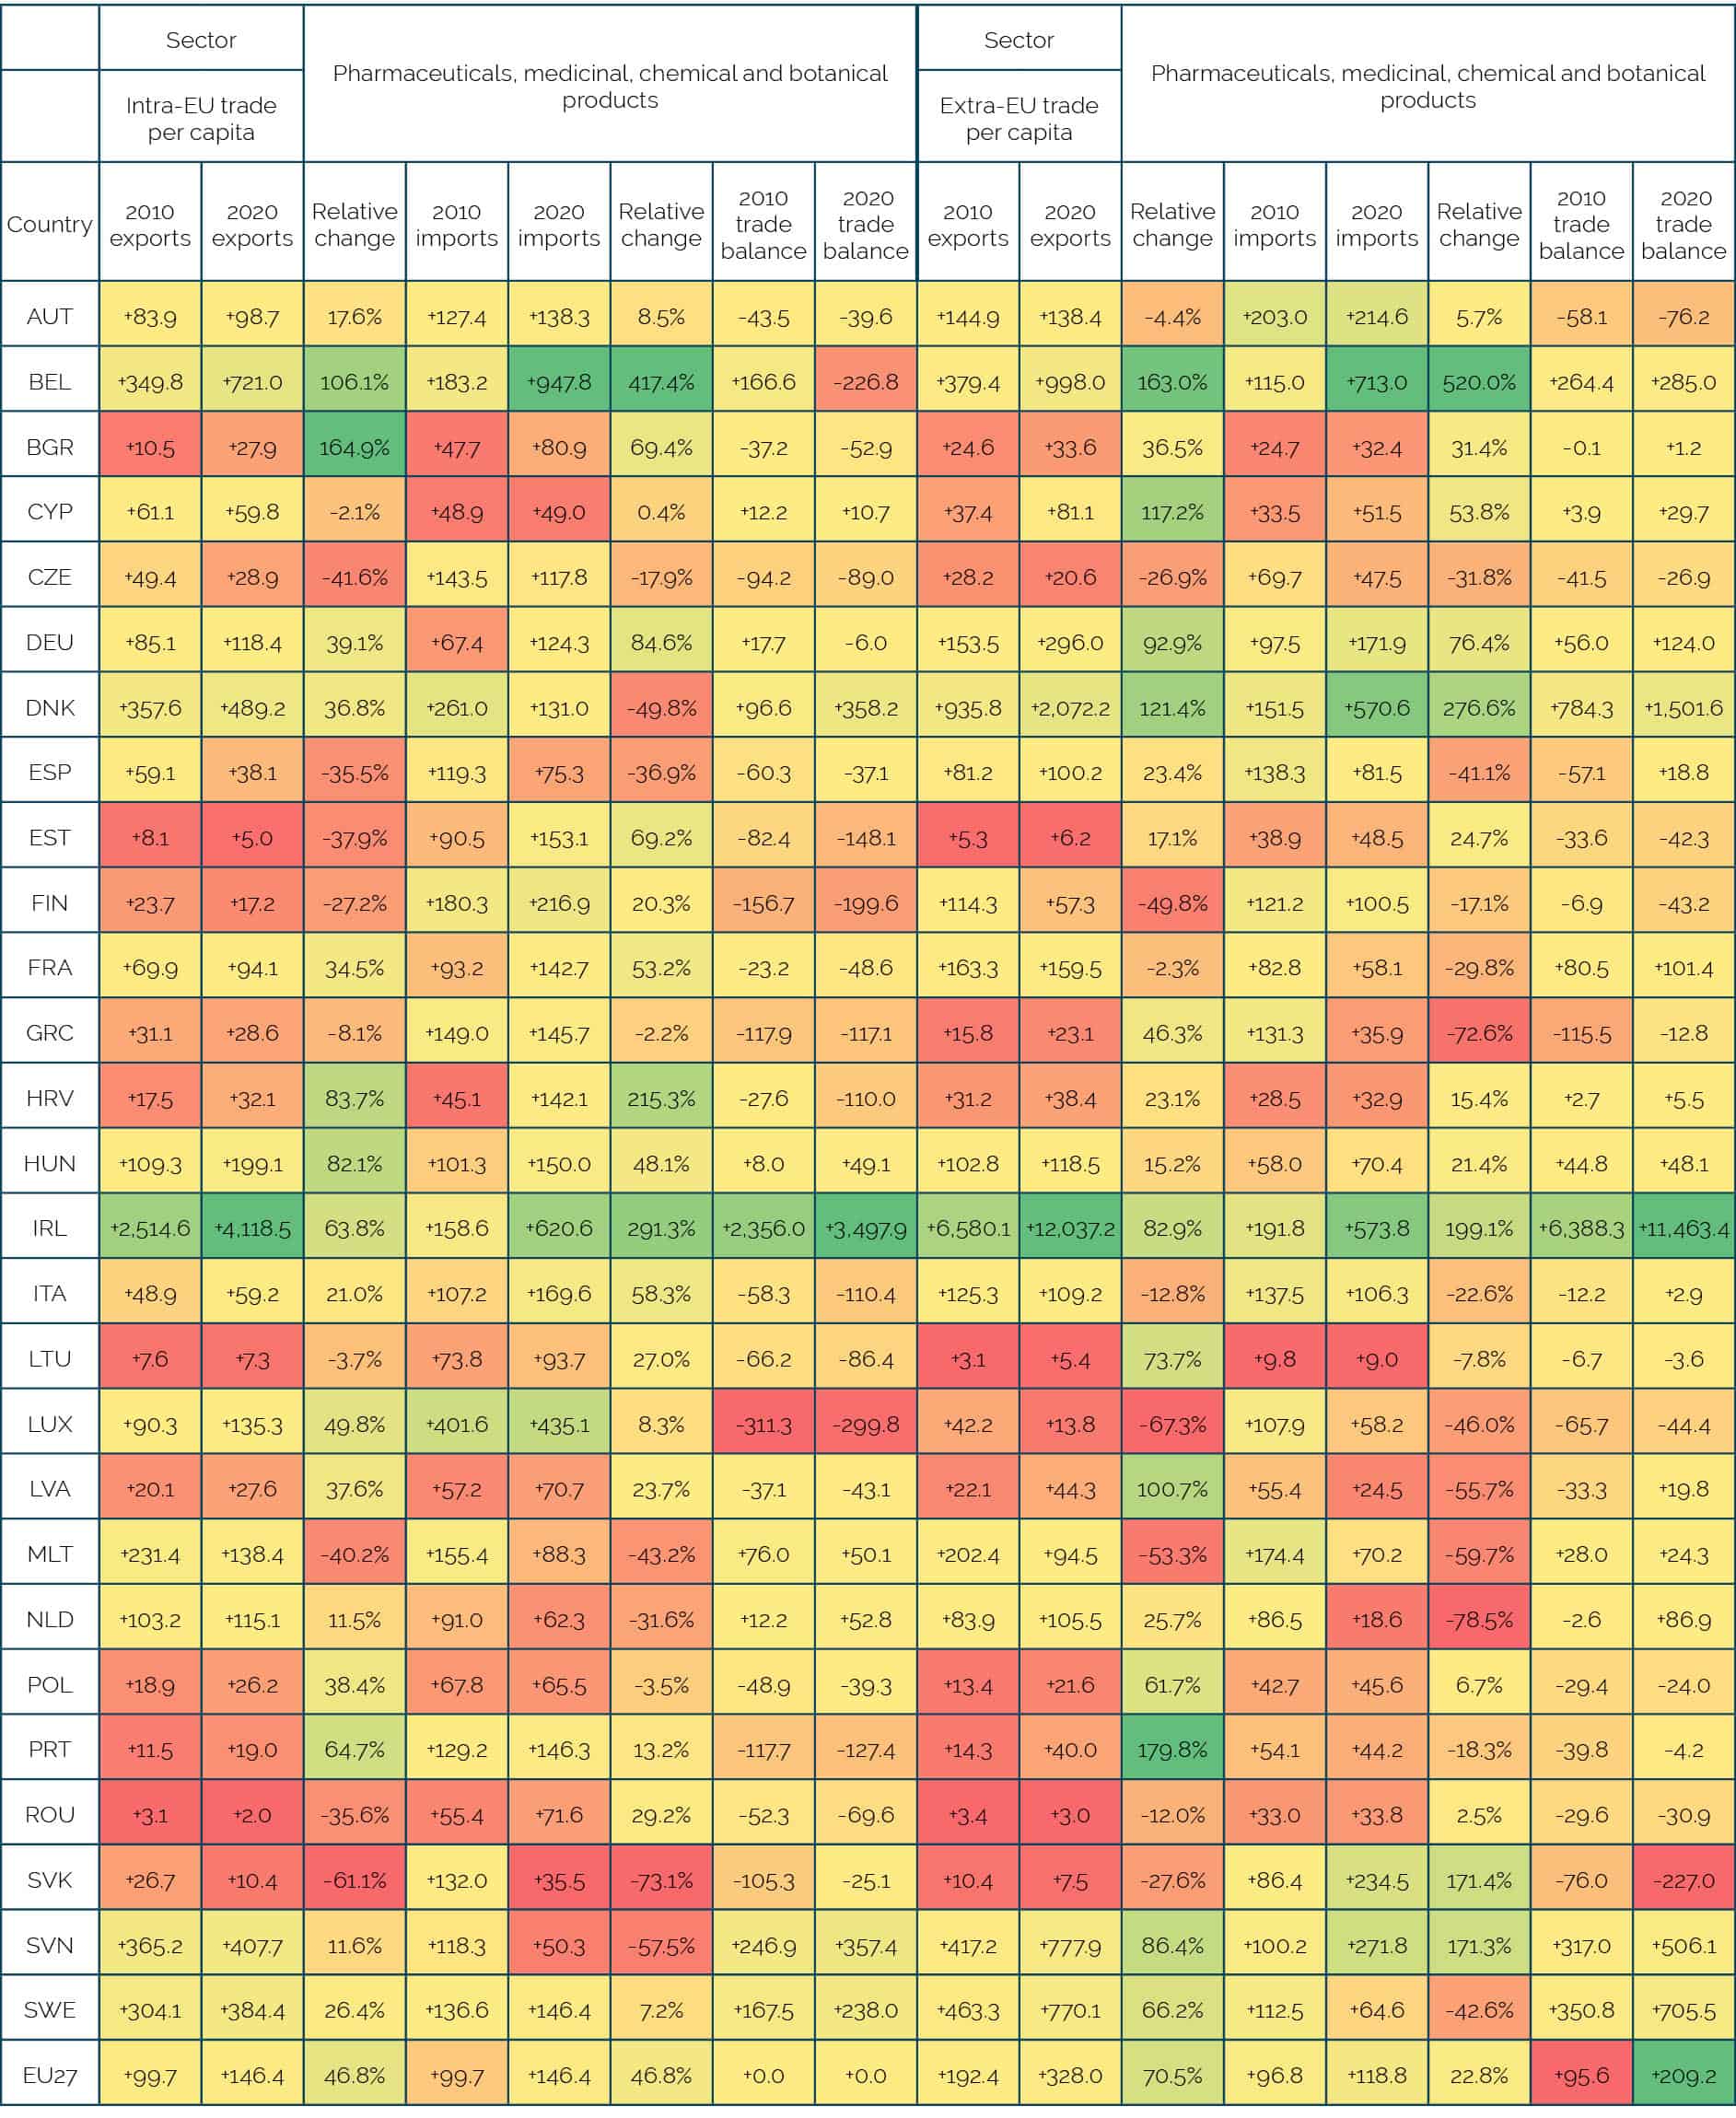 Source: Authors’ calculations based on OECD-TiVa.
Table 8: EU trade in computer, electronic and optical products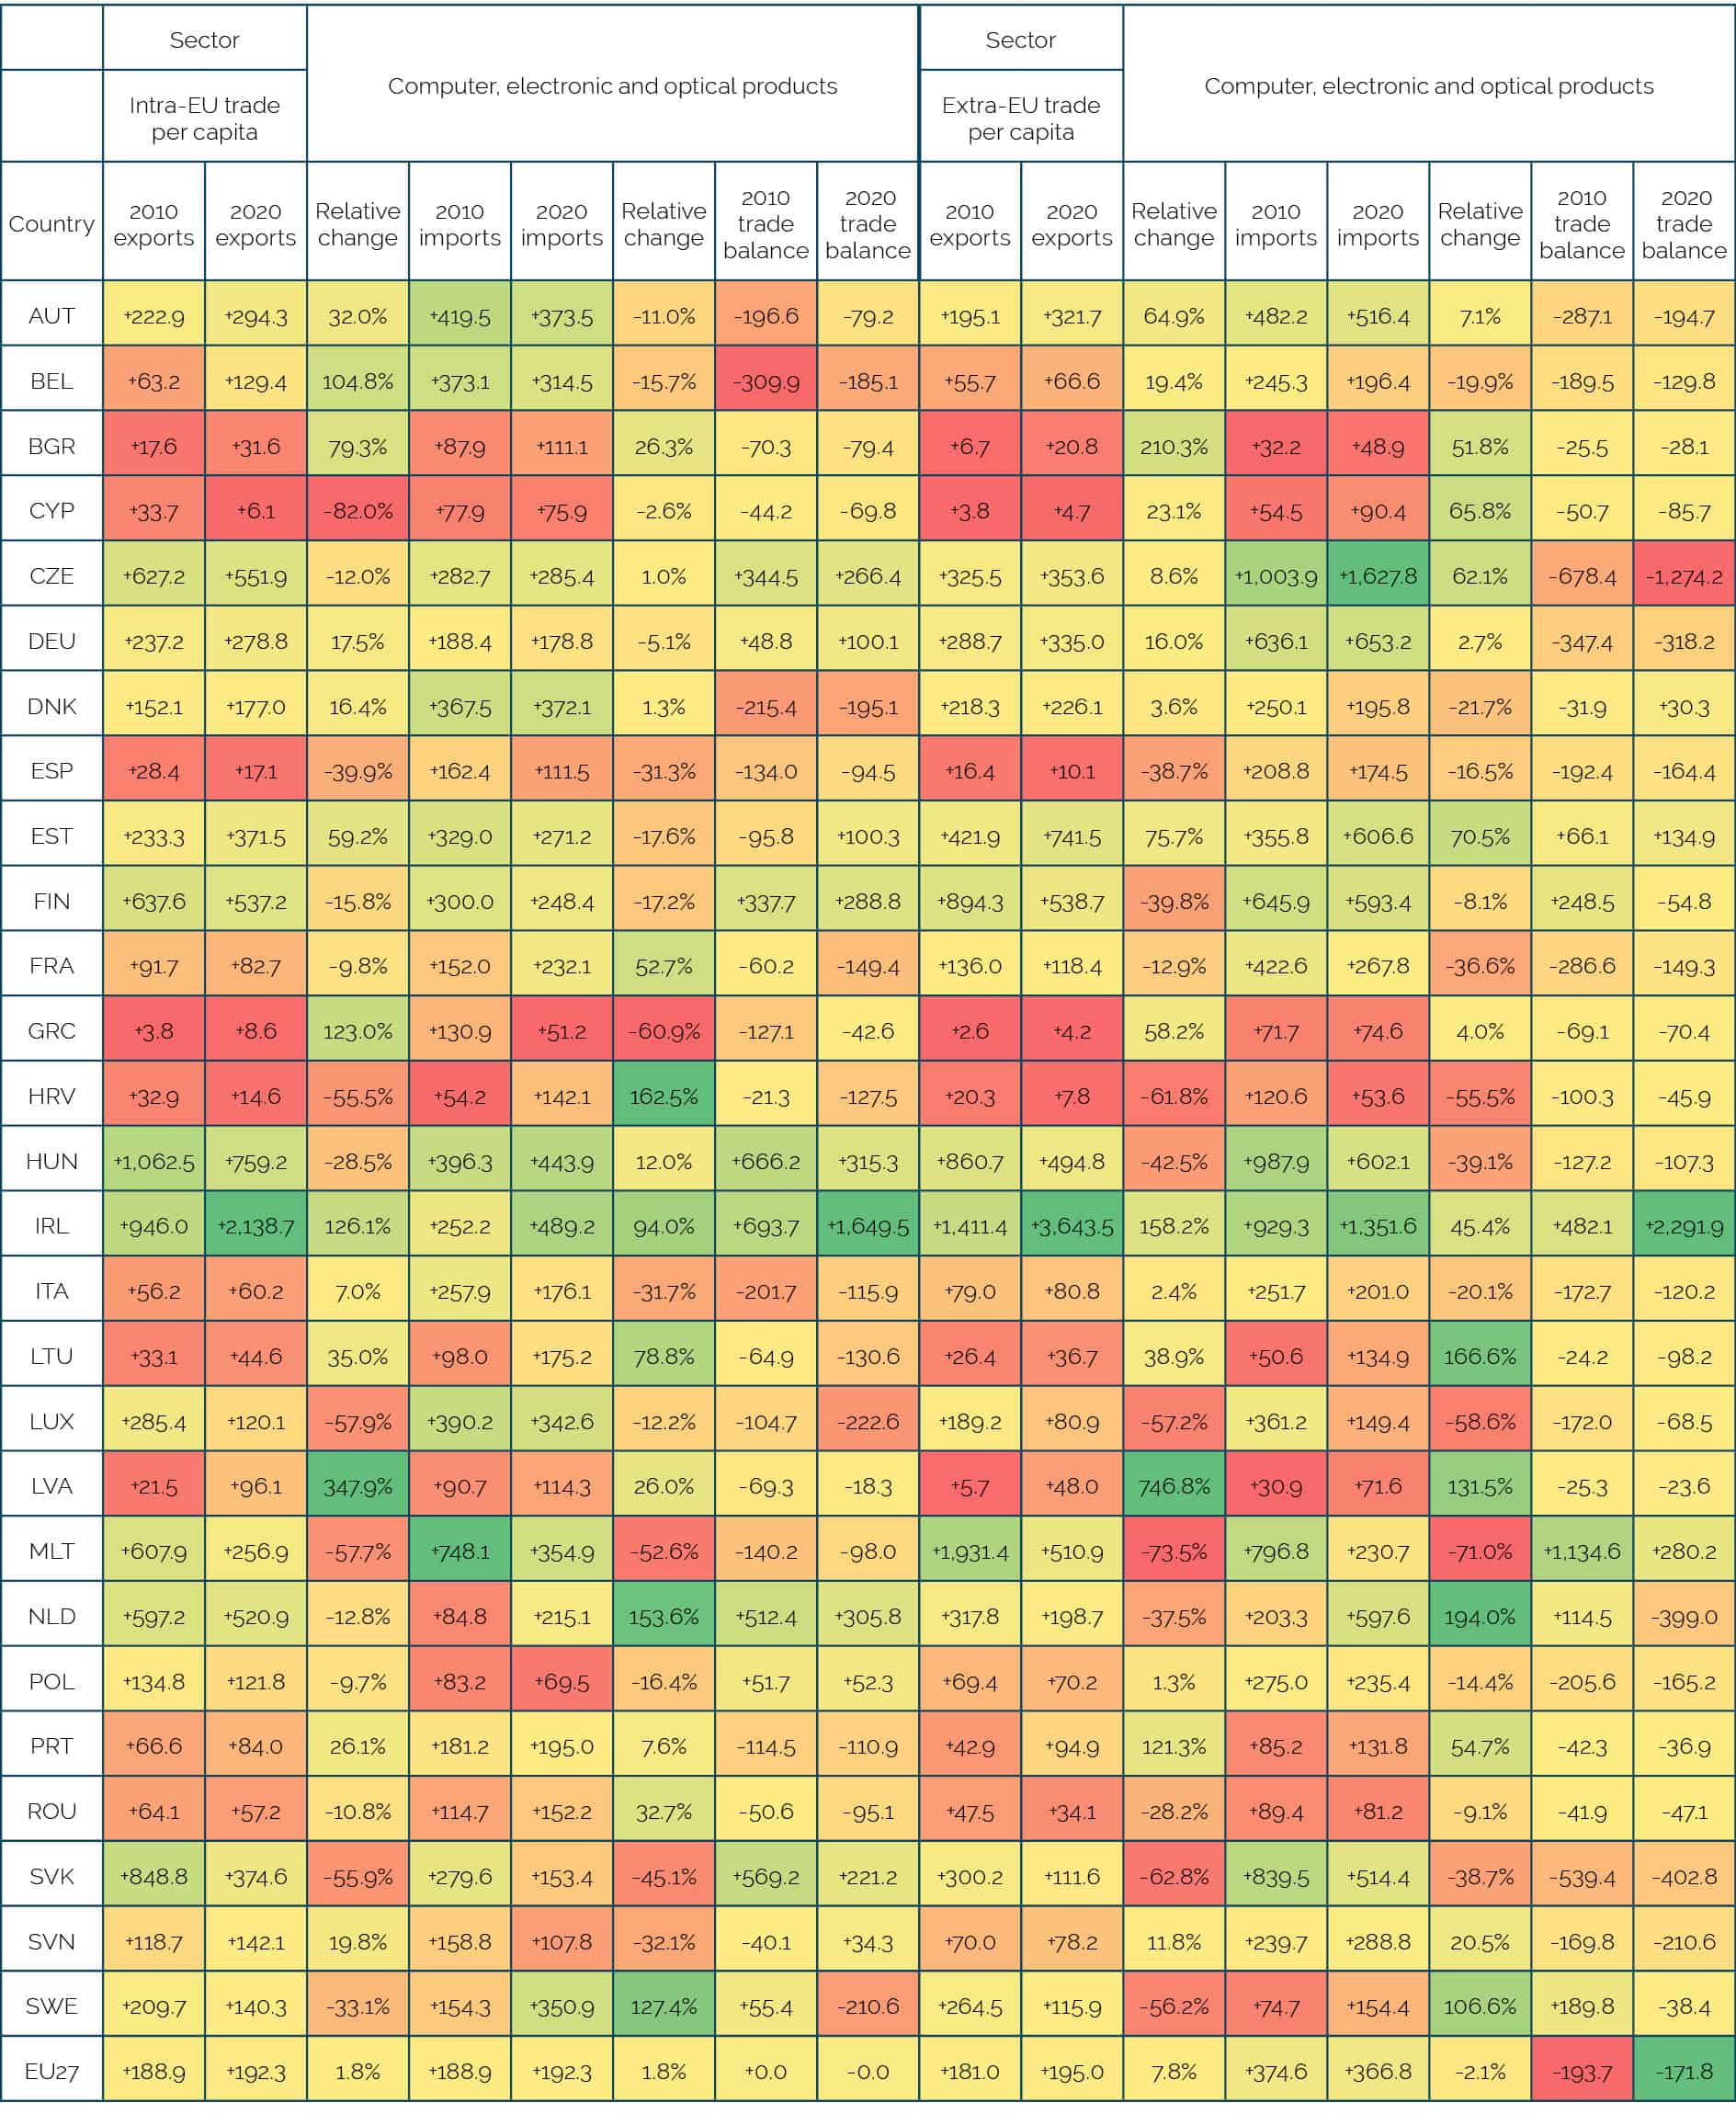 Source: Authors’ calculations based on OECD-TiVa.
Table 9: EU trade in electrical equipment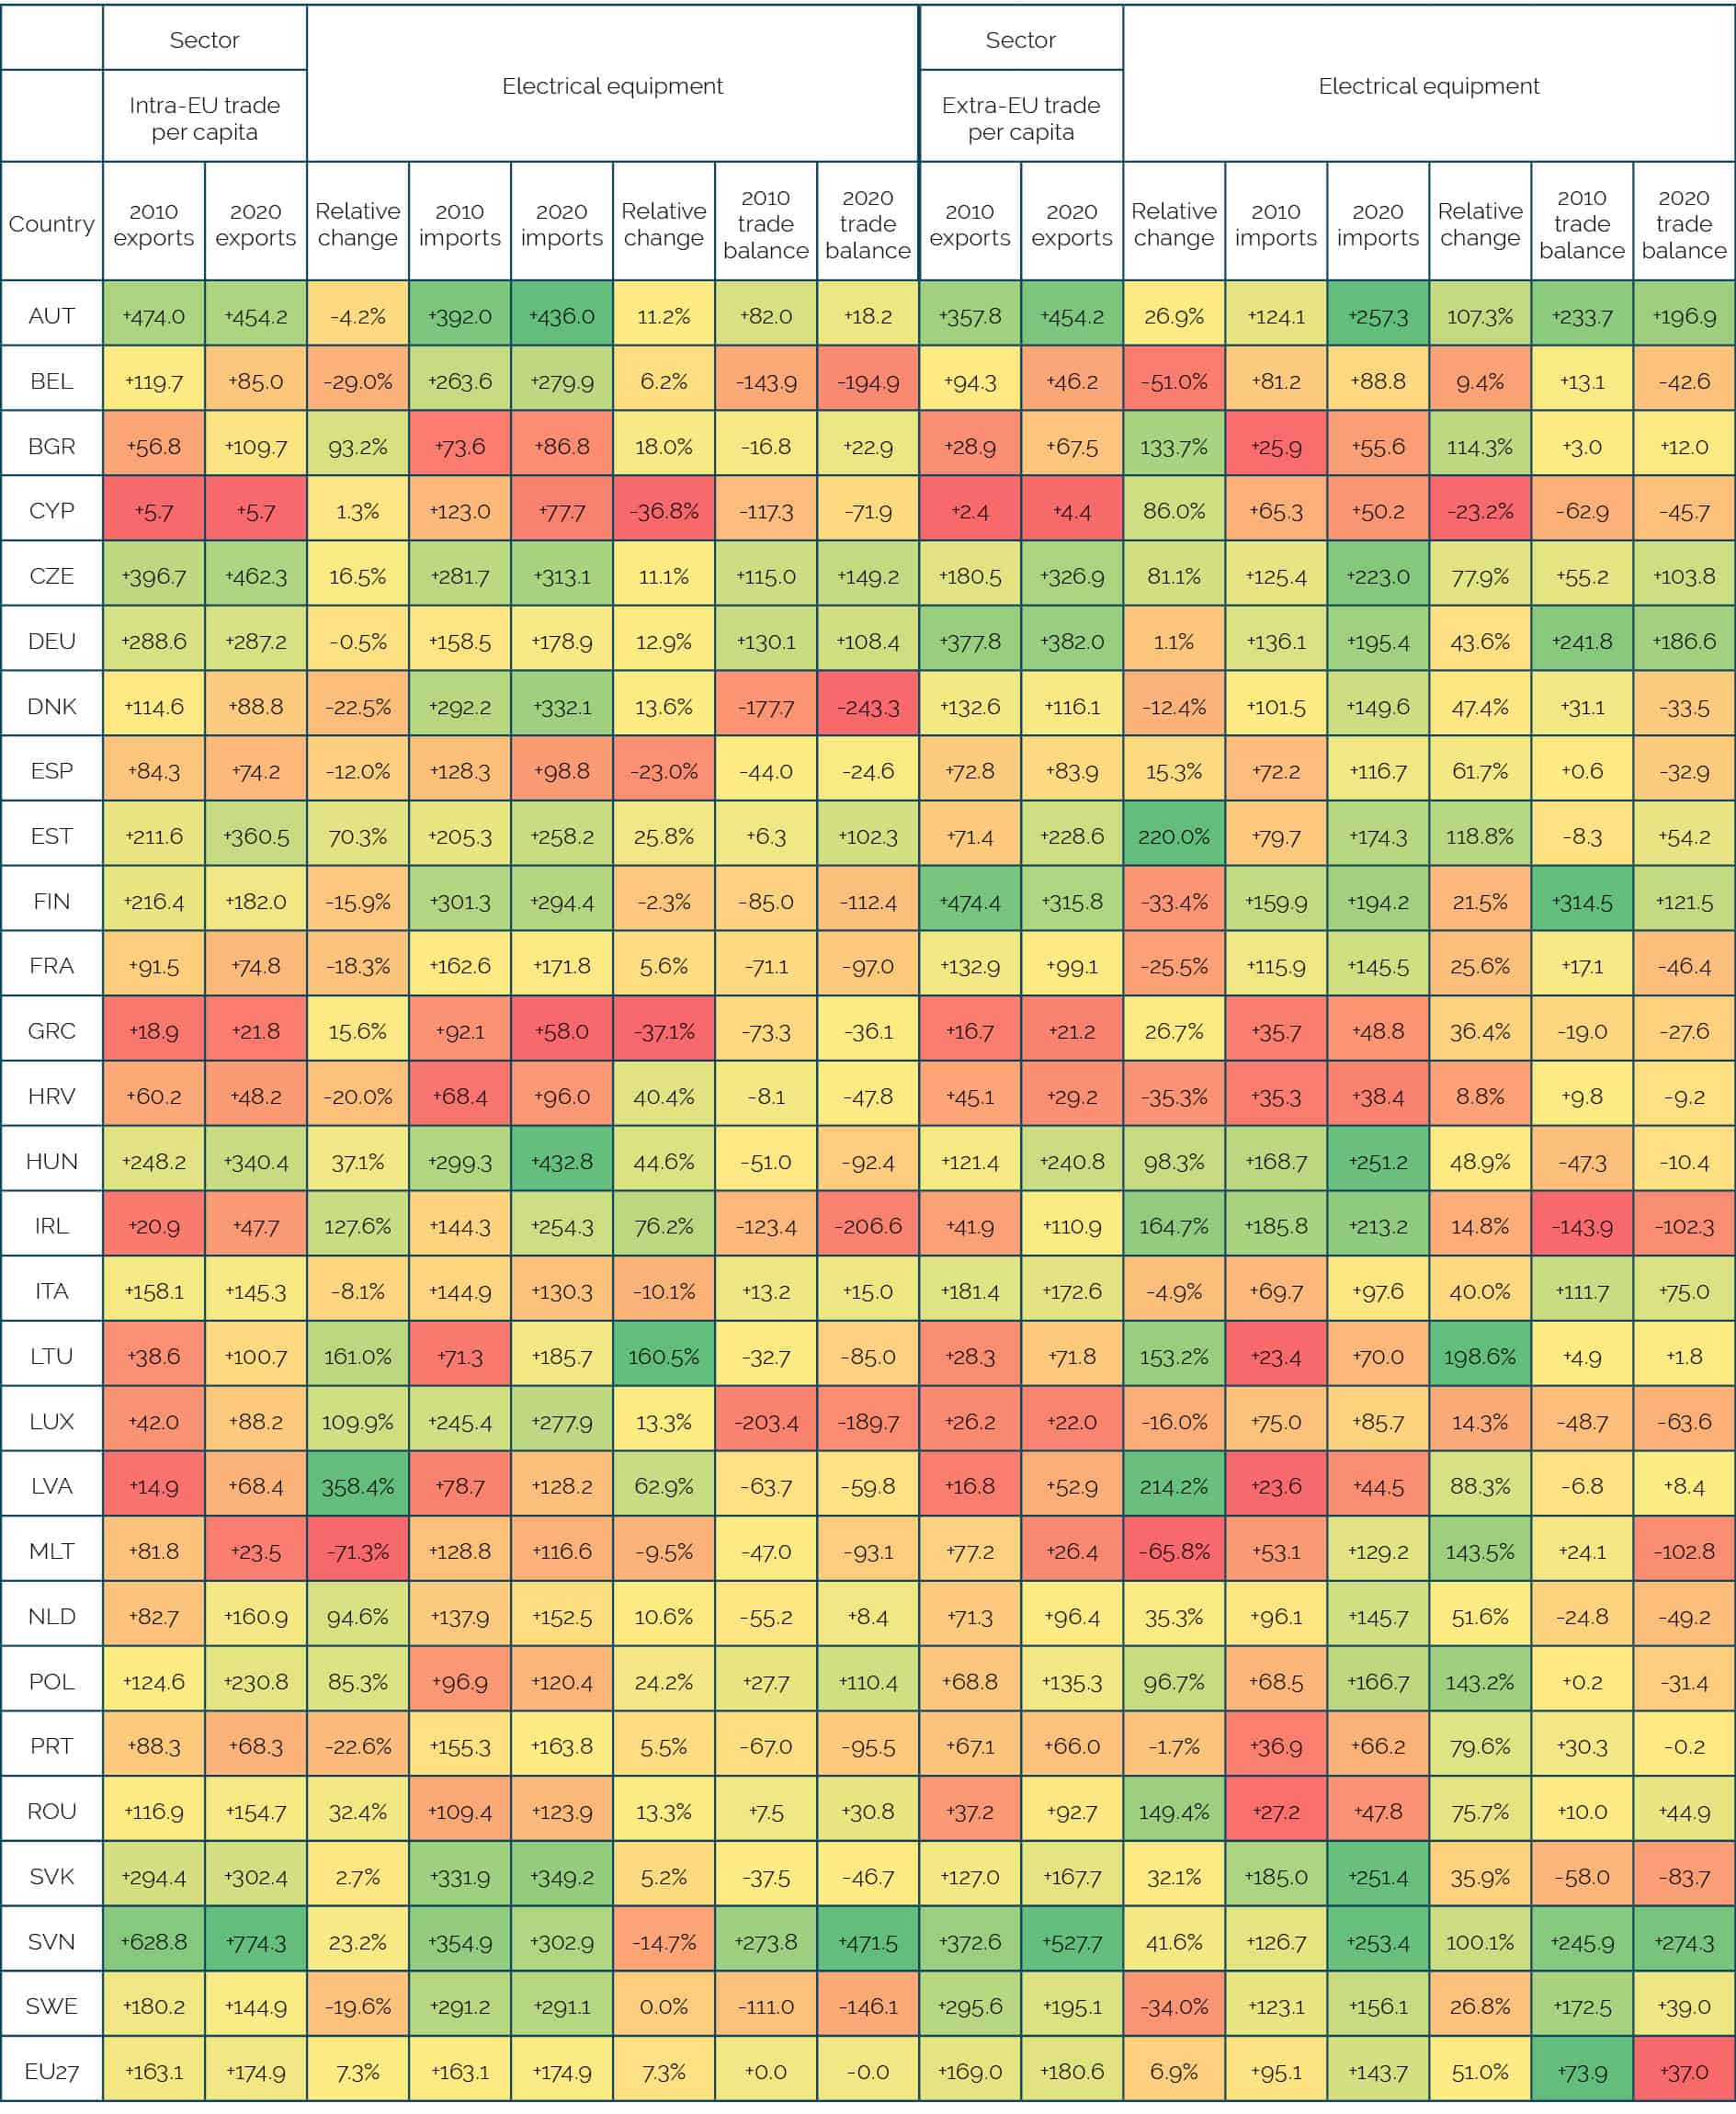 Source: Authors’ calculations based on OECD-TiVa.
Table 10: EU trade in electrical equipment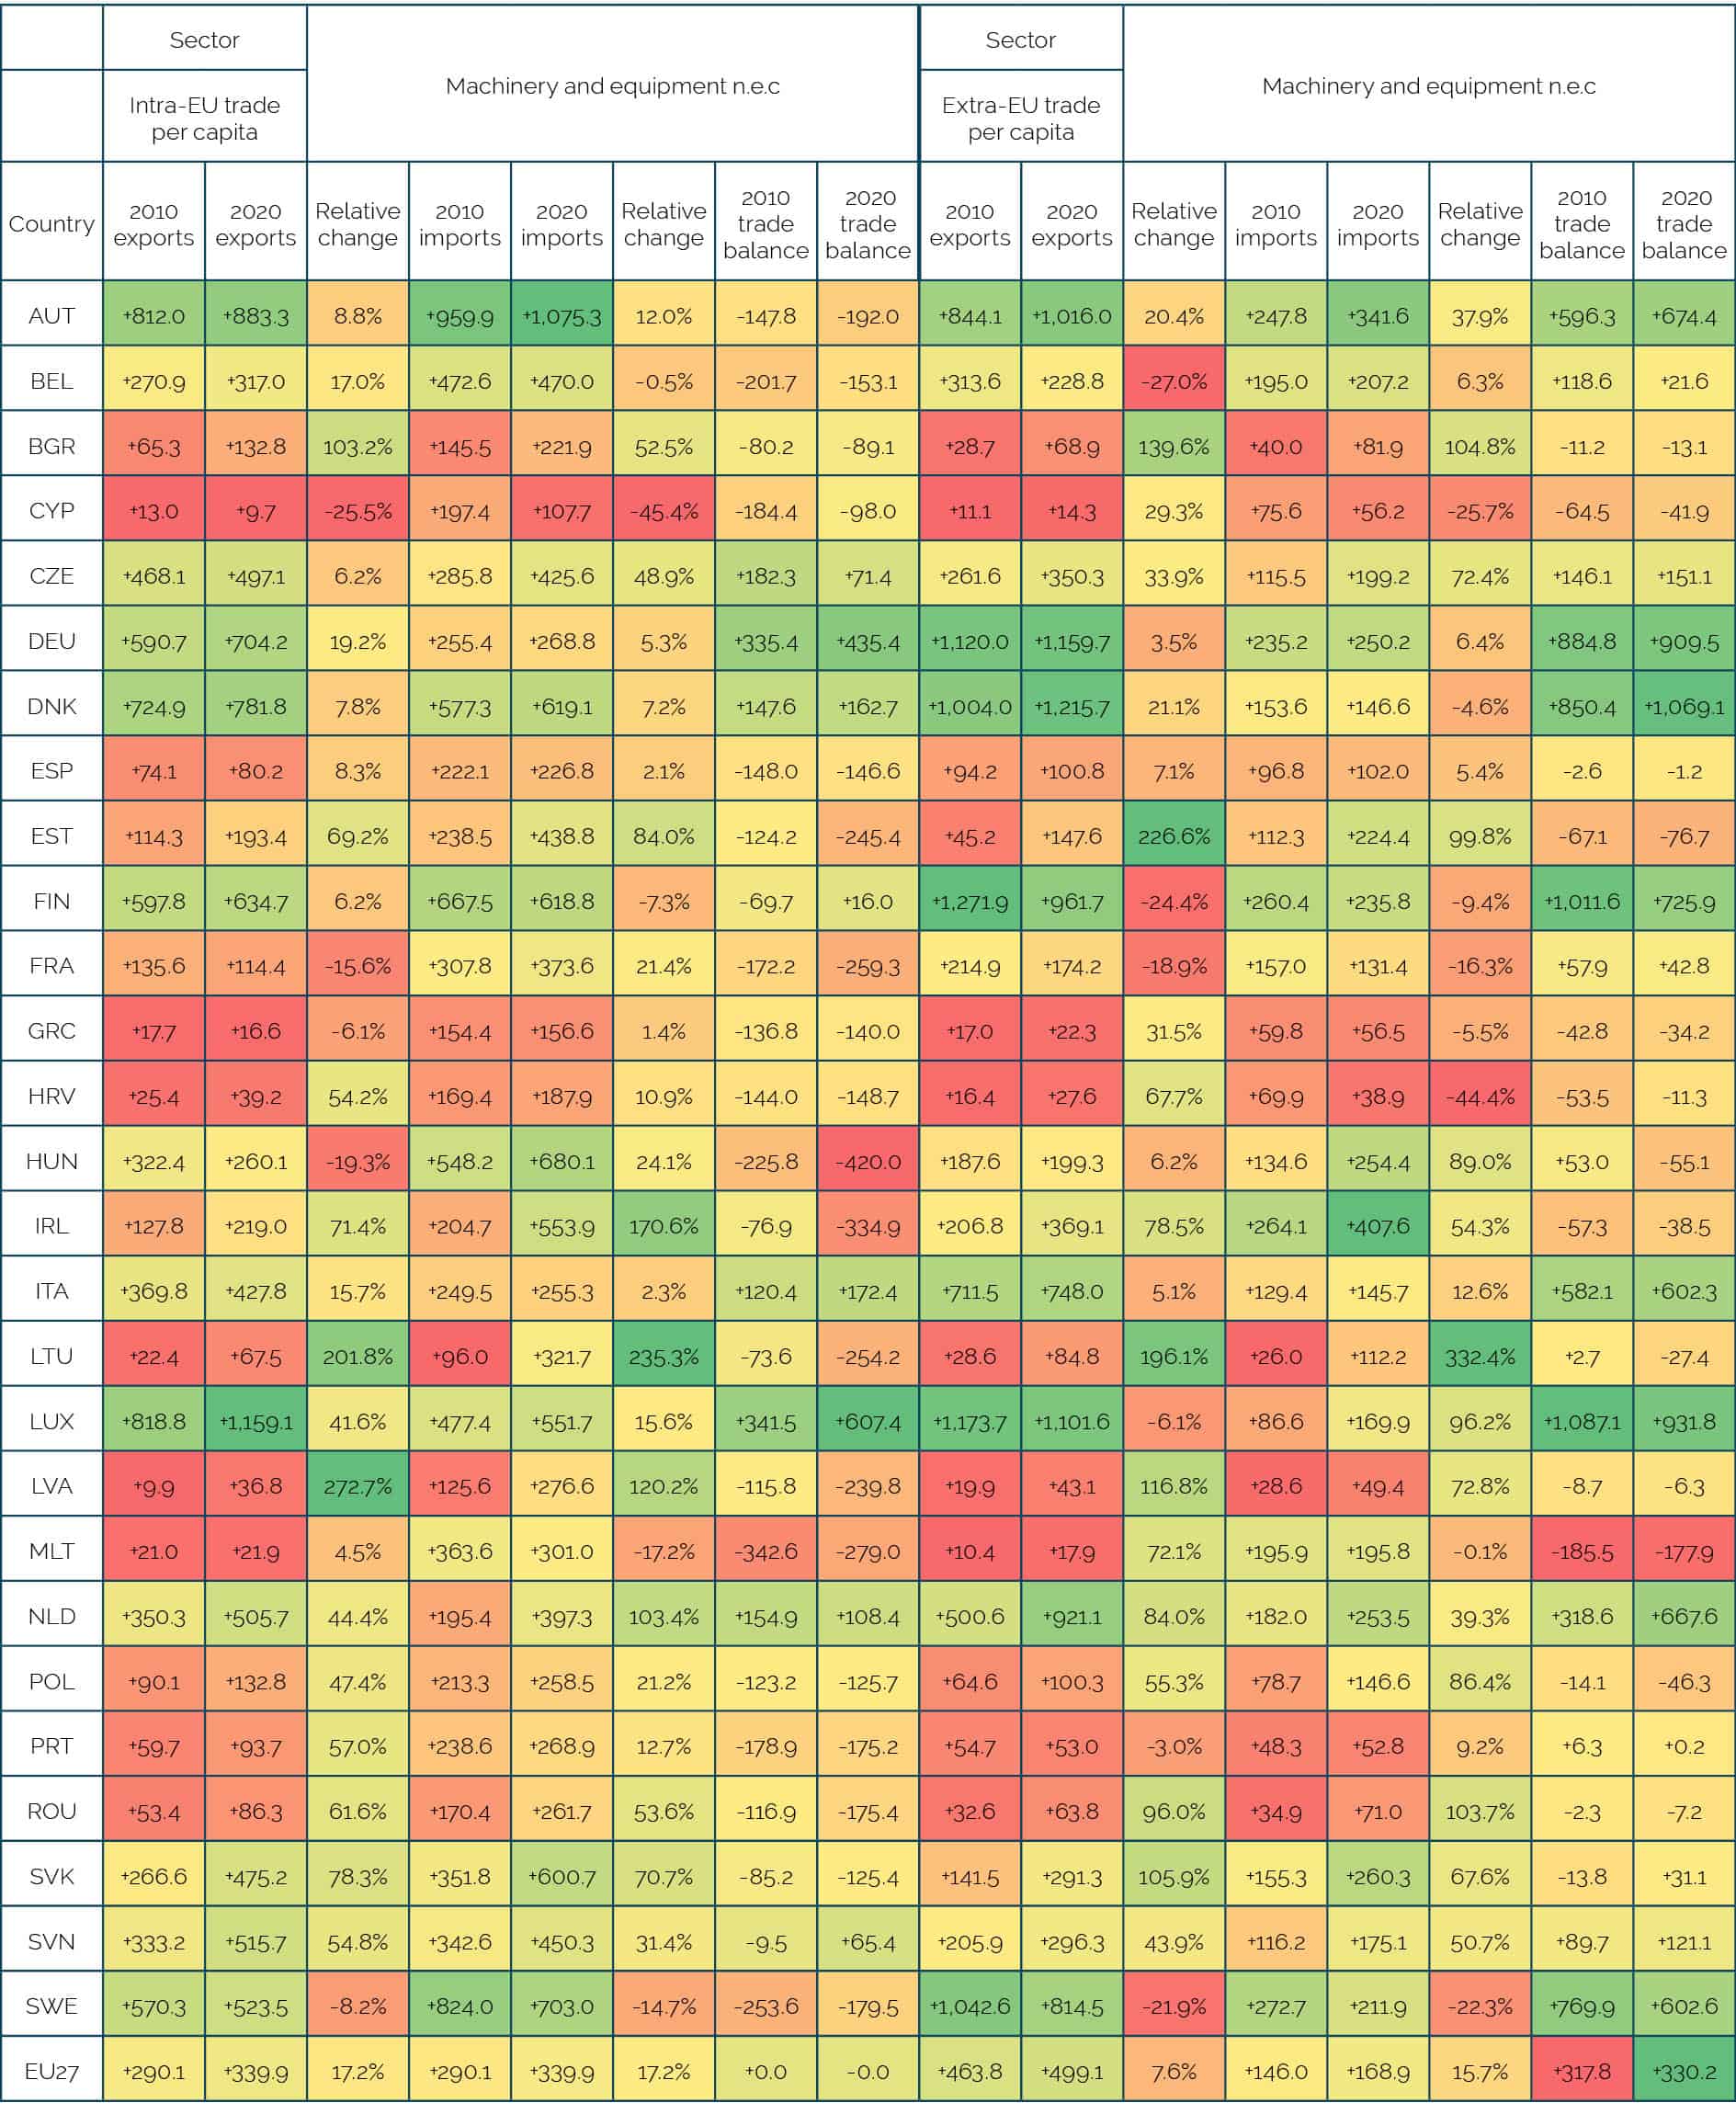 Source: Authors’ calculations based on OECD-TiVa.
Table 11: EU trade in motor vehicles, trailers and semi-trailers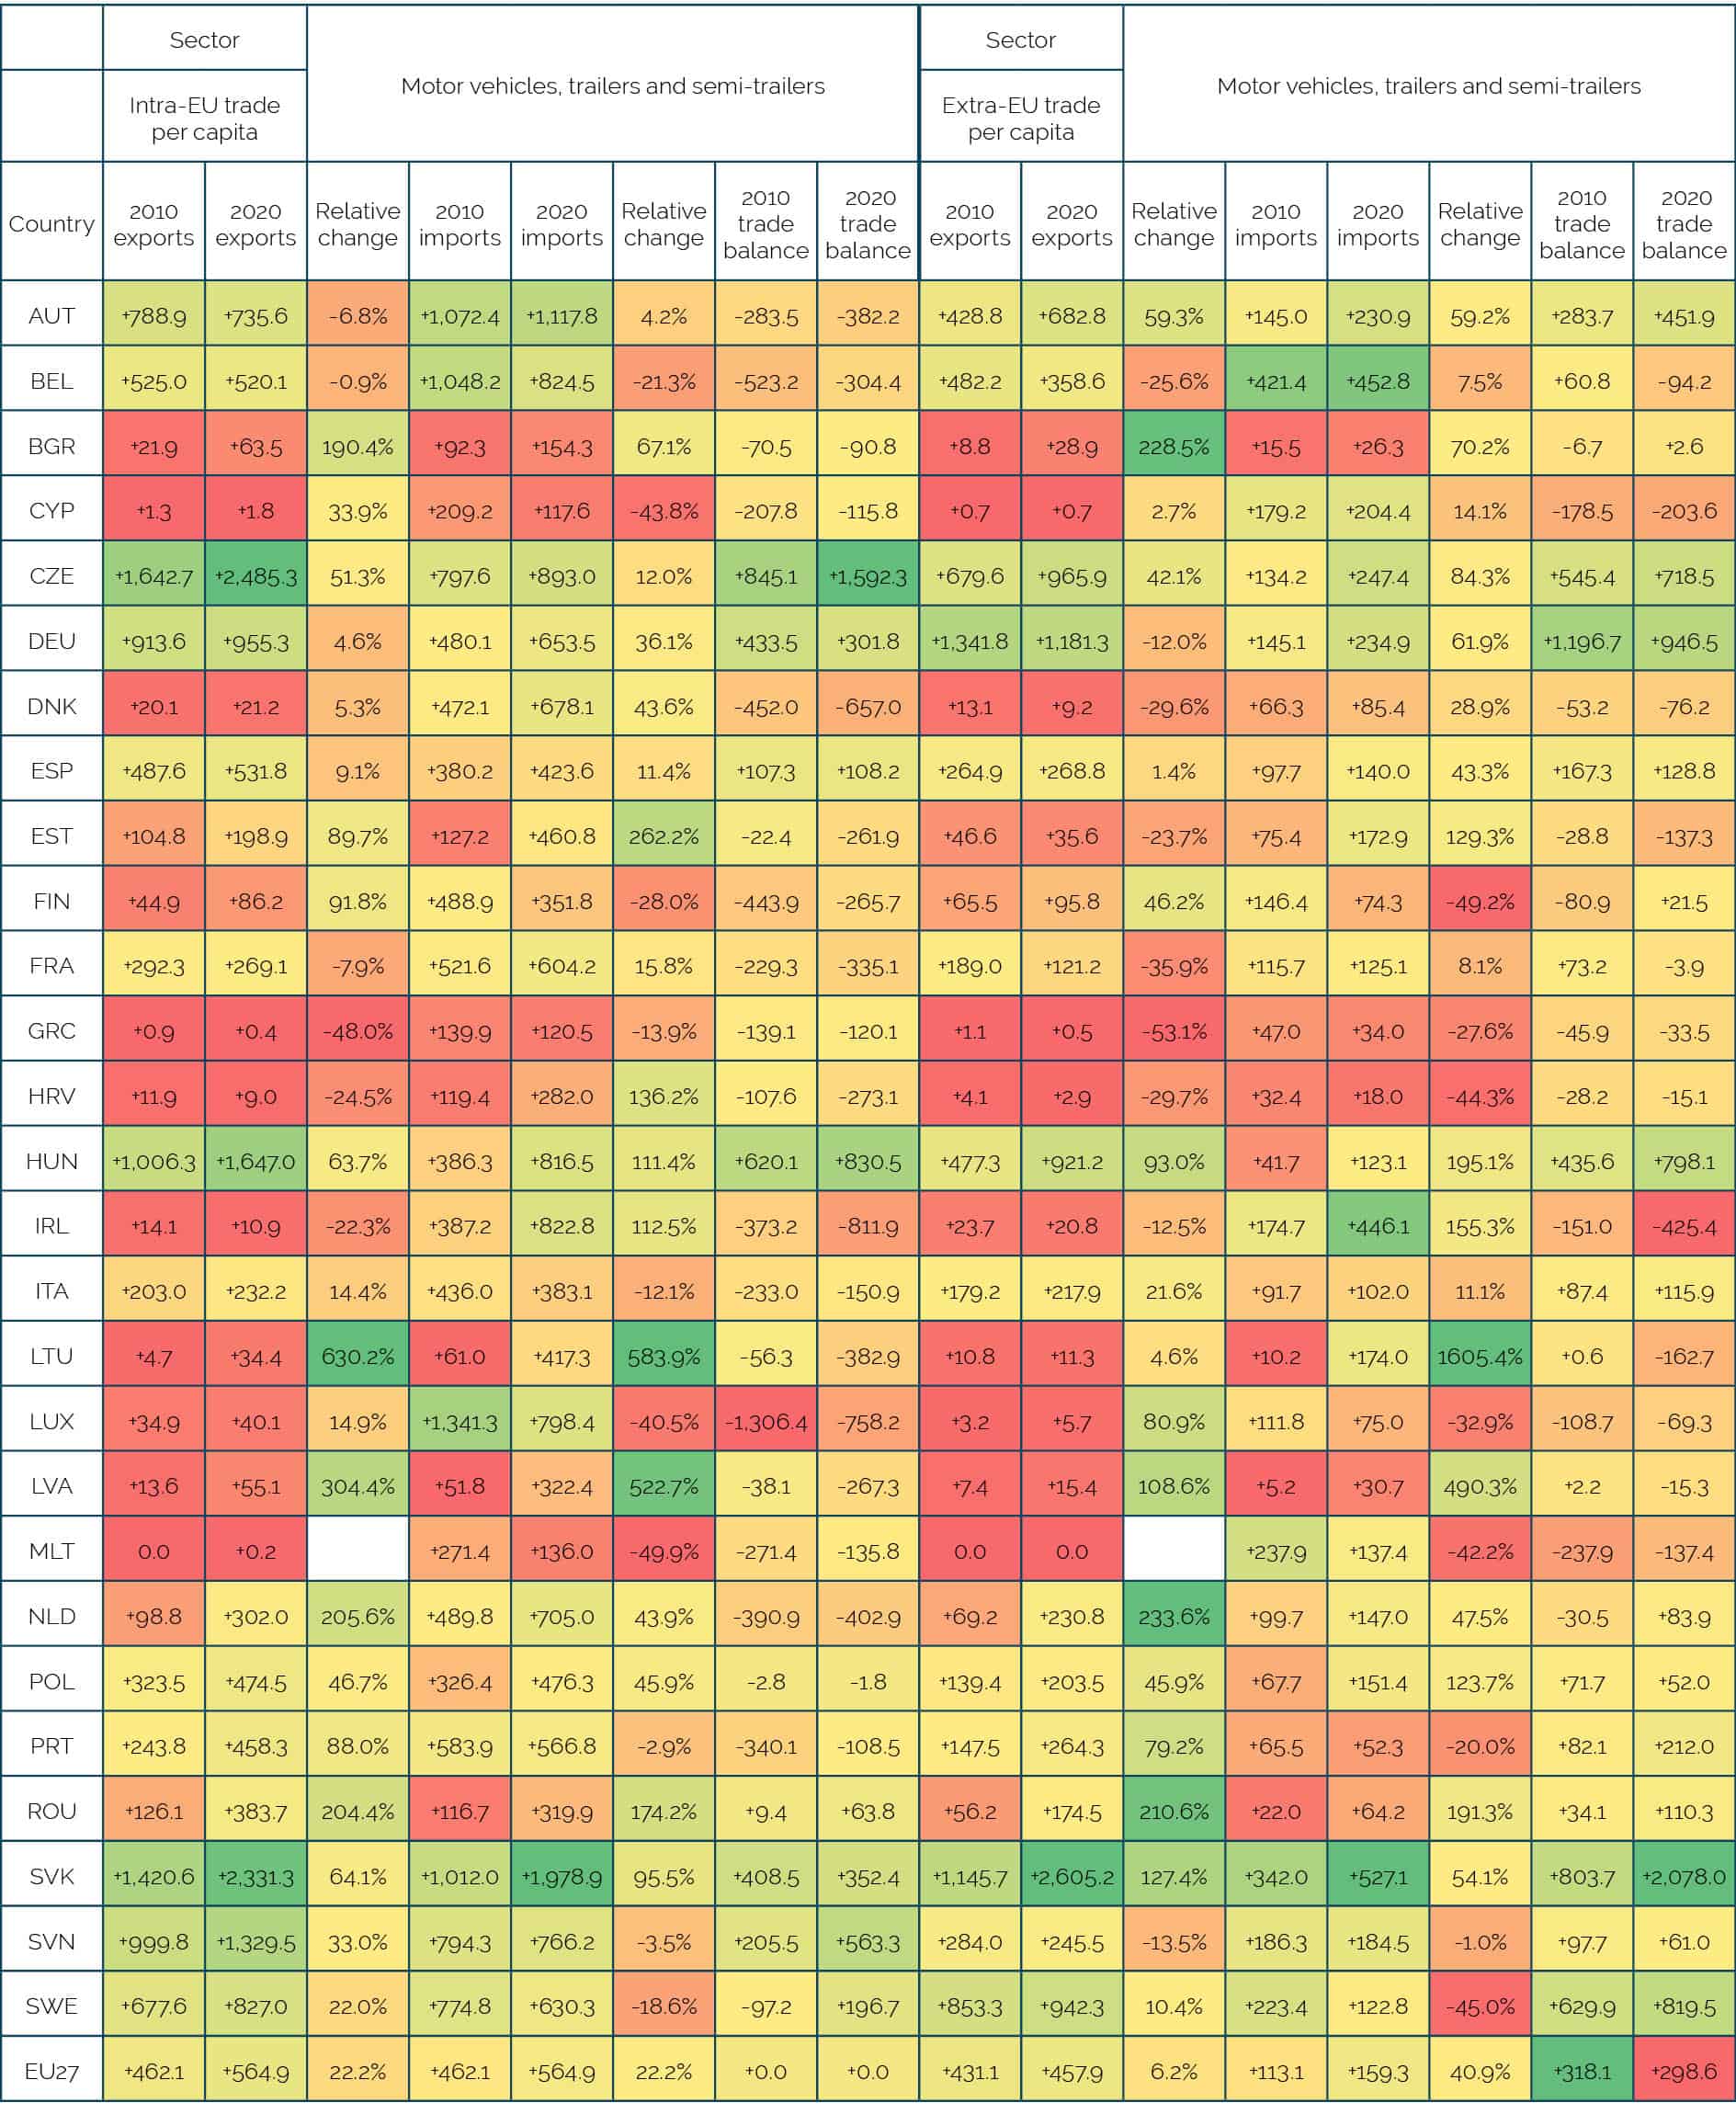 Source: Authors’ calculations based on OECD-TiVa.
Table 12: EU trade in other transport equipment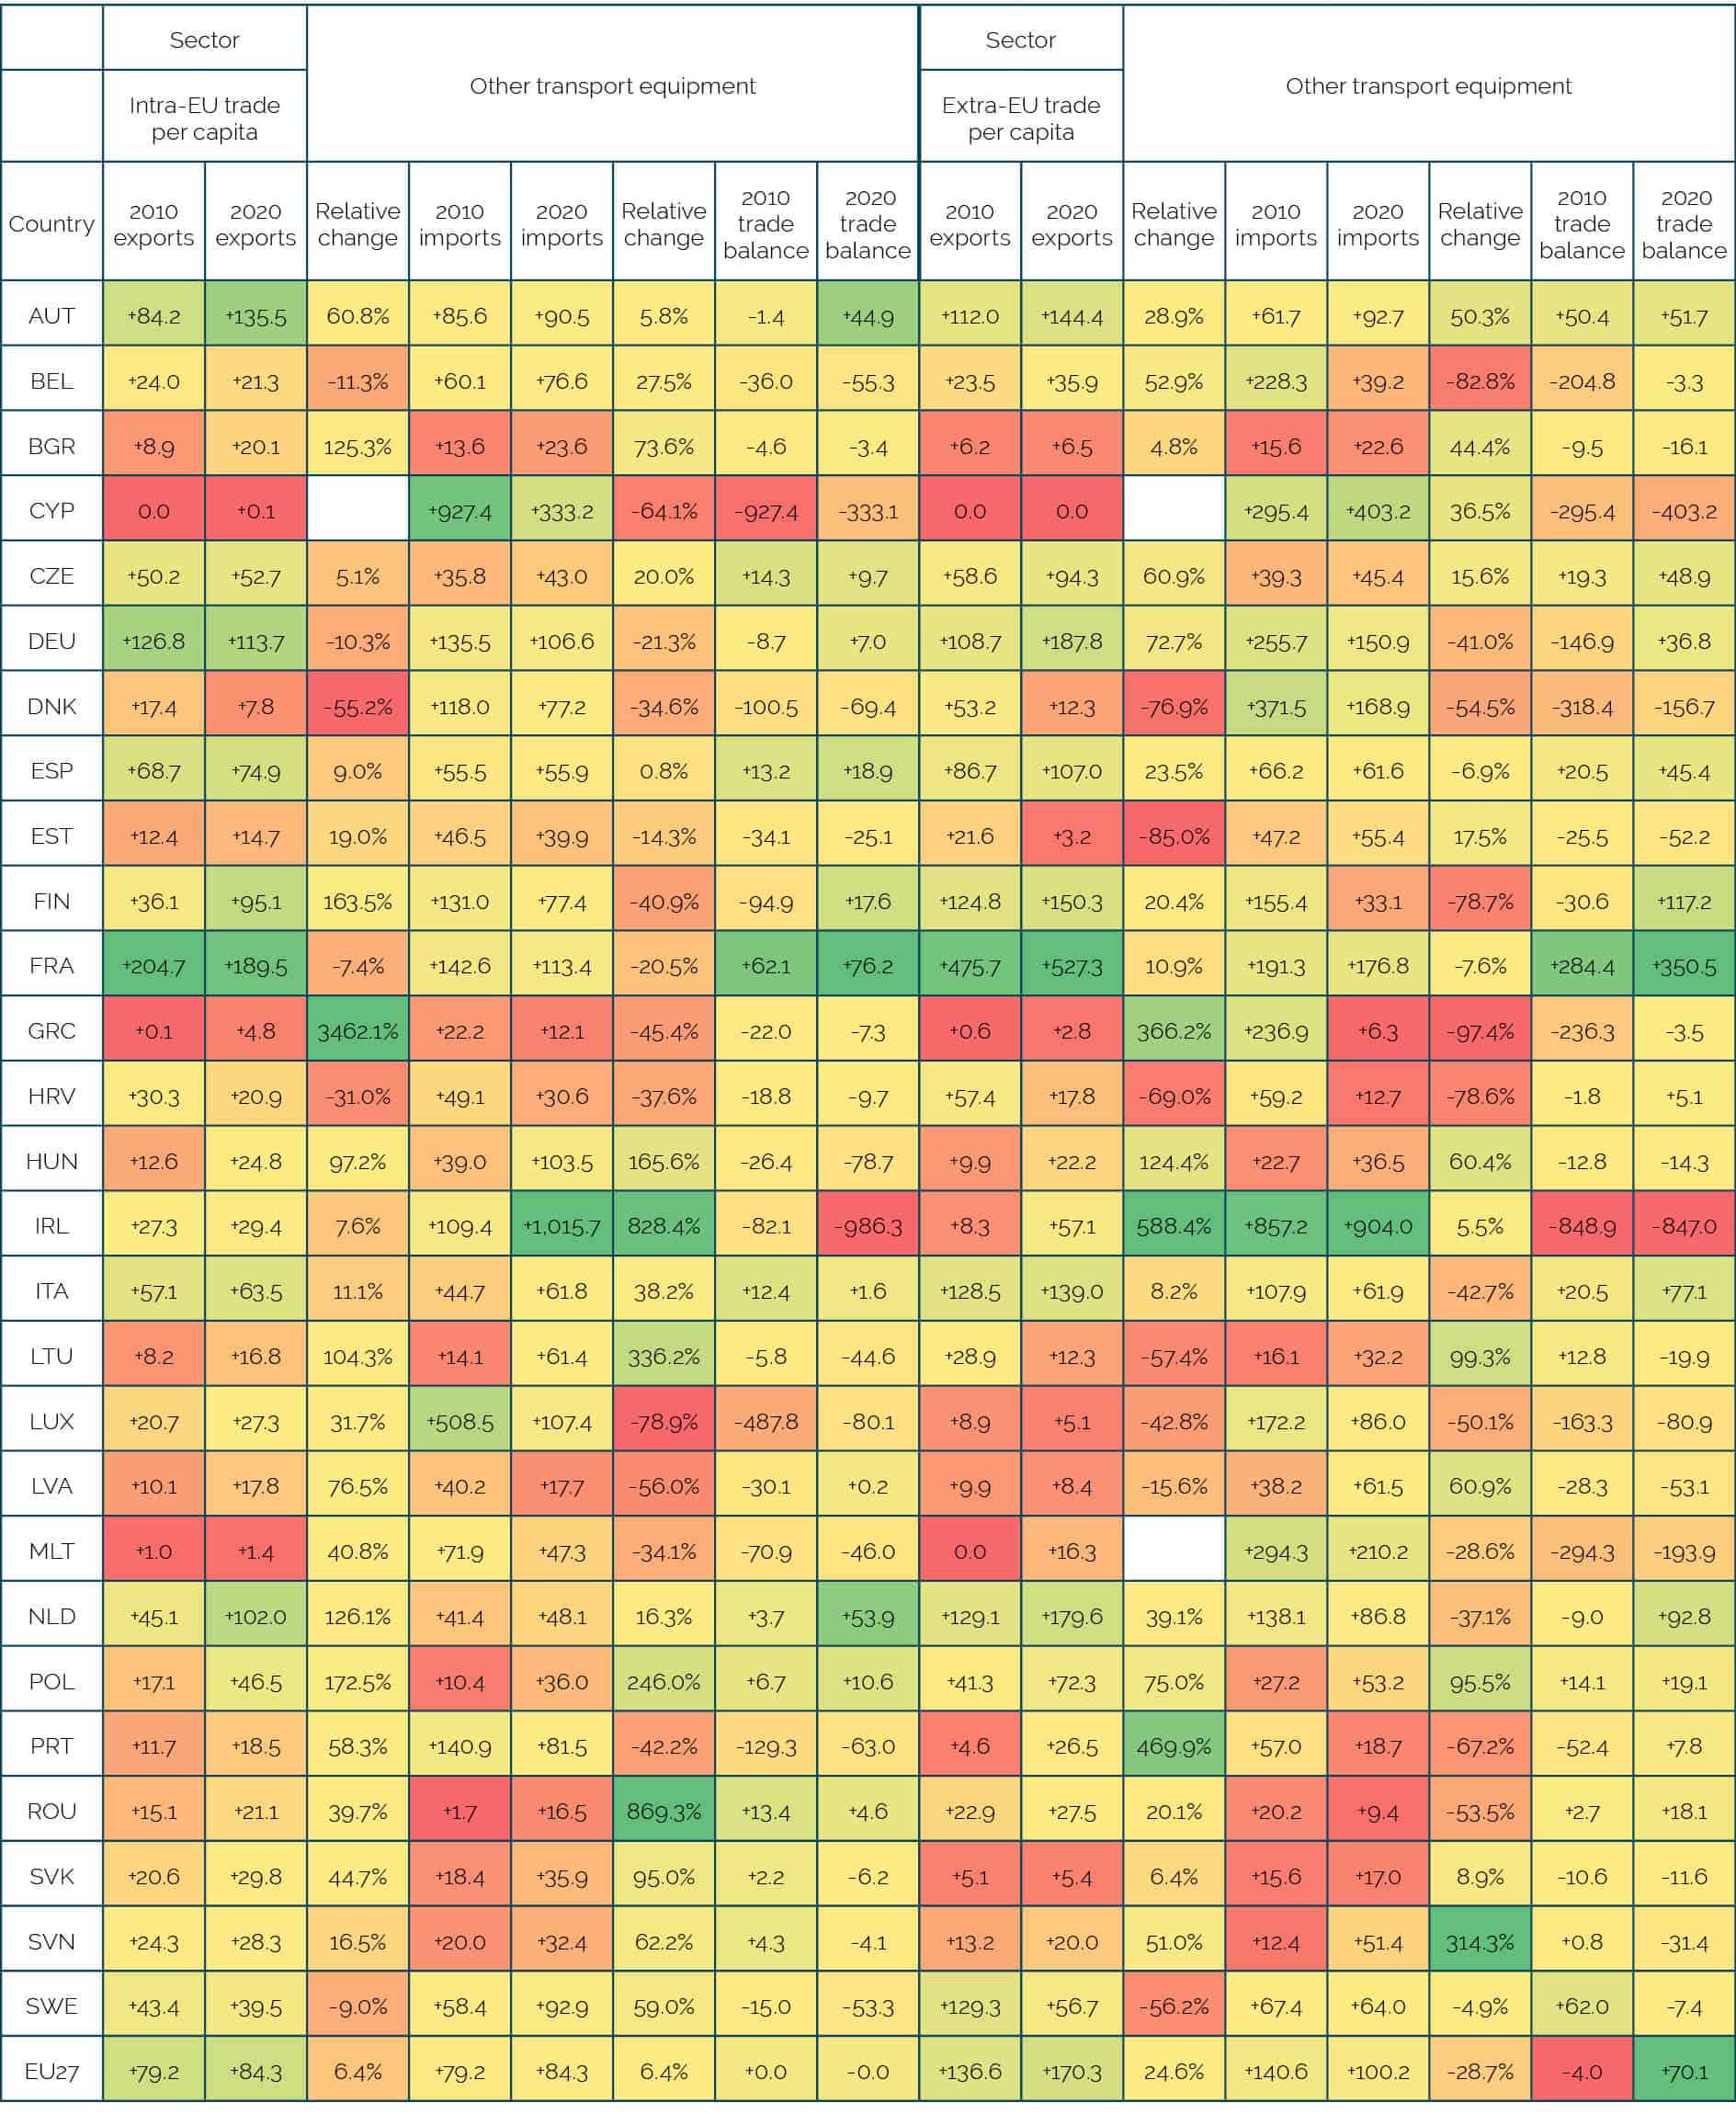 Source: Authors’ calculations based on OECD-TiVa.
Table 13: EU trade in publishing, audiovisual and broadcasting activities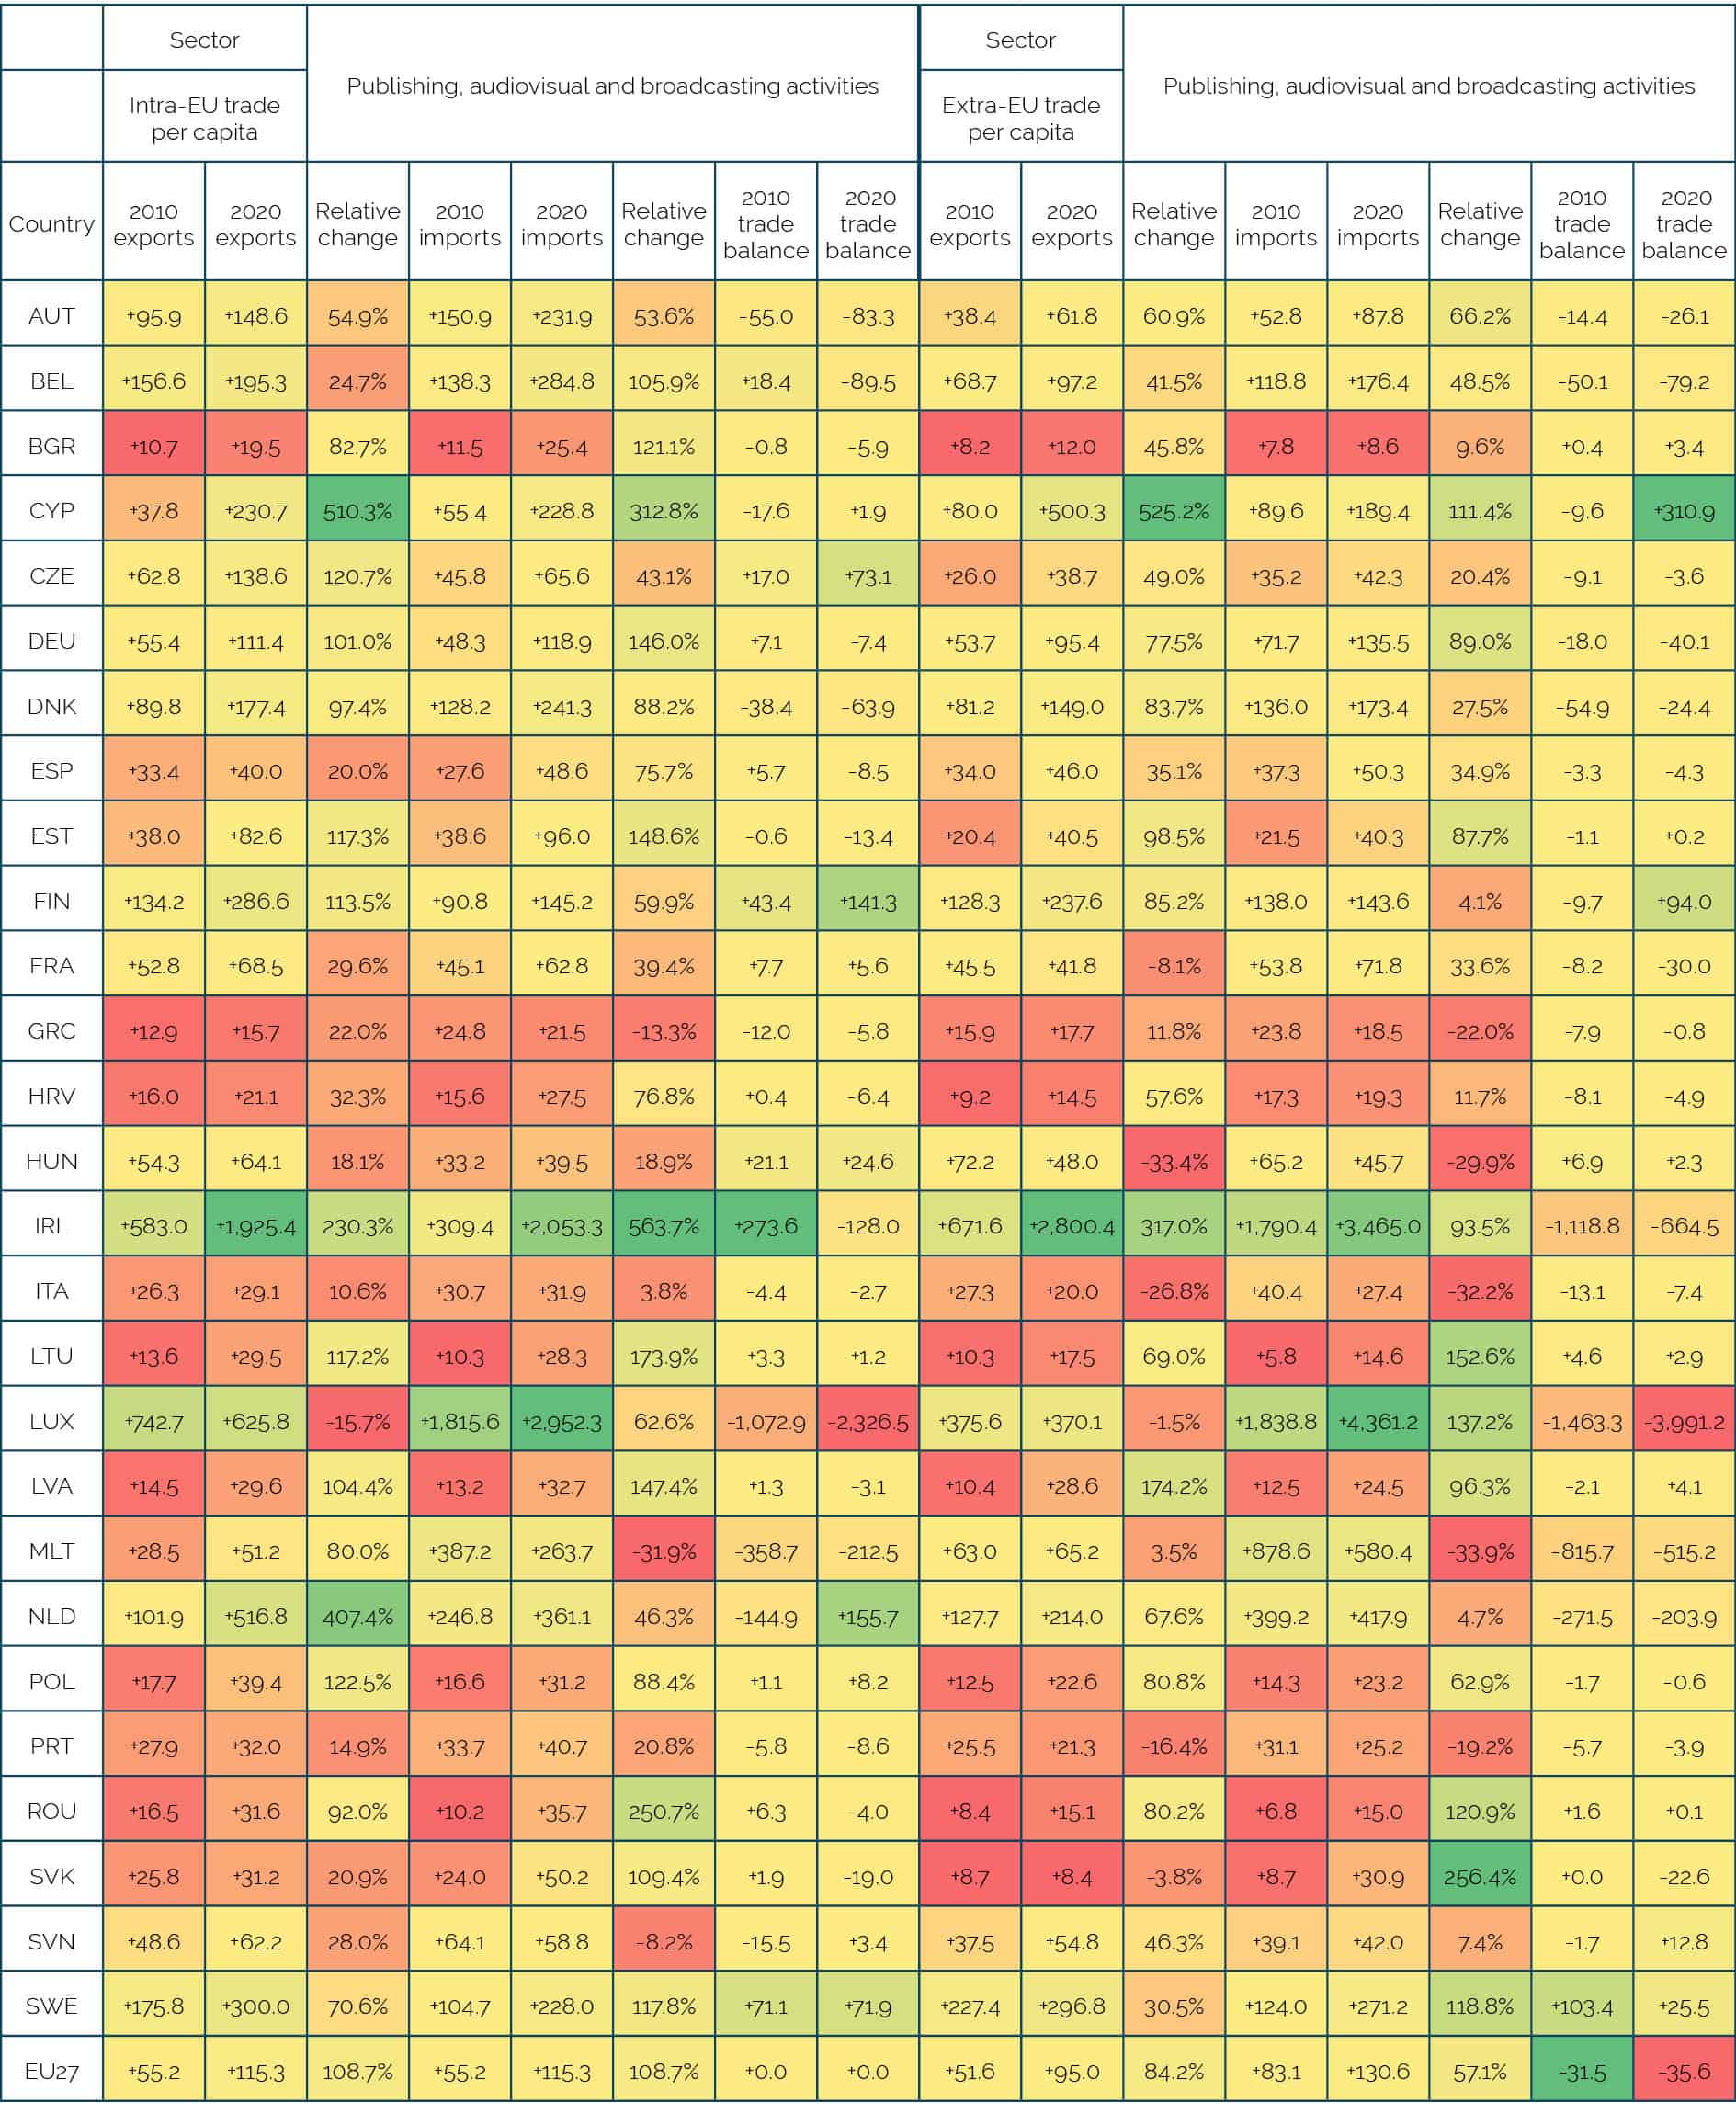 Source: Authors’ calculations based on OECD-TiVa.
Table 14: EU trade in telecommunications services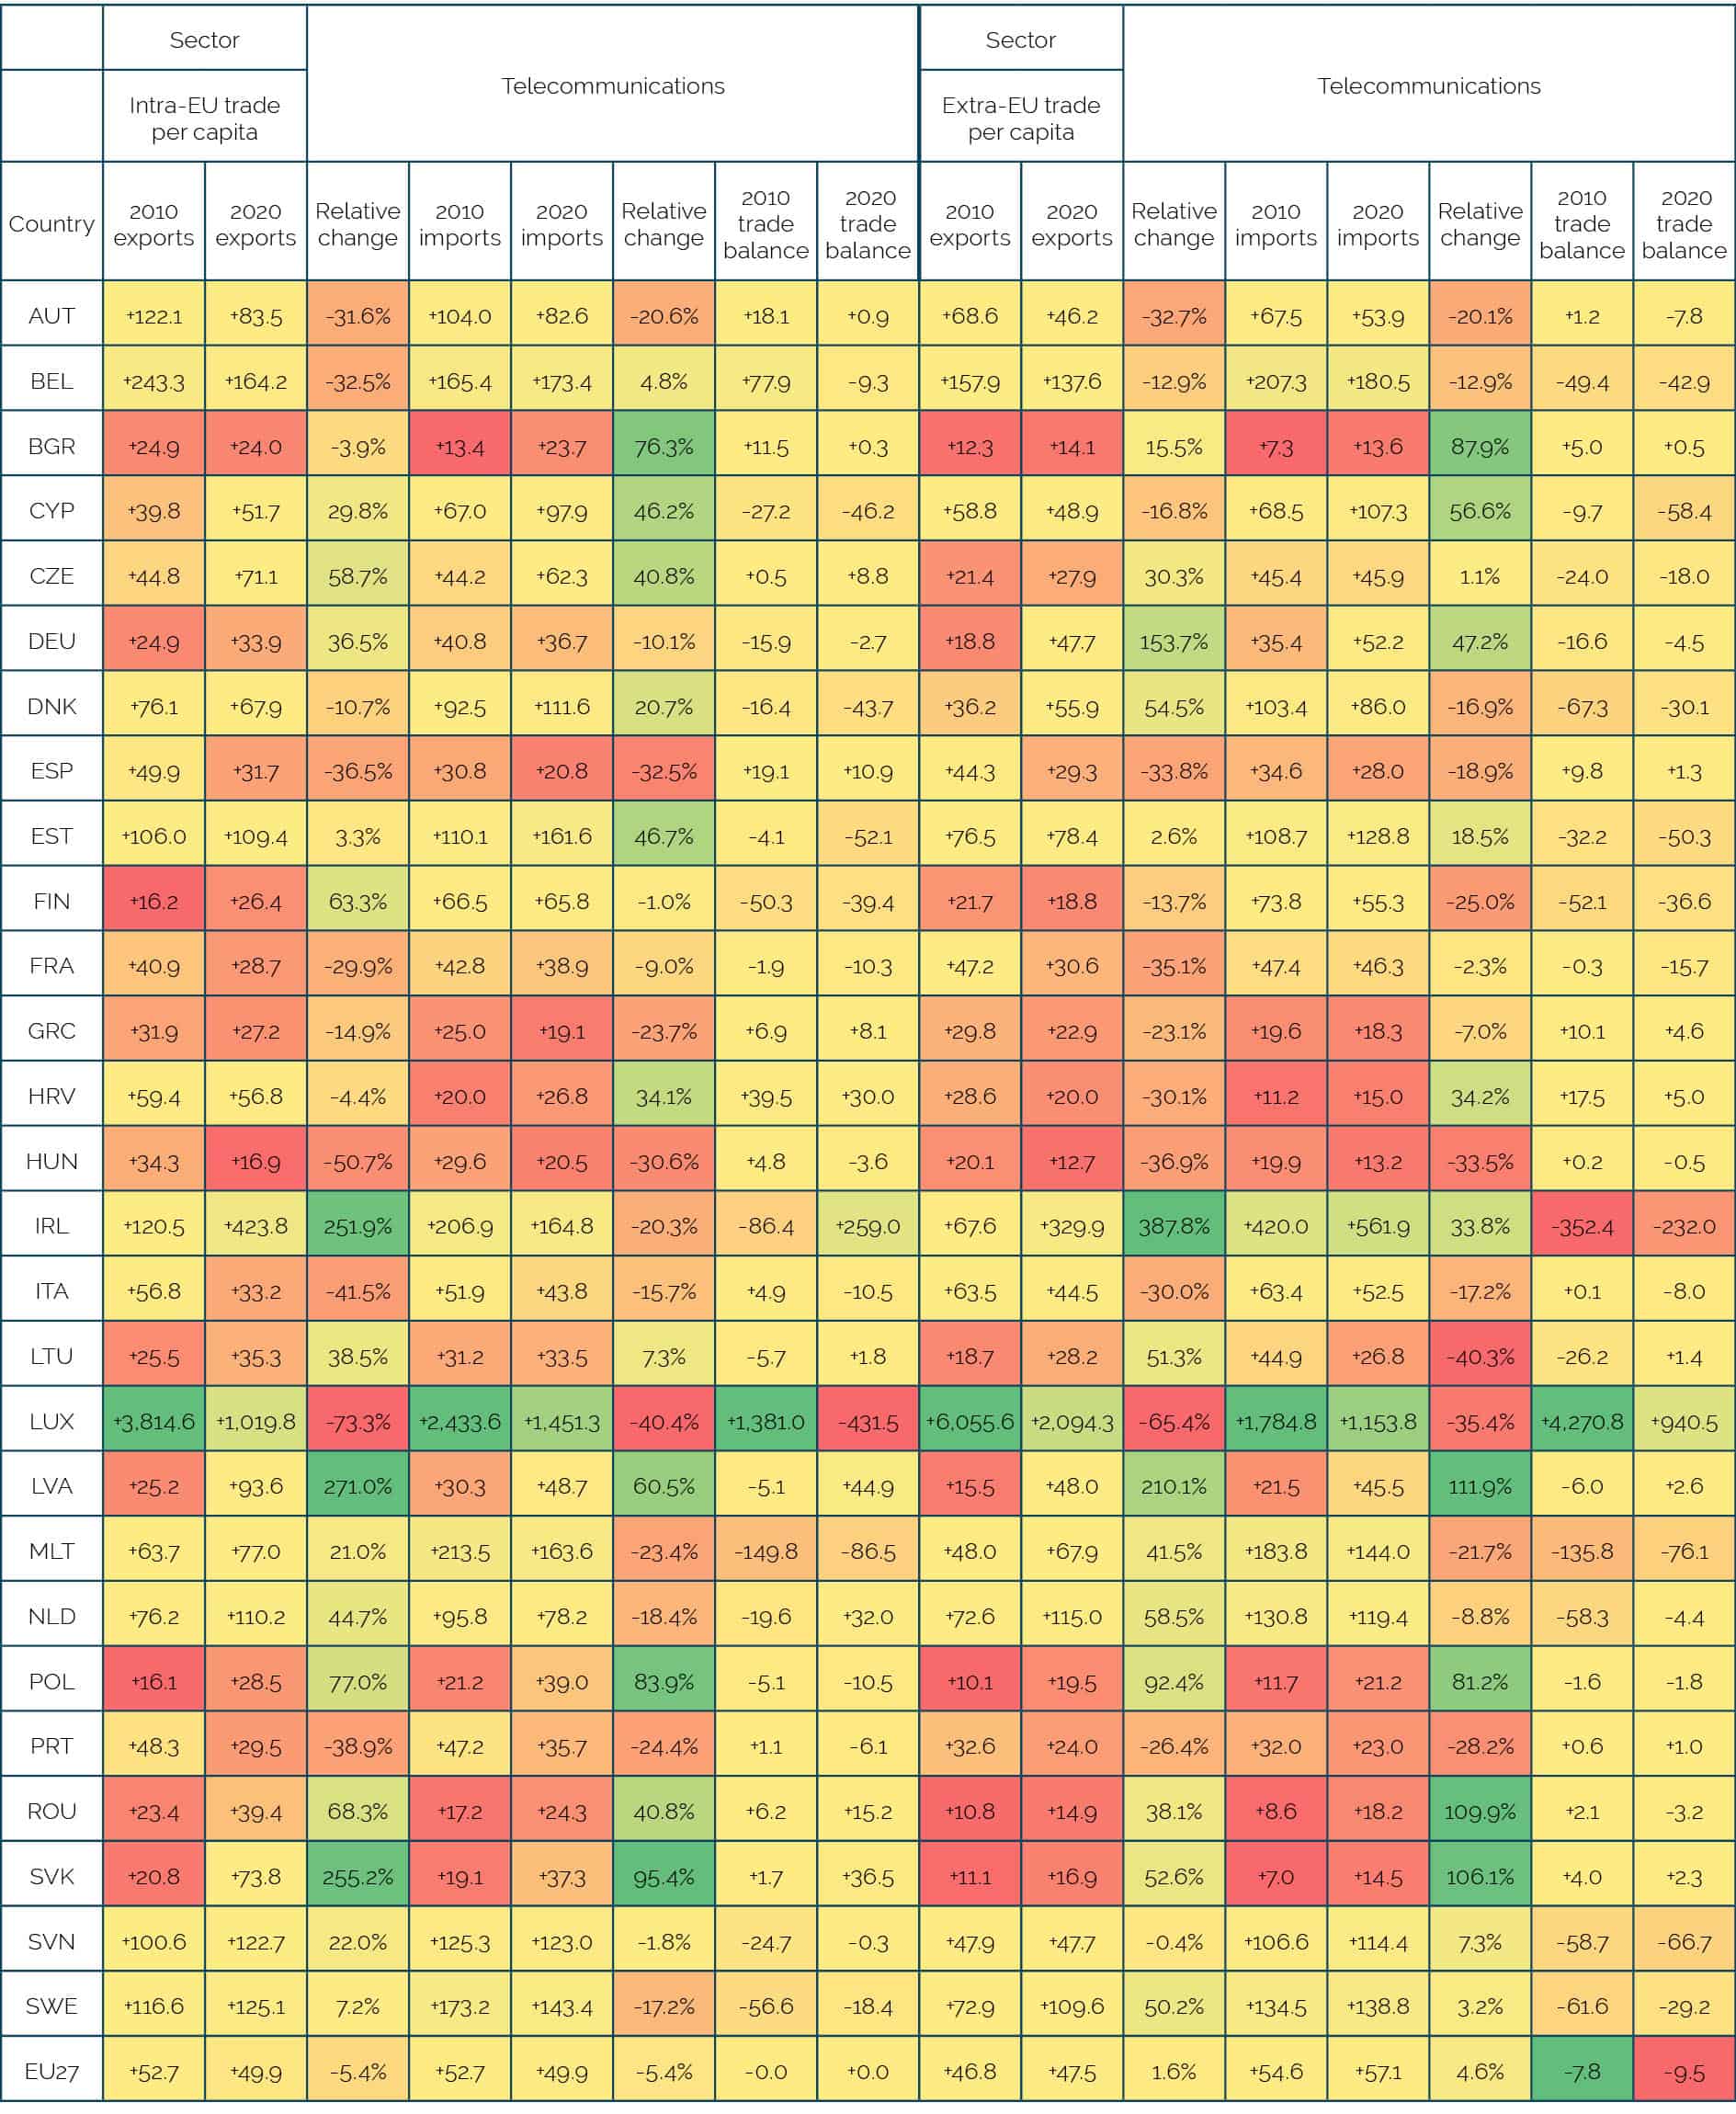 Source: Authors’ calculations based on OECD-TiVa.
Table 15: EU trade in computer programming, consultancy and information services activities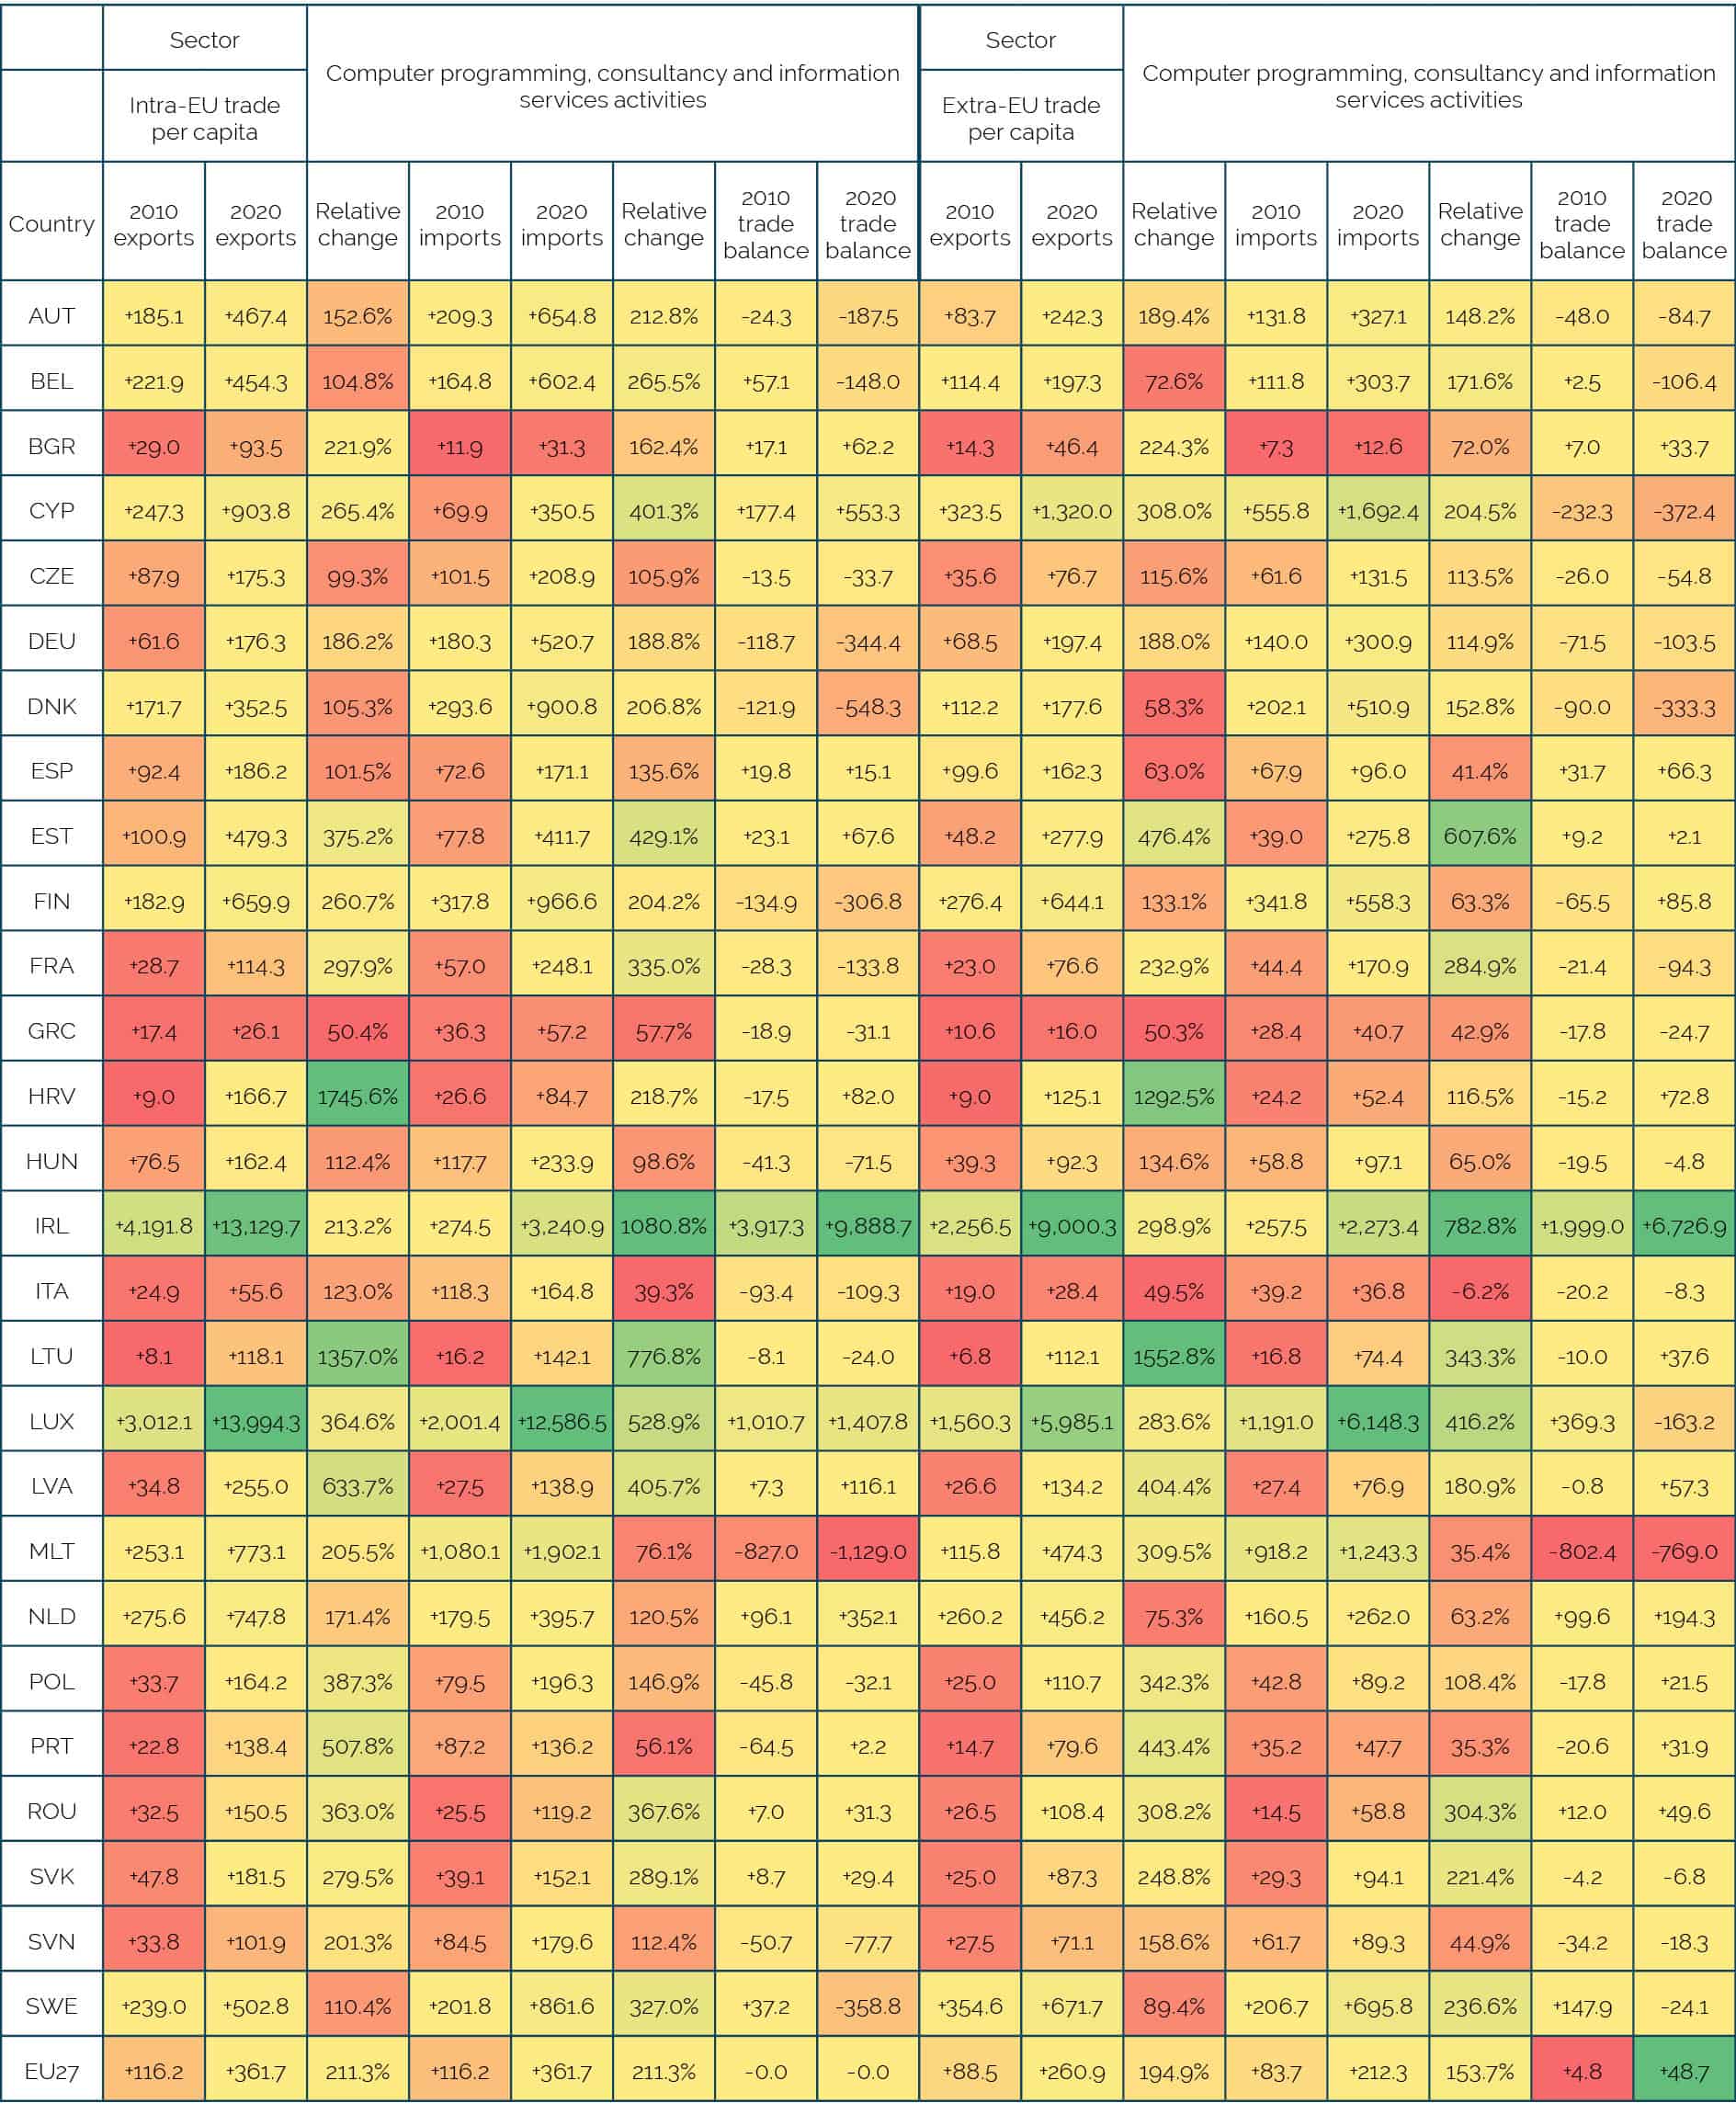 Source: Authors’ calculations based on OECD-TiVa.
Table 16: EU trade in professional, scientific and technical activities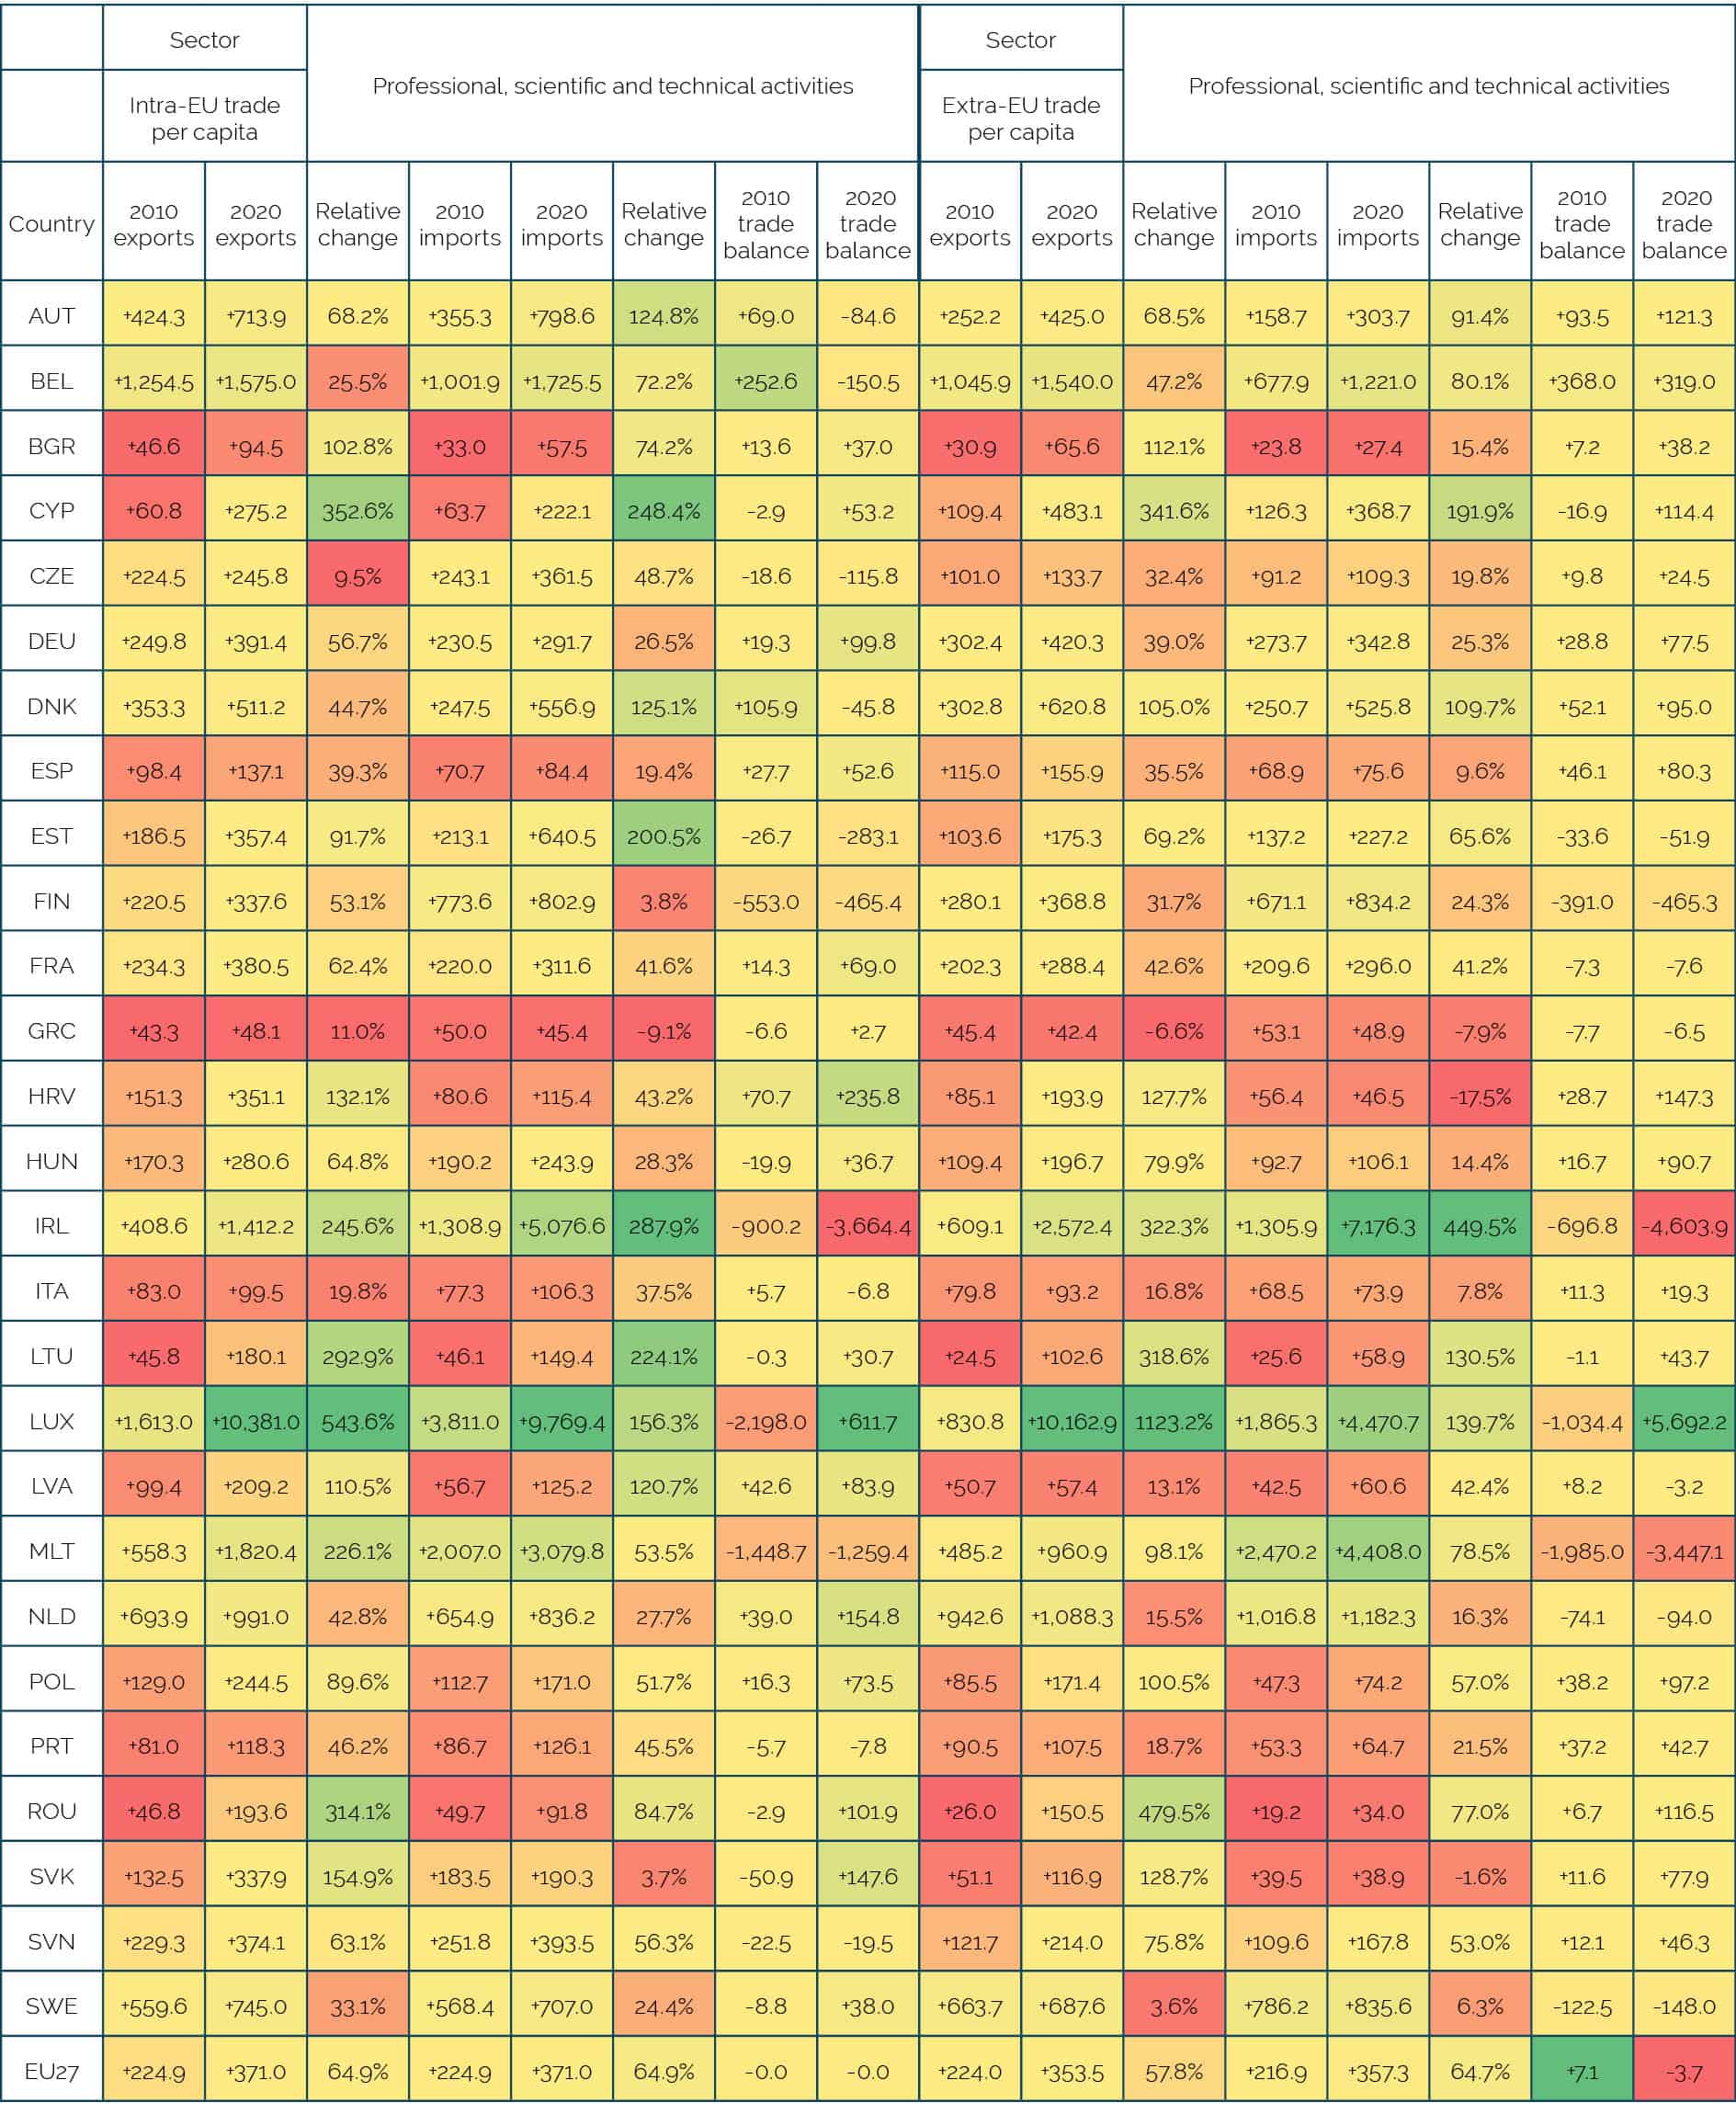 Source: Authors’ calculations based on OECD-TiVa.