Published
Sweden vs Switzerland: A Heavyweight Champions Fight on Innovation
By: Andrea Dugo
Subjects: Digital Economy European Union

Much like with other headline-making international rankings, the UN’s World Intellectual Property Organization (WIPO) has recently drawn media attention with the release of the 2024 edition of its Global Innovation Index. True to form, the index places Switzerland and Sweden at the forefront of global innovation, crowning them as the 1st and 2nd most innovative economies, respectively. Switzerland has consistently claimed the top spot since 2011, when WIPO began co-publishing the index alongside its original creators, INSEAD and World Business magazine (which independently managed it from 2007 to 2010). Sweden, while a frequent runner-up, has occasionally yielded the second position to other countries such as the UK (2014 and 2015), the Netherlands (2018), and the US (2022).
The notion of innovation is famously difficult to define – and even harder to fully fathom – yet the index places significant weight on a range of factors across various dimensions, including institutions, human capital and research, infrastructure, market and business sophistication, as well as knowledge, technology, and creative outputs. Through this analytical lens, it becomes evident why Switzerland and Sweden consistently rank so highly and what their shared strengths are.
Both are affluent, mature European economies with well-educated, highly skilled workforces and a strong commitment from both the government and the private sector to lifelong learning and innovation. Switzerland and Sweden both benefit from robust institutional frameworks, characterised by transparent, effective, and stable governments that broadly promote innovation-friendly policies. They also exhibit high levels of R&D investment relative to GDP, dedicating substantial resources to education, research, and innovation initiatives.
While distinctions do exist – Sweden is a large, Nordic peninsula and an EU member, whereas Switzerland is a smaller, mountainous country engulfed by EU Member States but is not part of the bloc – differences may seem minor to the casual observer. Ironically, the two countries even share the first two letters in their names.
The aim of this analysis, however, is not to dwell on surface-level similarities between Switzerland and Sweden but rather to explore the deeper differences between the two countries. Picture two climbers, immortalised in a snapshot taken somewhere along an alpine trail. The picture captures the moment perfectly but reveals little about the paths the climbers have taken to reach that point, and even less about the routes they might take next. They could both be ascending towards the summit side by side, or perhaps they merely crossed paths halfway – one still brimming with energy and focused on the peak, the other weary and beginning the descent back to the valley. The intention is precisely to delve deeper into the individual journeys of the two countries, to better understand where they have come from and, most importantly, where they may be heading.
To begin, let us examine measures of economic development. When adjusted for purchasing power parity (PPP) and inflation, Switzerland’s GDP per capita in 2023 stood at nearly $US 83.000, making it the sixth most prosperous economy globally – three places ahead of the US. Meanwhile, Sweden’s GDP per capita reached just over $US 64.000 – a stark difference with Switzerland. A preamble is necessary here: the comparison between Switzerland and Sweden represents a heavyweight champions fight between two of the most prosperous and advanced economies globally. While Sweden’s GDP per capita is significantly lower than Switzerland’s, it remains exceptionally high by both international and EU standards. Having said that, the disparity between the two nations remains pronounced.
However, extending the analysis beyond a single point in time to examine the relationship between Swiss and Swedish GDP per capita over a broader period reveals an interesting trend. With data spanning from 1990 to 2023, Figure 1 shows the evolution of Sweden’s GDP per capita as a percentage of Switzerland’s over time. The first, striking observation is Sweden’s rapid progress in narrowing the gap with Switzerland during the 1990s and early 2000s. In the early 1990s, Sweden’s GDP per capita was slightly above 60% of Switzerland’s, but by 2006, it had risen to 76% – a remarkable increase in just 15 years. However, since then, this momentum has slowed down significantly. Over the subsequent 15-17 years, and with significant fluctuations, Sweden has managed to close the gap by only an additional 1 to 2%. By 2023, Sweden’s GDP per capita stood at 77.4% of Switzerland’s, marginally below the all-time high of 77.8% achieved in 2022.
Figure 1: Sweden’s GDP per capita as a share of Switzerland’s, 1990–2023 (percentage, constant 2021 international dollars, PPP)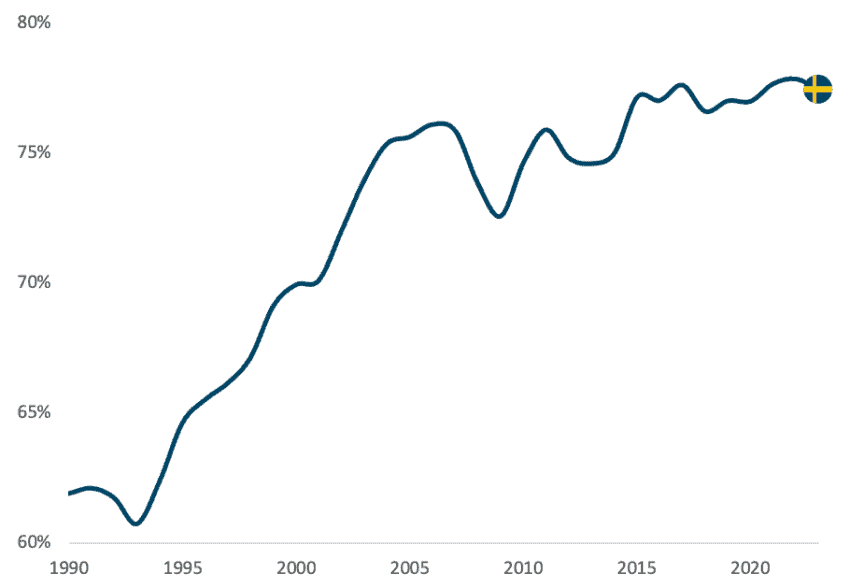
Source: Author’s calculation based on World Bank data.
The analysis of GDP per capita data suggests a sizeable surge in comparative economic prosperity for Sweden during the 1990s and early 2000s. However, it also points to a subsequent loss of competitiveness – or at the very least, a stagnation – in Sweden’s economic performance relative to Switzerland from the mid-2000s onwards. While Sweden has not fallen further behind Switzerland over the past 15 years, it has made no meaningful progress in closing the gap with it either. With a disparity of some $20.000 still separating the two nations, the economic divide remains substantial.
The competitiveness gap between Switzerland and Sweden over the past 15 years is even more visible when comparing the two countries across one of the most iconic indicators of productivity: GDP per hour worked. Figure 2 shows these trajectories. According to data from the International Labour Organization (ILO), in 2005, Switzerland and Sweden had nearly identical levels of GDP per hour worked – $US 61.2 and $US 61, respectively. Over time, the two countries’ paths have diverged, with occasional moments of convergence, and they have stably moved apart since at least 2020. By 2024, projections estimate Sweden’s figure at $70.6 and Switzerland’s at $76.4 – a modest but tangible difference.
This divergence is more to be attributed to a flattening in Sweden’s productivity growth rather than to an acceleration in Switzerland’s. For context, the US has also closed the gap with Sweden during this period. In 2005, the US figure stood at $57.7 compared to Sweden’s $61. By 2024, Sweden’s labour productivity is expected to fall below that of the US for the first time.
Figure 2: GDP per hour worked in Sweden and Switzerland, 2005–2024 (2017 US dollars, constant prices, PPP)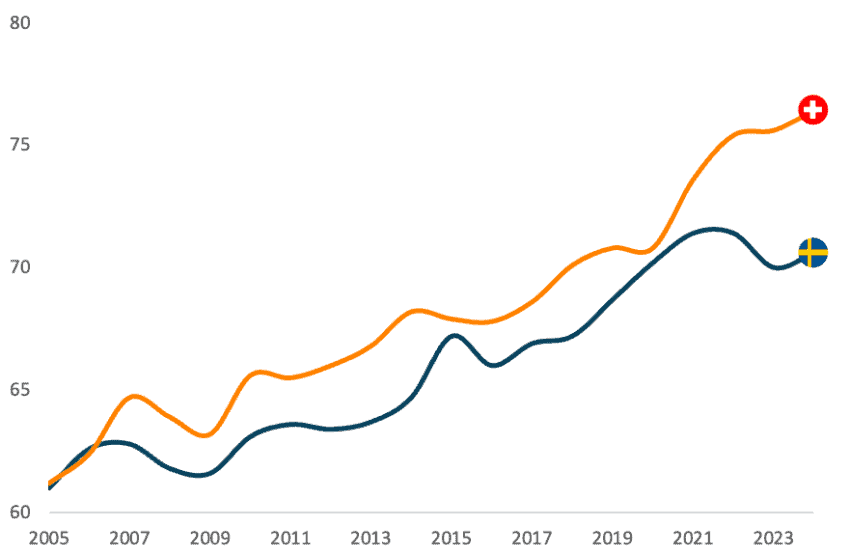 Source: Author’s elaboration based on ILO data.
Although still at high levels, the question remains: why has Sweden’s economic development lost steam over the past 15 years? And, conversely, what has Switzerland done right to maintain its steady progress?
One of the structural challenges that can impede innovation and consequently economic growth is limited access to capital, particularly for young, fast-growing startups. The substantial underdevelopment of EU equity markets compared to other global economies – the US being a prime example – is often cited as one of the greatest obstacles to European competitiveness and innovation. Firms, especially nascent ones, frequently struggle to secure the necessary financing, leading many to relocate to more favourable markets. This trend exacerbates the brain drain from the Old Continent and undermines innovation within the EU. When discussing matters of innovation and competitiveness, a comparison between Sweden and Switzerland on this issue is especially pertinent.
From virtually every angle, Sweden stands out among its European counterparts as an exception to the rule, even when compared to Switzerland, which is widely regarded as having one of the deepest capital markets globally. The current market capitalisation of Nasdaq Stockholm, Sweden’s stock exchange, is approximately €1 trillion. This figure surpasses that of countries like Italy or South Korea, whose populations are over five times larger and whose GDPs are three to four times greater. As of December 2023, Sweden’s stock market capitalisation equated to nearly 170% of its GDP, a level only slightly below Switzerland’s 187% but higher than the US at 156%. Despite the size of its economy, by international standards, Sweden’s stock market demonstrates remarkable vitality.
Even more interestingly, the Swedish capital market – which the Financial Times recently termed the “envy of Europe” – offers a particularly advantageous environment for young, high-growth firms. The Nasdaq First North Growth Market, a segment of the Stockholm Stock Exchange, has cultivated an active exchange tailored to SMEs. This ecosystem provides these firms with greater exposure and direct connectivity to a strong and varied network of investors. The focus on supporting fast-growing SMEs and startups is reflected on Sweden’s strong venture capital market, which consistently portrays a willingness to invest in and support innovative young companies.
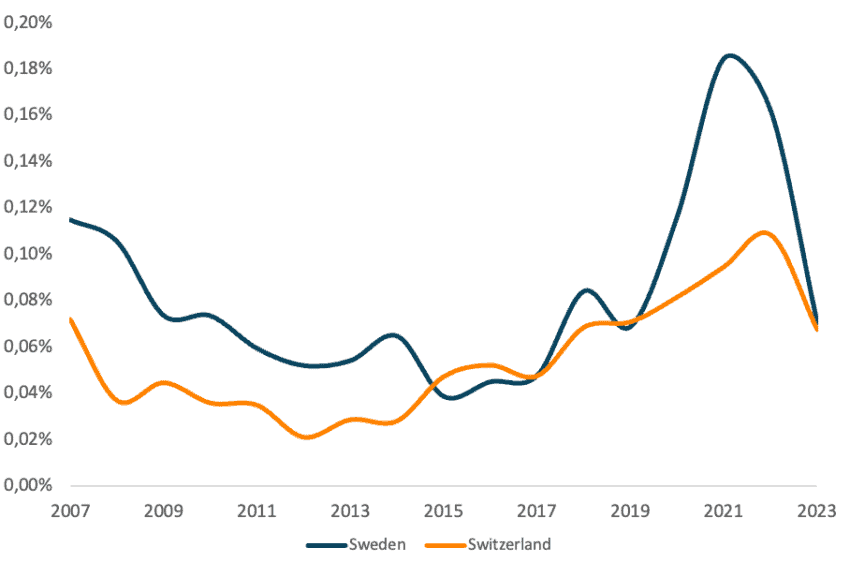
Figure 3 below illustrates venture capital (VC) investments as a percentage of GDP for Sweden and Switzerland since 2007. Over the past 15 years, Sweden’s VC market has consistently outperformed Switzerland’s in terms of size, although the two have been gradually converging. A closer analysis using OECD data also reveals that, while VC investments in both Sweden and Switzerland stood at 0.07% of GDP in 2023, the allocation of these funds differed significantly. In Sweden, VC support directed towards young ICT firms accounted for 0.04% of GDP – nearly 60% of all VC investments – compared to just 0.01% in Switzerland, representing only 15% of total Swiss VC investments. Thus, not only has Sweden historically maintained a larger venture capital market than Switzerland, but it has also demonstrated a much stronger focus on the tech sector.
Sweden’s emphasis on nurturing the growth of young companies has positively influenced its ability to produce unicorns – startups valued at $1 billion or more. Sweden boasts six unicorns, compared to Switzerland’s five, however, the total valuation of Swedish unicorns amounts to nearly $22 billion, significantly surpassing Switzerland’s $9 billion. Even when considering the recent bankruptcy of Northvolt, Sweden’s most valuable unicorn, its total unicorn valuation remains substantially higher than that of Switzerland. If Sweden has any competitive weaknesses relative to Switzerland, they certainly do not stem from barriers to accessing capital.
Figure 3: Venture capital investments as a share of GDP in Sweden and Switzerland, 2007–2023 (percentage)
 Source: Author’s elaboration based on OECD data.
Besides limited access to capital, another usual suspect behind slowdowns in innovation and competitiveness is R&D spending. As we have extensively demonstrated elsewhere and the Draghi report has done too, R&D investment is the very motor of innovation, and no comparative analysis of competitiveness can overlook it. One of the primary reasons for the EU’s lagging competitiveness compared to other advanced economies – particularly the US – has been proven to be lower R&D spending, especially by the private sector, and a distribution skewed towards middle technology sectors rather than high tech ones.
The first area to examine then is R&D intensity, that is R&D spending as a percentage of GDP. Interestingly, Switzerland and Sweden were virtually on par in 2021 – the latest available year for both countries – with 3.31% and 3.4% of GDP, respectively. By this measure, even if by a hair’s breadth, Sweden even outpaces Switzerland. Similarly, when analysing expenditure by sector of performance, business R&D in Sweden accounted for 72% of the total, compared to 68% in Switzerland. Once again, a small win for Sweden. Unlike for the EU, where low overall R&D investment and limited private sector involvement are prominent issues, these cannot possibly be the causes of Sweden’s slower economic performance relative to Switzerland. The focus then is to shift to the breakdown of privately funded R&D spending by firms’ technological profile. Figure 4 below highlights precisely this.
When comparing the two countries in 2005 and 2022, the findings are striking. In 2005, Switzerland already displayed a greater concentration of R&D spending in high tech sectors, with 68% of the total, compared to Sweden’s 50%. However, Sweden’s share was still remarkable as half of all its business R&D was driven by high tech firms. By 2022, the picture had changed significantly. Switzerland saw its share of high tech R&D spending increase to 72%, a 4-percentage-point rise. In contrast, Sweden witnessed a substantial decline, with high tech firms accounting for only 38% of private R&D spending. Meanwhile, medium-high tech firms in Sweden became dominant, with their share rising from 41% in 2005 to 56% in 2022.
Between 2005 and 2022, the technological profile of top R&D performers in Switzerland grew more high-tech, while the reverse occurred in Sweden. While the Scandinavian country’s R&D spending remains robust in terms of size and private sector involvement, Sweden appears to have succumbed to one of the EU’s chronic conditions – the middle technology trap. Sweden’s emphasis on fostering the growth of new, fast-scaling companies through VC investments, especially in the ICT sector, is a step in the right direction. This approach is especially critical as the country’s more established economic sectors have visibly veered more mid-tech.
Figure 4: Business R&D spending distribution by R&D intensity level for Switzerland and Sweden, 2005 and 2022 (percentage of total)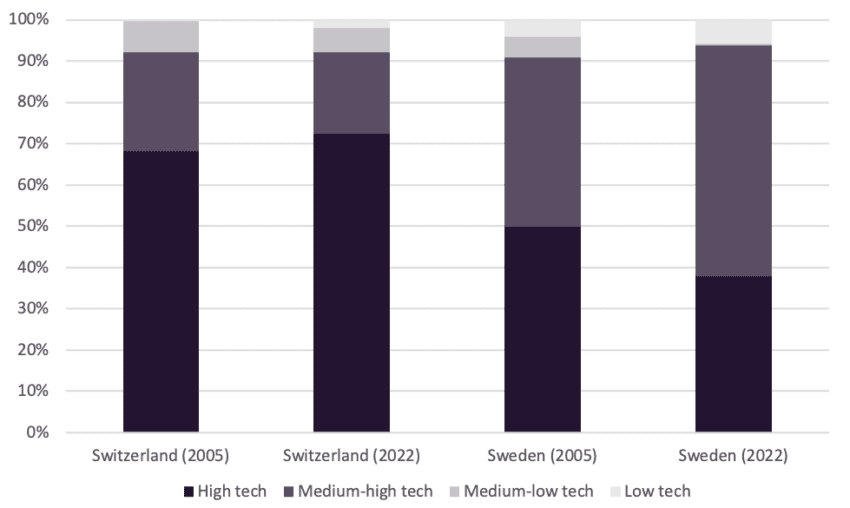
Source: Author’s calculation based on the 2006 EU Industrial R&D Investment Scoreboard and on the 2023 EU Industrial R&D Investment Scoreboard.
Another macroeconomic dimension worth comparing between Sweden and Switzerland in the context of innovation and competitiveness is trade. Both countries, due to their small size and advanced economies, are heavily reliant on international trade. However, Switzerland has positioned itself as a more ardent proponent of free trade compared to Sweden, leveraging this stance to bolster its economic dynamism. Trade is widely recognised as a critical driver of economic growth, innovation, and competitiveness, fostering the exchange of ideas, access to larger markets, and the efficient allocation of resources.
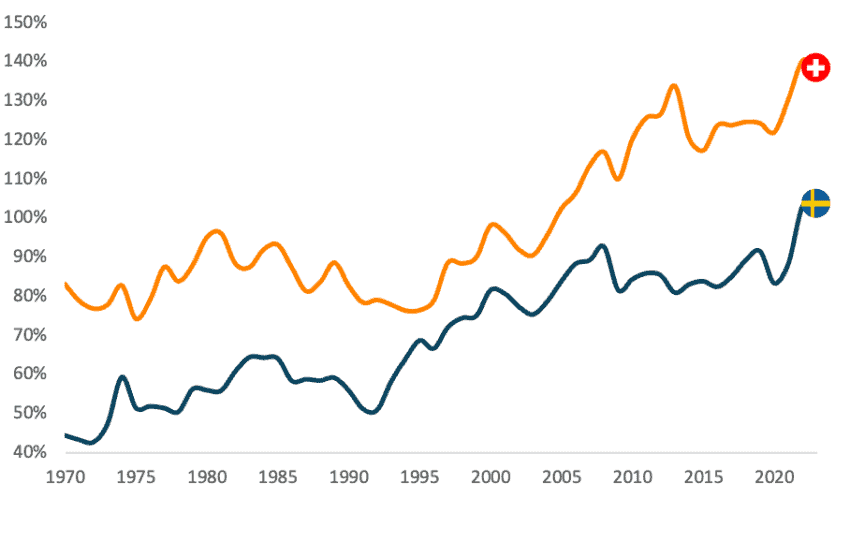
Figure 5 illustrates the evolution of the sum of exports and imports as a percentage of GDP – commonly referred to as the trade openness index – for both nations since 1970. Trade has consistently played a more central role in the Swiss economy than in the Swedish one, highlighting Switzerland’s greater integration into global markets. During the 1990s and early 2000s, the gap between the two countries’ trade openness narrowed significantly, mainly due to Sweden’s catchup. However, since the mid-2000s, this gap has steadily widened again. In 2006, Sweden’s trade openness index stood at 88%, while Switzerland’s was higher at 106%. By 2023, Sweden’s index had increased modestly to 104%, whereas Switzerland’s surged to 138% – a 32-percentage point increase, double that of Sweden.
While both countries rely heavily on trade for economic vitality, Switzerland has consistently outperformed Sweden in trade openness, doubling its lead over the past two decades. This divergence underscores the Swiss economy’s exceptional capacity to integrate into global markets, reinforcing its competitiveness on the international stage.
Figure 5: “Trade openness index” for Sweden and Switzerland, 1970–2023 (sum of exports and imports of goods and services divided by GDP, percentage)
 Source: Author’s elaboration based on World Bank data.
Switzerland and Sweden are undoubtedly more similar than different, yet Switzerland has consistently maintained a clear advantage in both prosperity and economic competitiveness. Sweden’s economic growth, which gained notable traction during the 1990s and early 2000s, seems to have slowed in recent years. While annual economic growth rates in both countries have been broadly comparable over the past 15 years, Sweden needs to do more to narrow the gap in innovation and overall competitiveness. This analysis identifies two key factors contributing to this disparity: Sweden’s less high-tech industrial base and its comparatively lower integration into global trade, particularly when measured against Switzerland’s highly interconnected and export-driven economy.
To narrow the trade gap, Sweden should pursue policies that increase its exposure to international markets. At the EU level, this might involve advocating for deeper trade agreements with global partners, particularly in emerging markets, and working to reduce non-tariff barriers that inhibit Swedish exports. Additionally, Sweden could complement its EU-based efforts with domestic initiatives that strengthen industries poised to succeed in international markets, such as clean technology, biotechnology, and advanced manufacturing.
Addressing its middle-technology industrial structure is equally vital for Sweden’s long-term competitiveness. The country has already made significant progress by cultivating a supportive environment for SMEs and startups, particularly in the ICT sector. Sweden’s emphasis on fostering and scaling innovative firms underscores a forward-looking strategy for building a knowledge-based economy. A prime example of this is Spotify – the country’s most highly valued company – which has achieved global prominence in the tech and media space.
By contrast, Switzerland’s economic strength is rooted in its long-established high-tech industries, represented by global leaders such as Roche and Novartis in pharmaceuticals and ABB in industrial automation. These firms highlight Switzerland’s ability to dominate high-value, research-intensive sectors. While Sweden is increasingly emerging as a leader in the startup ecosystem, it faces the challenge of ensuring that these new companies evolve into globally competitive players within high-tech industries. Scaling startups into world-leading firms will require not only robust domestic support but also access to international markets, larger pools of venture capital, and policies designed to encourage innovation in advanced technologies.
To achieve this, Sweden must make even greater use of its well-developed capital markets. While its venture capital efforts are impressive by European standards – ranking third in the EU behind smaller states like Estonia and Luxembourg – they remain far below the levels seen elsewhere. For instance, US venture capital investments in 2023 were more than seven times larger than Sweden’s as a share of GDP, compared to just over twice as large in 2007. Sweden’s position in global VC funding, equivalent to the 33rd-ranking US state (Michigan), highlights the need to strengthen its VC ecosystem even further, not just domestically but also in attracting international investors.
Sweden has the tools to close the gap with Switzerland, but doing so will require sustained effort. By deepening its trade integration, strengthening its high-tech industrial profile, and expanding its already promising venture capital ecosystem, Sweden can not only emulate Switzerland’s economic success but carve out its own path as a global leader in innovation and competitiveness.