Published
The Critical Importance of the Single Market for Europe’s Global Trade Performance
By: Lucian Cernat
Subjects: EU Single Market European Union Services

The Single Market just turned 30. It is one of the EU’s greatest achievements and the success of the Single Market is built on the fundamental economic logic that binds EU Member States together. But the success of the Single Market has also been built on the same logic underpinning the EU position in global trade. This anniversary moment provides a good occasion for a comparative analysis of EU trade performance inside the Single Market and in the world economy. Given the current turbulent global context and the disruptive technological and geopolitical forces at play, one cannot avoid asking what role will the Single Market play in the future of Europe’s global, long-term competitiveness.
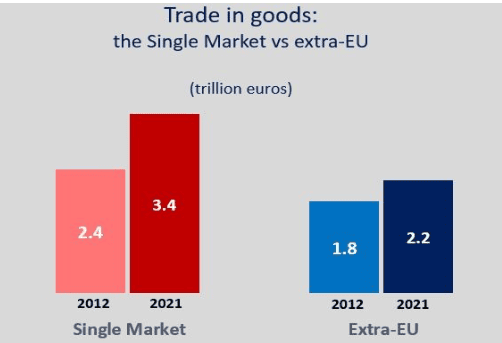
For a start, in the last decade in particular, the Single Market made steady progress and expanded more than extra-EU trade, notably in the areas of trade in goods (Figure 1). The Single Market has created an additional trillion euros of intra-EU trade in goods among the EU members between 2012 and 2021. At the same time, extra-EU trade expanded by only 0.4 trillion euros, during a period mired by structural changes in the global economy and, more recently, by unprecedented geopolitical complications.
Figure 1. Trade in goods: intra-EU vs extra-EU
Source: Author’s calculations based on Eurostat data.
The different evolution of intra- and extra-EU trade shows clearly the key benefits of the Single Market and the unparalleled level of EU integration. The stability of the Single Market was even more important during a period when world trade was essentially flat from 2011-2014, and declined substantially in 2015, followed by a slow growth rate throughout the subsequent period. In the first half of the 2010-2020 period, when trade has been sluggish almost everywhere around the world, the goods trade inside the Single Market kept growing. In 2016, world merchandise trade recorded its lowest growth rate in volume terms since the 2008 global financial crisis, and it declined in value terms by 3.3%, due to a fall in export and import prices. Then, 2017 turned out to be a good year for world trade and extra-EU trade grew at a promising rate of around 7%. But, during the same year, the merchandise trade within the Single Market grew at an even more impressive rate of 8.5%.
In fact, several analyses had indicated that the strong growth in goods trade within the Single Market during that period was the most important driving force behind the world trade recovery. Things looked promising, both at home and abroad. By 2017, global trade and trade policy were in an enviable shape. Forty-two percent of world trade was subject to zero MFN tariffs, with an additional 28% being duty-free, thanks to almost 300 bilateral FTAs between WTO members. However, the high growth rate in global trade did not last long, as major trade frictions kicked in, putting a break on global supply chains. The US-China trade war initiated by President Trump in 2017 spiralled into tit-for-tat retaliatory measures. In 2018, China imposed tariffs on almost 70 percent of its imports from the United States. U.S. tariffs on steel and aluminium also elicited retaliation from other trading partners, like Canada, the European Union, India, Mexico, and Turkey. Then, the world plunged into the covid19 crisis, followed by the war in Ukraine. Both events triggered massive trade disruptions.
Although all these global forces also affected to some extent the Single Market, the intra-EU trade flows remained resilient. At the end of this turbulent period, the trade in goods within the Single Market stood strong, one extra trillion higher than in 2012.
The Single Market goes well beyond trade in goods and also includes the services sectors. The adoption of the EU Services Directive in 2006 opened the path for higher intra-EU trade in services for several sectors accounting for around 46% of EU GDP (e.g. retail, tourism, construction, and business services). In addition to the main Services Directive, a number of sector specific EU laws were introduced to facilitate greater integration of financial services (like the Single Euro Payments Area (SEPA) that allows cashless euro payments to anywhere in the European Union, just like national payments), transport (e.g. EU laws protecting air passengers who are denied boarding or whose flight is cancelled or delayed), telecoms (the elimination of roaming charges was one of the most tangible Single Market gains for EU consumers), postal services (occasionally, I receive in Brussels parcels delivered by PostNL, the Dutch postal operator), or health services (Directive 2011/24/EU liberalised health services and allows patients to travel to another EU country to receive medical treatments and be reimbursed by their national health insurance).
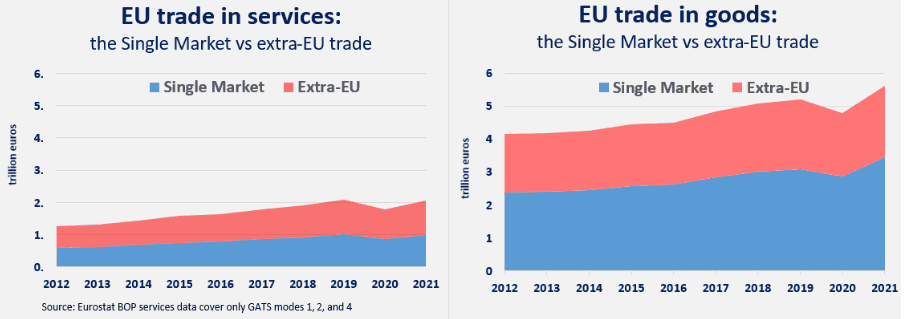
Figure 2. Trade in services vs trade in goods: intra-EU vs extra-EU Source: Author’s calculations based on the Eurostat data.
Yet, despite these tangible results and the fact that services account for over 70% of the EU economy, the Single Market for services remains work in progress. As Figure 2 below illustrates, intra-EU cross-border trade in services is much below its true potential. Moreover, unlike goods trade where the Single Market is bigger than extra-EU trade, the opposite is true in the case of services: surprisingly, perhaps, services trade with the rest of the world are slightly higher than services trade within the Single Market.
However, this should not be much of a surprise, really. Virtually all experts agree that strengthening the Single Market for services is key to securing the EU’s place at the forefront of the global economy. To better understand where progress can be made in boosting the EU Single Market for services, one needs to understand the various ways in which international services trade occurs, or the so-called services “modes of supply”. The WTO General Agreement on Trade in Services (GATS) defines four modes of supply for international services:
Mode 1 – digital cross-border supply of services, from one country to another. For example, an IT company sells an online software solution to a company abroad.
Mode 2 – the consumption of services abroad. For instance, patients travel to another country to receive medical treatment.
Mode 3 – services trade via commercial presence. A services company from country A opens an office in country B to sell services to local residents.
Mode 4 – presence of natural persons abroad. An IT company sends its employees directly to a customer in another country for installing the software solution locally.
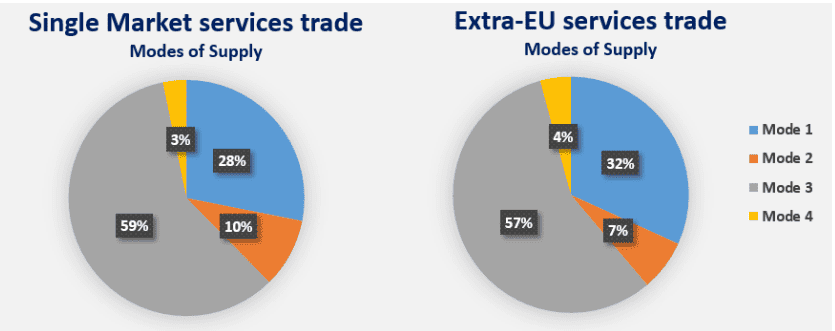
The GATS modes of supply offer a useful framework to assess the progress made by the Single Market for services, and compare the intra-EU and extra-EU services trade through this lens. As can be seen in the Figure 3 below (based on WTO services statistics by modes of supply for 2017, the latest available year), the structure of intra-EU and extra-EU trade in services is fairly similar.
Figure 3. The Single Market vs extra-EU trade: services by modes of supply Source: Author’s calculations based on the WTO TISMOS database (2017 data).
However, there are also some differences. One could discard these differences as noise in the data, or small, marginal variations generated by aggregation across countries, sectors, etc. Nevertheless, whether we look at differences or lack thereof between the relative importance of modes of supply in intra-EU and extra-EU services, there might be a policy message behind the Figure 3 data.
For instance, the share of mode 1 (digital services) is noticeably lower in the case of the Single Market services, compared with extra-EU trade. This difference can be explained by many factors, one of them being that distance still matters for trade in services and, therefore, when engaging in services trade over long distances, digital trade is often the most efficient mode of supply. This can also be an indication that the EU Digital Single Market is not yet fully up to speed. The EU share in the global ICT market has fallen from around 22% in 2013 to only 11% in 2022. To counteract this trend, the newly adopted KPIs in the EU strategy for long-term competitiveness for stronger cross-border digital exchanges (e.g. increase the share of SMEs that use e-commerce) could also help promote a higher share of mode 1 intra-EU digital services trade.
Another interesting difference is the higher share of mode 2 services in the Single Market than in extra-EU trade. Mode 2 services trade are accounted for mostly by tourism, and the bigger share in the Single Market than in extra-EU trade is consistent with the fact that there are more EU tourists travelling within Europe than foreign tourists. The higher share for mode 2 could also be an indication that other types of consumer-related services (e.g. cross-border health services, higher education services) are more developed in the Single Market than with third countries.
For the other two modes of supply, i.e. FDI-related (mode 3) and movement of workers (mode 4), the shares are fairly similar between the Single Market and extra-EU trade. For EU services providers that want to deliver services both in the Single Market and around the world, mode 3 remains the most important mode of supply. Similarities can also offer useful insights. The slightly higher share of mode 3 in the Single Market may indicate that it is easier to open an office in another EU country than abroad. However, the fact that the vast majority of enterprises in the services sectors are SMEs reduces the ability of the Single Market to generate higher level of cross-border establishments. This may explain why the mode 3 shares are so similar in intra and extra-EU trade. But things may change. The new emphasis on deepening the EU Capital Markets Union and the various policies aimed at creating more EU services unicorns may spur cross-border mode 3 services by innovative SMEs within the Single Market.
Figure 3 also indicates that the share of Mode 4 services (movement of workers) in the Single Market is similar in magnitude with extra-EU trade. The Mode 4 share in the Single Market might be lower than what one would probably expect, given the high level of integration among EU member states. However, this relatively low share is in line with certain other indicators and can be explained by the specific definition of mode 4 under the GATS, which hinges on the temporary nature of labour movement. While the EU integration has triggered a significant cross-border movement of persons across EU Member States, not all such labour activity falls within the “temporary movement” of workers that international trade in services captures under the so-called mode 4 services.
Intra-EU labour mobility has experienced a significant upward evolution during the last decades. In 2019, there were approximately 13 million people living and working in a different country than their own. However, the share of temporary cross-border movement of workers in the Single Market is much lower. The cross-border provisions of services via GATS mode 4 is mirrored in the Single Market through the EU legal provisions facilitating the posting of workers between EU countries (e.g. EU Directive 2018/957 and Directive (EU) 2020/1057), where an employer temporarily sends its employees to another EU country to provide a service there for a certain period of time.
Hence, intra-EU mode 4 services can be estimated from statistics on posted workers in the Single Market. Based on data from the dedicated EU monitoring mechanism of posted workers, it has been estimated that there were around 2 million posted workers in 2019. This is a relatively low level and corresponds, on average, to around 1% of EU employment. The share of posted workers was higher than 1% of total employment in some EU member states (e.g. Austria, Belgium, Germany) but in most other reporting EU member states the share of incoming posted workers in total employment of the host country was well below 1% of the total workforce. Posted workers were mainly employed in road freight transport and construction. For instance, the share of intra-EU posting in the construction sector amounted to 16% in Belgium, 7% in Denmark, and 5% in Austria, Sweden, and France.
Interestingly, and in line with the extra-EU data on mode 4, the EU databases on cross-border movement of workers indicate that the share of non-EU temporary workers employed in the EU can also be quite significant. Around 20% of the posted workers in Sweden came from outside the EU. France, Bulgaria, Poland, Portugal and Romania also had a significant share of posted workers from outside the EU, in particular from countries sharing a border with the EU.
Despite the untapped potential in the area of services, all the previous indicators and examples have shown that the EU Single Market has made significant progress over the last 30 years. The unique level of economic integration among EU Member States, especially in the areas of trade in goods, created one of the largest integrated markets in the world and an excellent platform for EU companies to remain competitive beyond the EU borders. The next challenge is to match this level of integration also in services, a critically important ingredient for Europe’s future competitiveness. In almost all modes of supply, there is scope for further integration of the EU services markets.
The good news is that the recently adopted post-2030 long-term competitiveness strategy has established ambitious KPIs that could significantly boost cross-border services trade within the Single Market. By then, the Single Market would approach its 40th anniversary. Time will tell if “40 is the new 30”.
Lucian Cernat is Head of Global Regulatory Cooperation and International Procurement Negotiations, DG TRADE. The views expressed herein are those of the author and do not represent an official position by the European Commission.