Published
EU-Russia Trade Since the Start of the War – Recoupling for Some, Expansion for Others
By: Vanika Sharma Renata Zilli
Subjects: European Union Russia & Eurasia

Russia’s invasion of Ukraine in February 2022 was met with calls for economically alienating Russia. Countries were encouraged to impose sanctions, reduce trade with Russia, and offset any economic and resource dependencies. One year after the invasion, this blog explores changes in the trade values between EU and Russia, and a shift in EU’s economic alliances. There have been significant changes in the trade between EU and Russia over the past year, but the results are not as dramatic as they were initially thought to be. These changes have been driven by different EU member states and across a variety of sectors, resulting in important consequences for the future of EU-Russia trade.
Breaking trade ties with Russia has not proven easy for the world. According to estimates by the New York Times, Russia’s trade volumes with non-EU countries such as Brazil, Japan, China, India, and Turkey has increased. Average monthly trade volume after the invasion saw the largest increase with India by 310% followed by Turkey by 198%, compared to the 2017-2021 monthly average. Exports to Russia by China and Turkey increased after the invasion, while exports from Russia increased to non-EU countries such as India, Turkey, Brazil, China, and Japan (in descending order). This is not a good sign given the increasing aggression Russia has shown in Ukraine.
Despite the vast amount of analysis and views produced on the invasion, there is still no consensus on how effective sanctions have been in isolating the Russian economy. In February 2022, there were 10,971 sanctions in place on Russia in a variety of sectors such as finance, trade, vessels/aircraft, and on specific individuals. In spite of these numbers, there are some who argue that these stream of sanctions have proven to be underwhelming.
Russia has also been able to compensate for many of its losses resulting from the war, sanctions, and loss of trade partners, with the help of new trading partners, increased prices of oil and gas, and a strengthening of the value of the Ruble. However, Russia has not been able to manage the full economic fallout of the sanctions. There are sectors where Russia’s economy has suffered serious injury. Take the case of the cargo industry. The Port of St. Petersburg experienced an 85% drop in container volumes versus the previous year. This is a major shock for freight and logistics companies. Similarly, although most sanctions target high-technology goods to diminish Russia’s military capacities, the IT and microchip embargo extends to sectors such as the automotive industry whose output has reportedly plummeted to levels not seen since the Soviet era.
EU trade with Russia
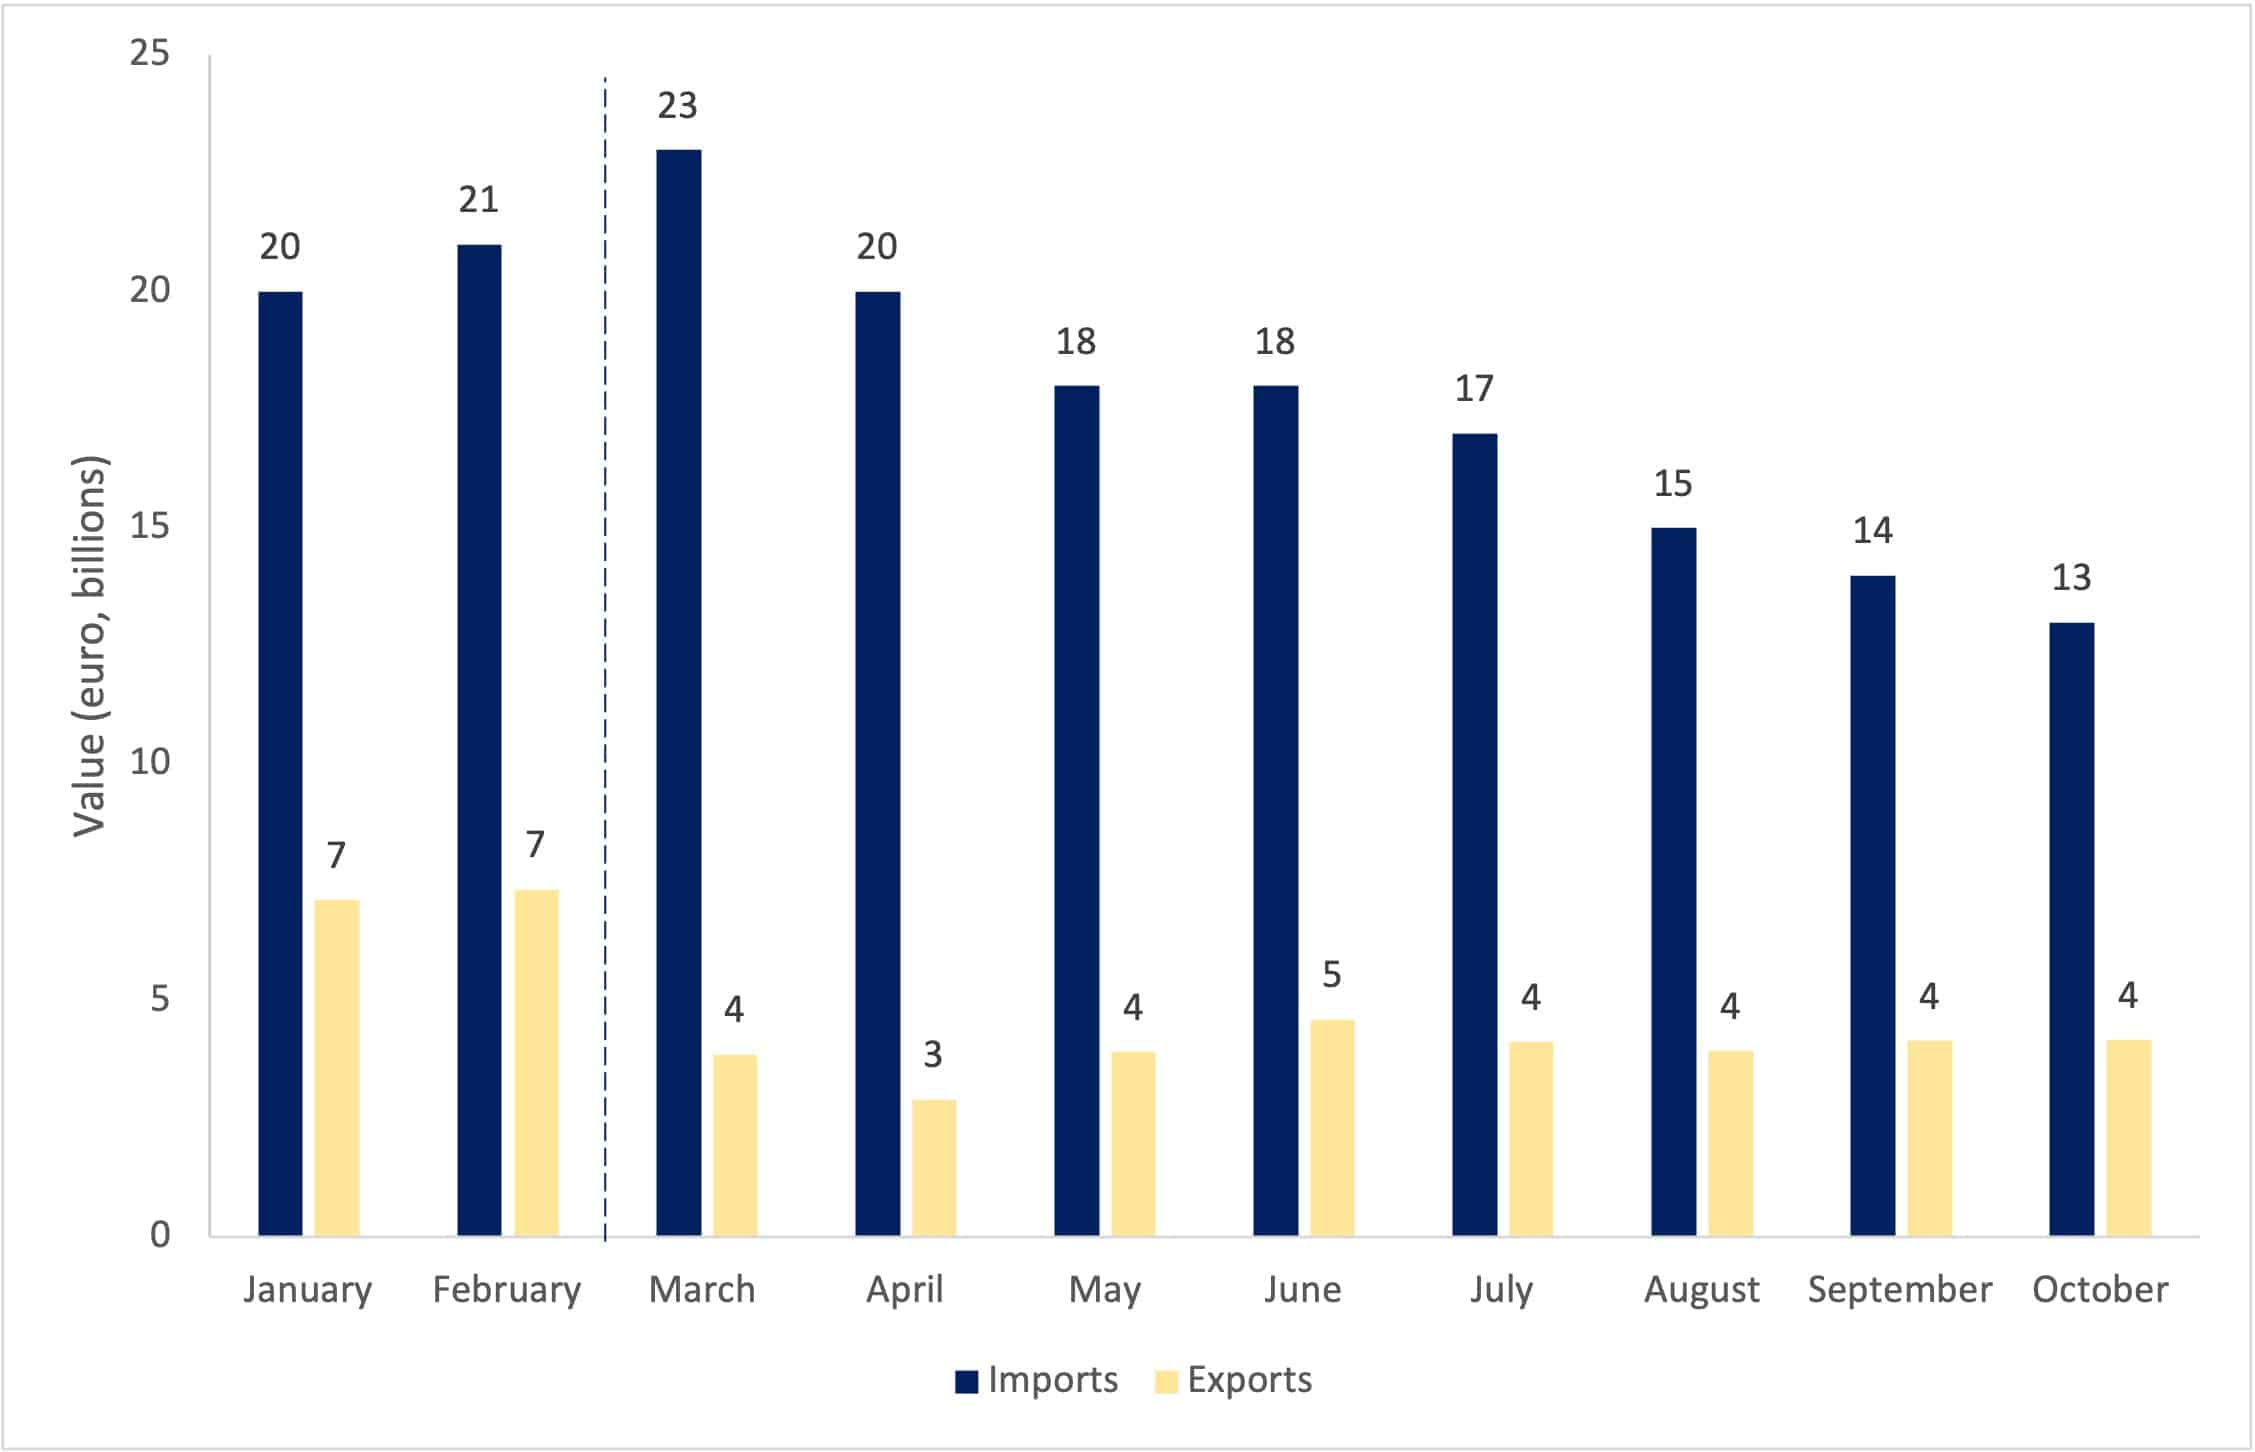
The EU has had an important role to play in the economic retaliation against Russia. Not only has the EU been an active advocate for imposing sanctions on Russia, but the EU itself has imposed over 5,000 of the 10,971 economic sanctions currently in place on Russia. Sanctions, uncertainty and the pressure to stop economic exchanges with Russia has led to a significant fall in EU-Russia bilateral trade. EU imports from Russia between January 2022 and October 2022 (latest available data) have fallen by 36%, from €20 billion to €13 billion. At the same time, EU exports to Russia have decreased by 41% from €7 billion to €4 billion. (Figure 1)
However, despite the pressure to arrest economic relations, trade between the EU and Russia has not grounded to a halt. Several industries were responsible for slowing down the pace of economic disintegration between the two regions. EU imports from Russia of product categories such as pharmaceuticals, metals such as nickel, aluminum, and zinc, arms and ammunitions, and textiles such as silk, cotton, and leather, increased between January 2022 and October 2022. EU exports to Russia also increased in a variety of sectors, but most prominently in the pharmaceutical sector.
Figure 1: EU monthly import and export values from Russia (2022)

Source: Eurostat, Author’s Calculations
Even though the EU has been united in its stance to impose economic sanctions against Russia, there is significant variation in the degree to which EU economies have managed to reduce their trade with Russia. Firstly, not all EU countries have seen an equal decrease in their trade with Russia. In fact, imports from Russia increased for some EU member states such as Austria, Bulgaria, Greece, Croatia, Hungary, Luxembourg, and Slovenia. For these countries, imports from Russia increased in product categories such as pharmaceuticals, miscellaneous chemical products, fuels and oils, fertilizers, aluminium and its products, optical, medical, and surgical instruments, and electric machinery. Hungary had the largest increase in imports from Russia between January 2022 and October 2022 of €1 billion, followed by Austria of €260 million. Other EU member states significantly reduced their imports from Russia. For instance, Germany, Italy, and the Netherlands reduced imports from Russia by more than €1.5 billion each.
Exports to Russia also increased for some EU member countries such as Bulgaria, Estonia, Greece, Croatia, Ireland, Lithuania, Latvia, and Slovenia between the same period. Similar to imports, several EU member states saw significant reductions in their exports to Russia. For instance, Germany recorded a decrease of €1 billion in its exports to Russia over the 10-month period. Germany was followed by France and the Netherlands[1], that saw a decrease in exports to Russia by close to €300 million.
The map below represents the change in trade between EU member countries and Russia between January and October 2022. Countries in red increased trade with Russia between this period, while countries in blue decreased trade with Russia. Although countries such as Greece, Hungary, Germany, the Netherlands, and Italy are on the extreme ends of the spectrum in terms of change in trade values, changes by other member states with Russia have not been very large. Barring these five countries, the change in trade values ranged between an increase by €188 million and a decrease by €1.02 billion which represents a change of only 0.08% and 0.4% with respect to the total trade between the EU and Russia.
Figure 2: Change in Trade with Russia (January to October 2022, million euros)

Source: Eurostat, Author’s Calculations
The varied trade responses of European member states towards Russia are also reflected in the countries’ political stance towards the aggressor. For instance, on multiple occasions, the Hungarian Prime Minister Viktor Orban, known for being close to the Kremlin, has called for an end to the sanctions on Russia. At a time when Europe is preparing for a new round of coercive measures against Russia, Orban has made promises to veto any future sanctions on Russia’s nuclear industry. Russia is a global supplier of nuclear material and technology and almost 50% percent of Hungary’s electricity needs are sourced from nuclear energy. These clashing political alliances among Member States have proven to be in detriment of Europe’s ability to act in a time of crisis.
EU trade dependency on Russia
This fragmentation in EU member states’ responses is not the only reason decoupling with Russia has been difficult for the EU. Both EU and Russia are large economies important for global trade, they share strong cultural ties, and both are global powers that are strategically important to each other. For instance, Russia is the primary supplier of rare gases such as krypton, neon, and xenon, crucial for the production of semiconductors.[2] In 2021, the EU sourced half of its rare gases imports from Ukraine and Russia.[3] So far, the EU has been able to mitigate disruptions in the supply chain as a result developing inventory reserves, a process that can be traced back to 2014 when Russia invaded Crimea. However, the limited availability of alternative global producers and the growing demand driven by the digitalization of the economy, make rare gases used for the production of microchips a commodity of strategic priority for Europe.
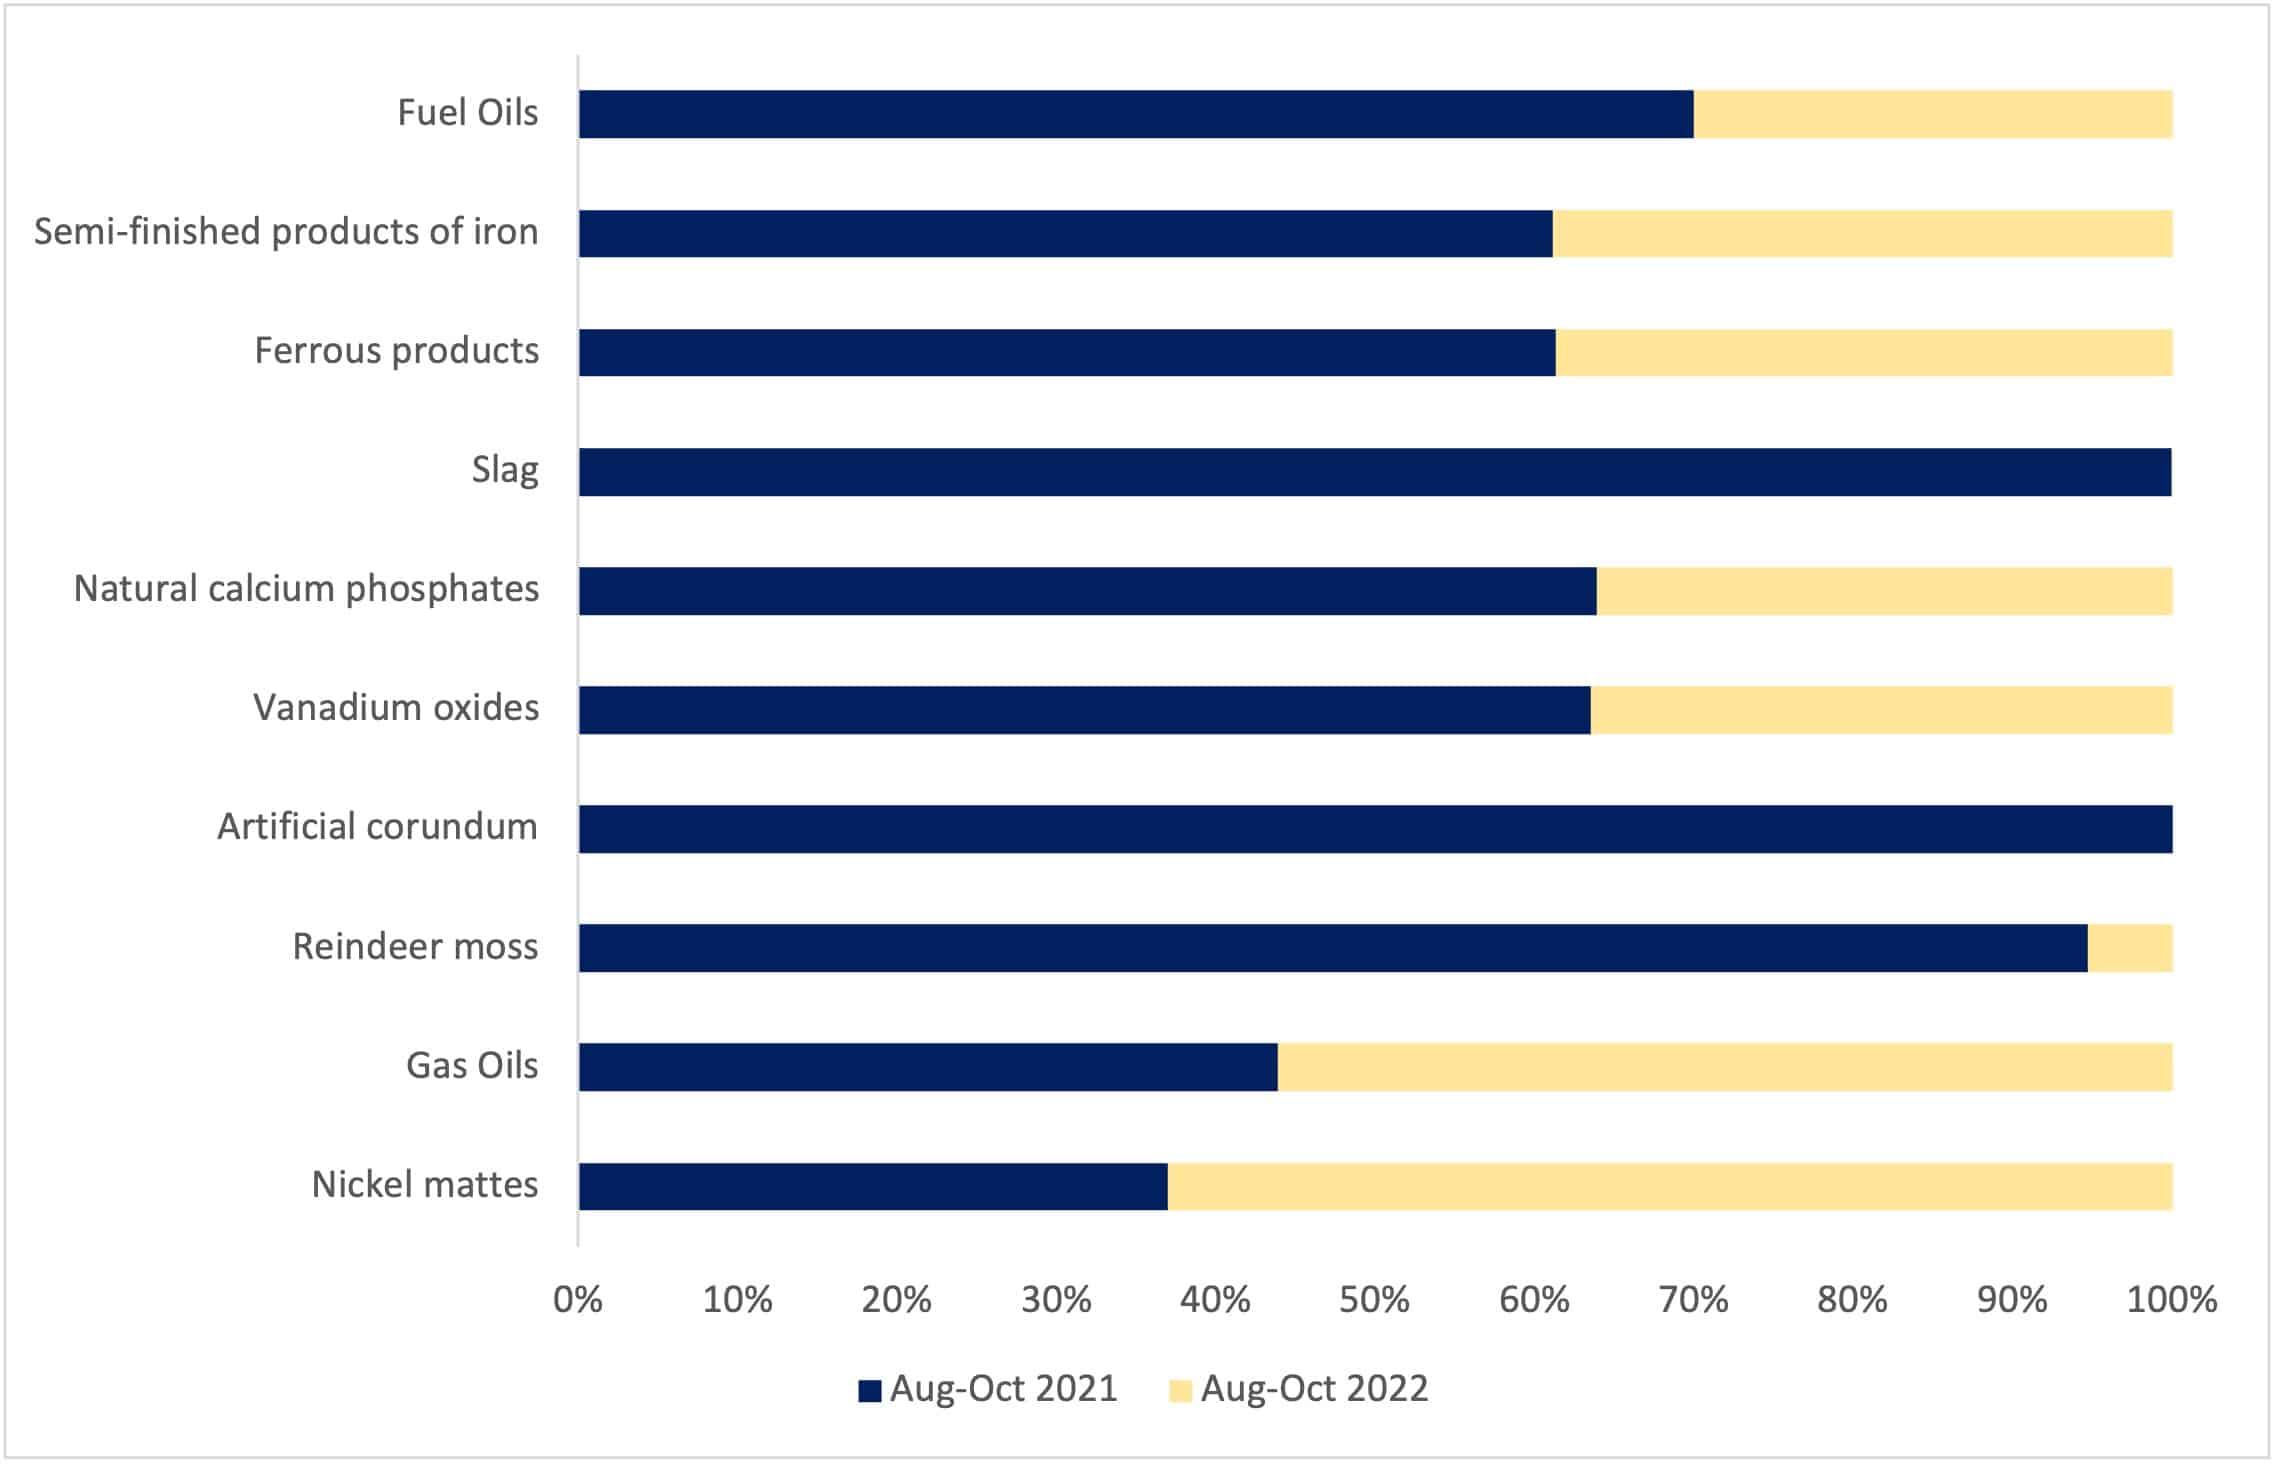
In addition to this, as identified in our last ECIPE blog, “Russia’s Import Dependency Problem,” there were several strategic trade dependencies between EU and Russia in 2021. These dependencies are also contributing to making this decoupling process harder for the EU. However, in 2022, the EU has made efforts to reduce these dependencies on Russia. As it can be seen in Figure 3, there was a fall in the value of EU imports from Russia in 8 out of the 10 product categories between August to October 2022 and August to October 2021. This included a fall of 37% in ferrous products, of 43% in Vanadium Oxide imports, and a decrease of 57% in fuel oils of petroleum from Russia. Imports of gas oils, however increased by 28%, and of nickel mattes increased by 71% over the same period.
Figure 3: EU imports of dependent products from Russia (August-October 2021 and August-October 2022)

Source: Eurostat, Author’s Calculations
At the same time, the EU has also seen an increase in the number of suppliers for some of these dependent products after the invasion. Particularly, in order to reduce its pain points with Russia in gas and fuel imports, between January and October 2022, imports of gas oils increased from countries such as Saudi Arabia and Egypt, while imports of fuel oils increased from countries such as United Arab Emirates, Jordan, and Iraq.
In short, trade between the EU and Russia has decreased since the invasion of Ukraine. Yet, the differences across EU members states tell a more nuanced story. Not all member states have been able to reduce trade with Russia; in fact some states saw an increase in trade values during the same period. Another important area of change has been the reduction in trade dependencies of the EU on Russia. Imports by the EU in 8 out of 10 product categories fell in cumulative trade for August to October 2022 compared to their cumulative trade values in August to October 2021. Decoupling has been difficult for the EU and Russia as both are large players in the global economy. Many important changes have taken place over the last year, and yet it is still too soon to sketch out what these changes mean for the future of EU-Russia relations, but also for the future of global trade.
[1] Changes in trade between the Netherlands and Russia may be biased due to the Rotterdam Effect and should be analysed with caution.
[2] Part of the complexity of assessing the impact of this small in trade values but large in its strategic dependency is because rare gasses are not available in trade data at the material level, and are aggregated in the HS code 280429 “Rare gases and other than argon”.
[3] Before the war both countries sat within the same value chain of noble gasses though in different stages of the process. Russian crude neon is purified in Ukraine, and about half of the world’s semiconductor-neon is exported by two Ukraine companies.