Published
The Economic Value of Standard Essential Patents and the Costs of the Commission’s SEPs proposal
By: Oscar Guinea
Subjects: European Union Trade and IP

The European Commission’s proposal to reform Standard Essential Patents (SEPs) puts SEP holders against SEP implementers. The logic is simple: since the economic contribution of implementers is larger than the economic contribution of holders, it is right to redress the balance in favour of implementers. For the European Commission it is a numbers game: 31 SEP holders against 3,800 firms that are likely to use SEPs in their products. The Commission Impact Assessment includes a cost-benefit analysis (CBA) in which Finland and Sweden will be the biggest losers. These two countries are the home of the two largest SEP holders: Nokia and Ericsson. The two companies employed in 2021 around 190,000 people, sold goods and services for €45 billion, and received a total of €2.2 billion from licensing revenues for smartphones.
The underlying assumption in the Commission’s proposal is that SEP holders have too much market power and they are using it to the detriment of SEP implementers. The Commission believes that because digitalisation creates new downstream production and a growing number of EU SEP implementers – from Internet-of-Things (IoT) to connected vehicles – a reallocation of power in favour of implementers at the expense of holders will have a net positive effect on EU output and jobs. This is wrong and misguided.
SEP reform will have broader and more profound consequences than just hurting two EU companies – even if these are two of Europe’s most successful high-tech companies. Nor should the political economy of SEP be reduced to a narrow CBA on output and jobs. In essence, the Commission analysis is flawed because it failed to grapple with the most basic but crucial question: what is the economic value of standard essential patents?
The answer to this question cannot be a count of the number of SEP holders and implementers and their respective turnover and employment figures. Take 5G and 6G as examples: their technological foundations rest on SEPs, technical standards, and the willingness of upstream developers to contribute technology to the standard. The societal and economic value of these technologies will be vastly higher than the R&D investments behind them or the revenues captured by patent holders. In other words, SEPs help generate these and other technologies that are used by many to create economic and social value while only a tiny fraction of the value generated is covered by the revenues of the contributors.
Of course, SEPs are not the only reason why we have these new technologies, but their contribution should not be underestimated either. SEPs and technical standards have enabled smooth and efficient markets for technologies and innovation, promoting more investment, competition and specialisation. SEPs contribution arises from the economic effects associated with technical standards: chief among them, compatibility. Compatibility enables ‘network effects’ where firms and consumers prefer to choose a system that is widely used by others. These network effects incentivise suppliers to conform with the prevailing standard and find their position in the supply chain. When compatibility is achieved, companies continue working on developing standards which help the industry to provide new innovations that were not available before.
These innovations will be crucial for climate change, health care, education and transport where demand for digital technologies will increase. The EU and EU member states’ plans on these policy areas will require significant amounts of new R&D. Investments are needed in network infrastructure but also on upstream R&D and technology generation. Thanks to SEPs, producers of technology know that, when implemented, their work will be protected and rewarded.
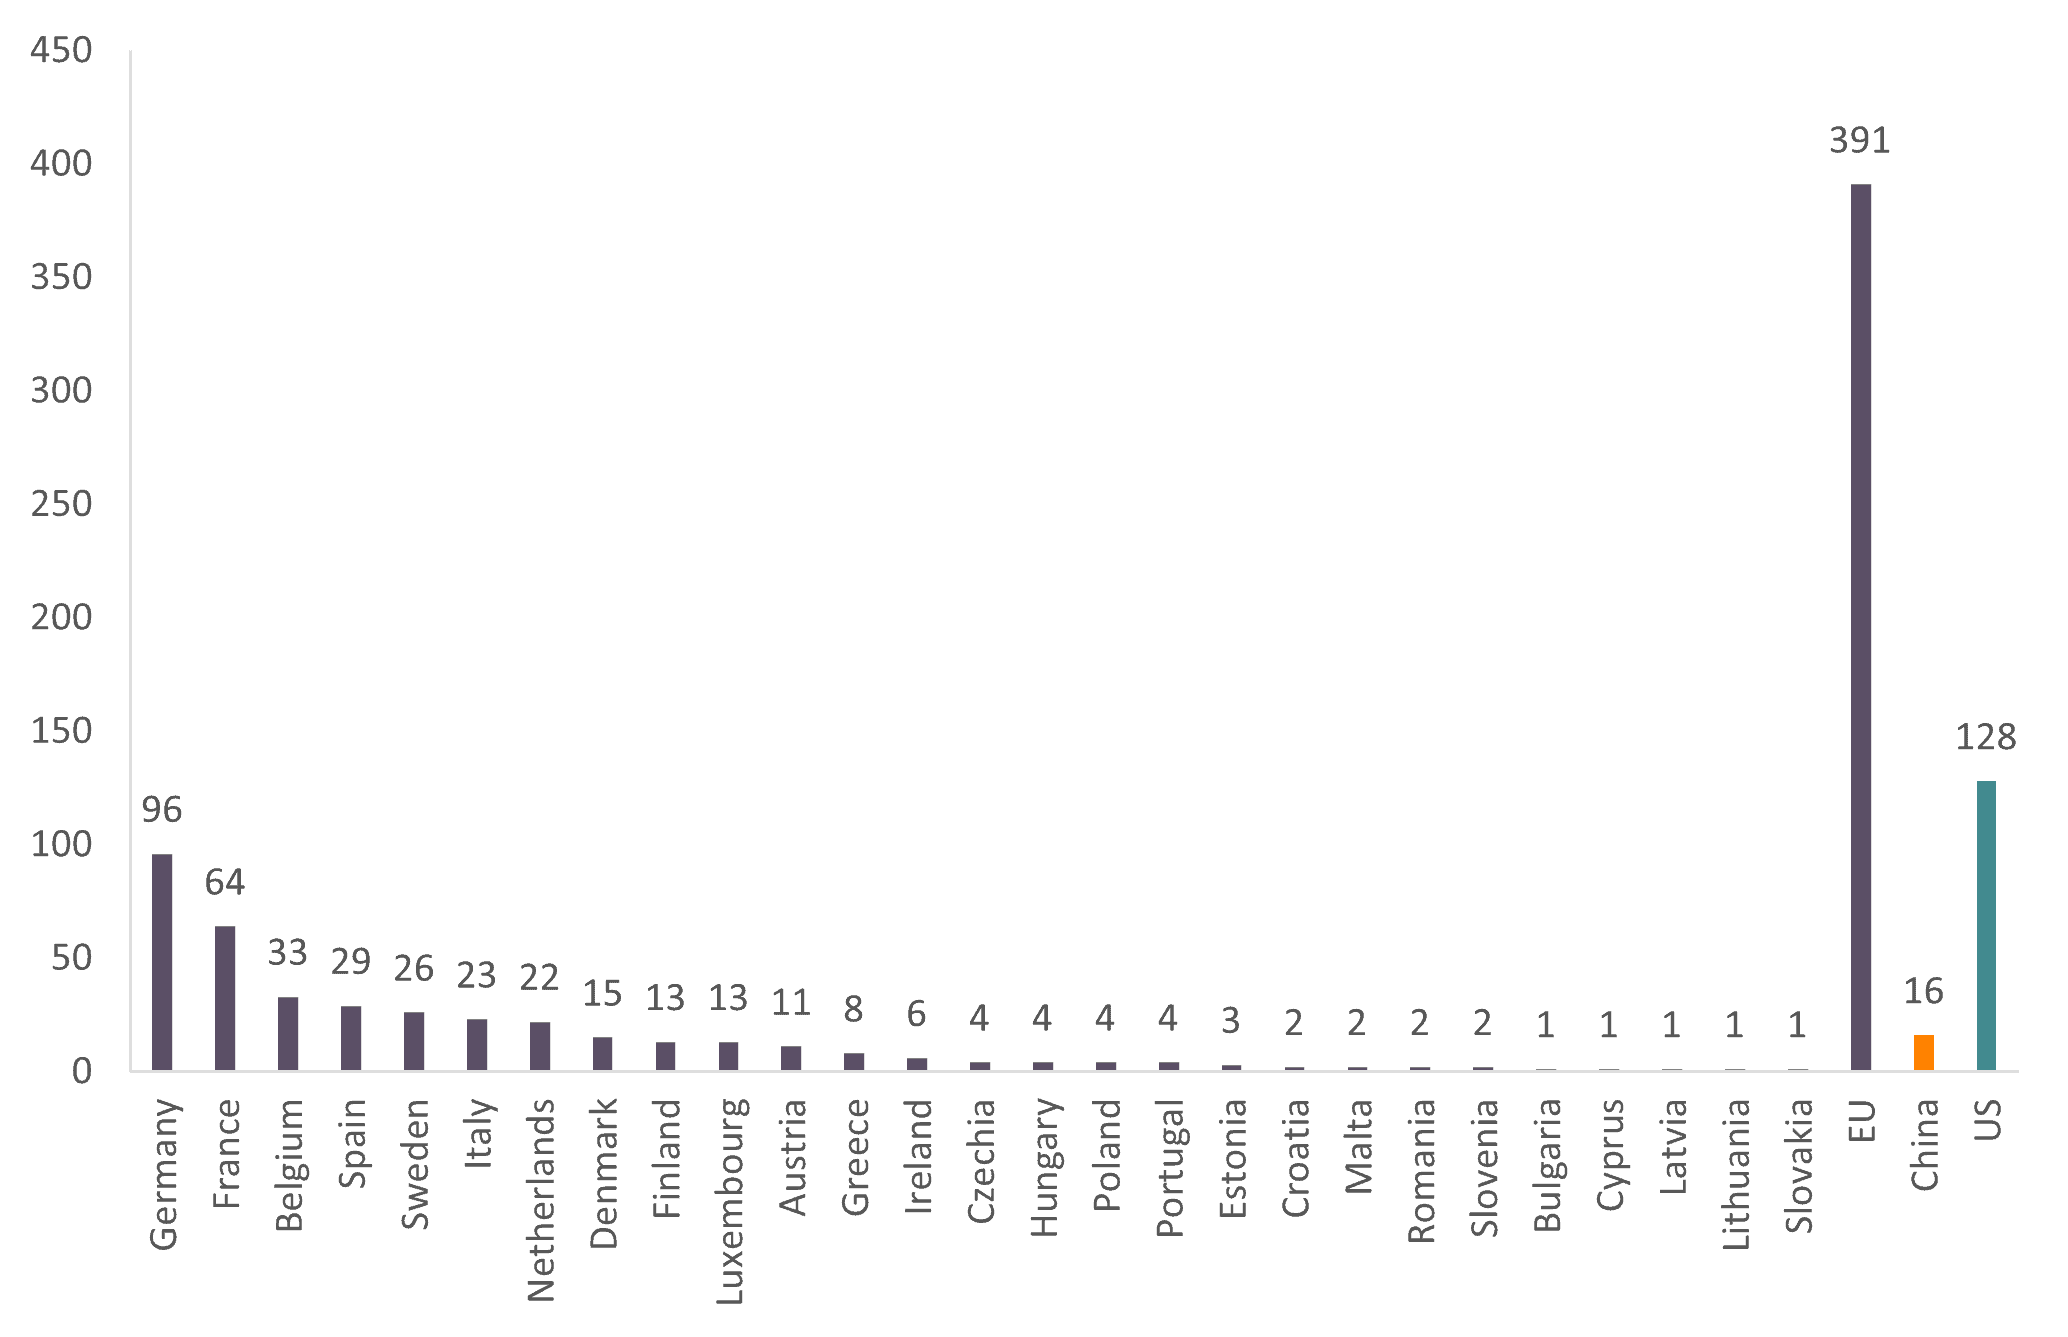
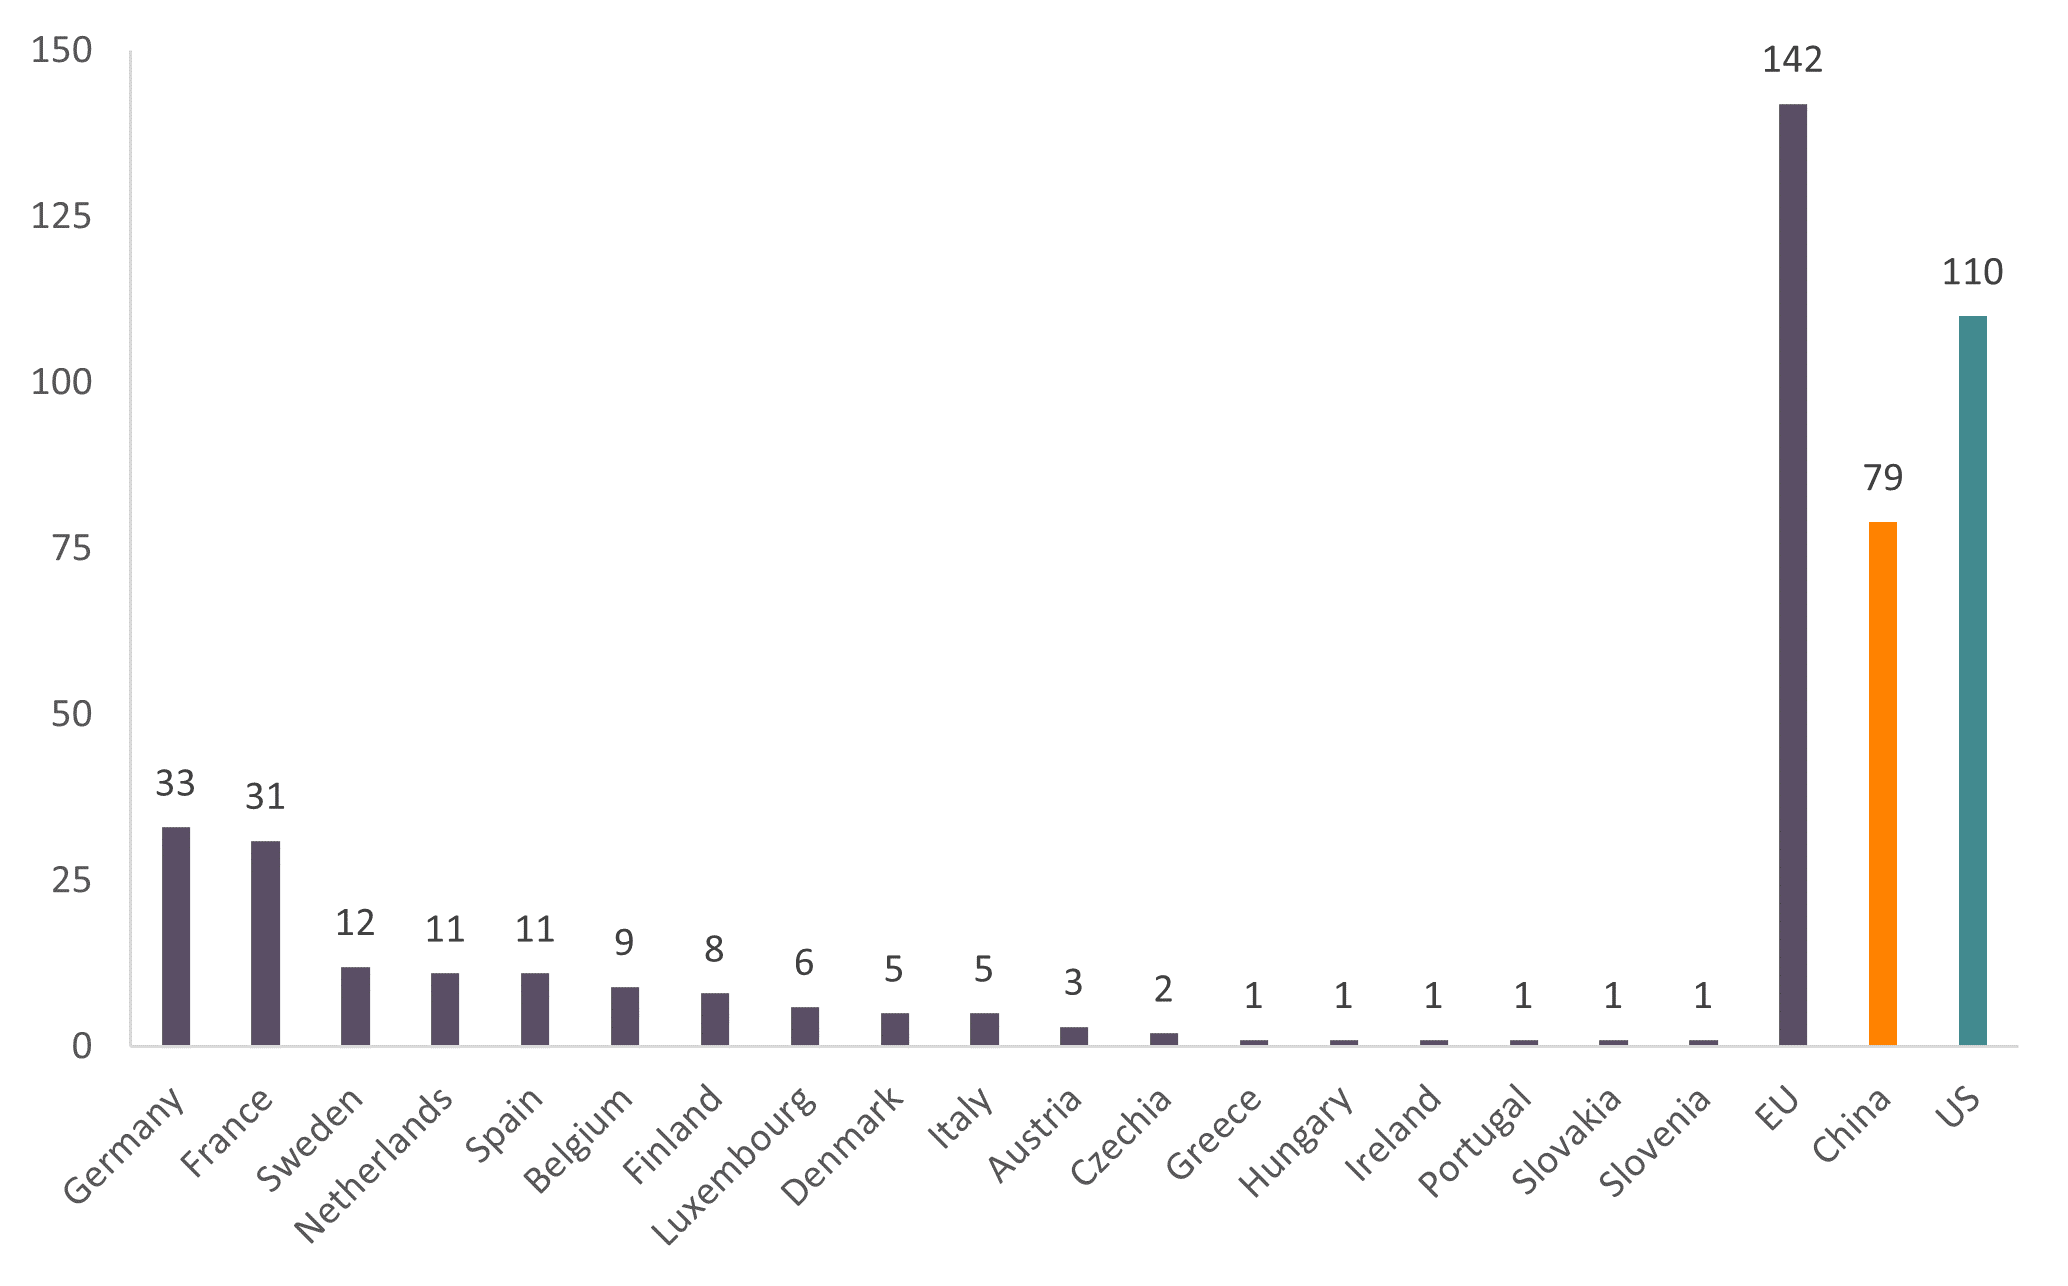
Therefore, a critical effect of technical standards and SEPs is the emergence of more specialised R&D firms. This kind of company emerges because innovations can be licensed, and their technologies can be applied to many downstream firms and products. As mentioned, the European Commission Impact Assessment shows that there are relatively few EU companies with more than 10 SEPs, but in its fixation on creating a narrative that pits SEP holders against implementers, the European Commission failed to recognise that many companies are technology users and producers simultaneously. This is particularly true in the ICT sector which is also the main source of SEPs. The next two Figures present the number of companies headquartered in the EU, China and the U.S. that are members of the European Telecommunications Standards Institute (ETSI), a European Development Standardisation Organisations and the 3rd Generation Partnership Project (3GPP) a standards organisation that develops the technical standards behind 5G. Firms that are members of these two organisations are at the forefront of technology in their fields.
The two figures help us understand the technology landscape and the EU’s position in it. Firstly, they display a distribution of companies at the technological frontier which is much more even than the data presented in the European Commission’s Impact Assessment where Finland and Sweden held 88 percent of SEP patents. Germany and France represented 41 percent of the EU’s ETSI members and 45 percent of the EU’s 3GPP. Other EU countries such as Belgium, Spain, Italy, or the Netherlands also have a sizable number of firms as members of ETSI and 3GPP.
Secondly, the data shows that EU’s companies are not bystanders in the technology race but frontrunners. Half of ETSI membership is made of European companies. France and Germany together have more ETSI members than the U.S. (160 vs. 128). In contrast, only 16 Chinese companies are members of ETSI, representing 2 percent of ETSI’s total membership. At the 3GPP, 28 percent of its members are EU companies, a higher percentage than the U.S. (21 percent) and China (15 percent). Other sources point to similar conclusions. According to the OECD, the EU is the world’s largest exporter of computer and telecommunications services, ahead of the U.S., China, and India. In 2021, European exports of computer services reached a trade surplus of 129 billion euros.
Figure 1: Number of firms belonging to ETSI

Source: ETSI. Author’s calculations.
Figure 2: Number of firms belonging to 3GPP

Source: 3GPP. Author’s calculations.
The economic effects of SEPs and technical standards influence the development of entire industries. Technical standards encourage the creation of markets because thanks to standards, SEPs and licensing, companies can work at arm’s length rather than having to integrate different activities within the firm. A crucial benefit of the system is that it encourages innovation. In a previous report, we showed that the ICT sector was the leader in patent applications to the European Patent Office (EPO) with more than nine thousand patents filed. Medical technologies, pharmaceuticals, chemicals, machinery, and motor vehicles had considerably lower numbers.
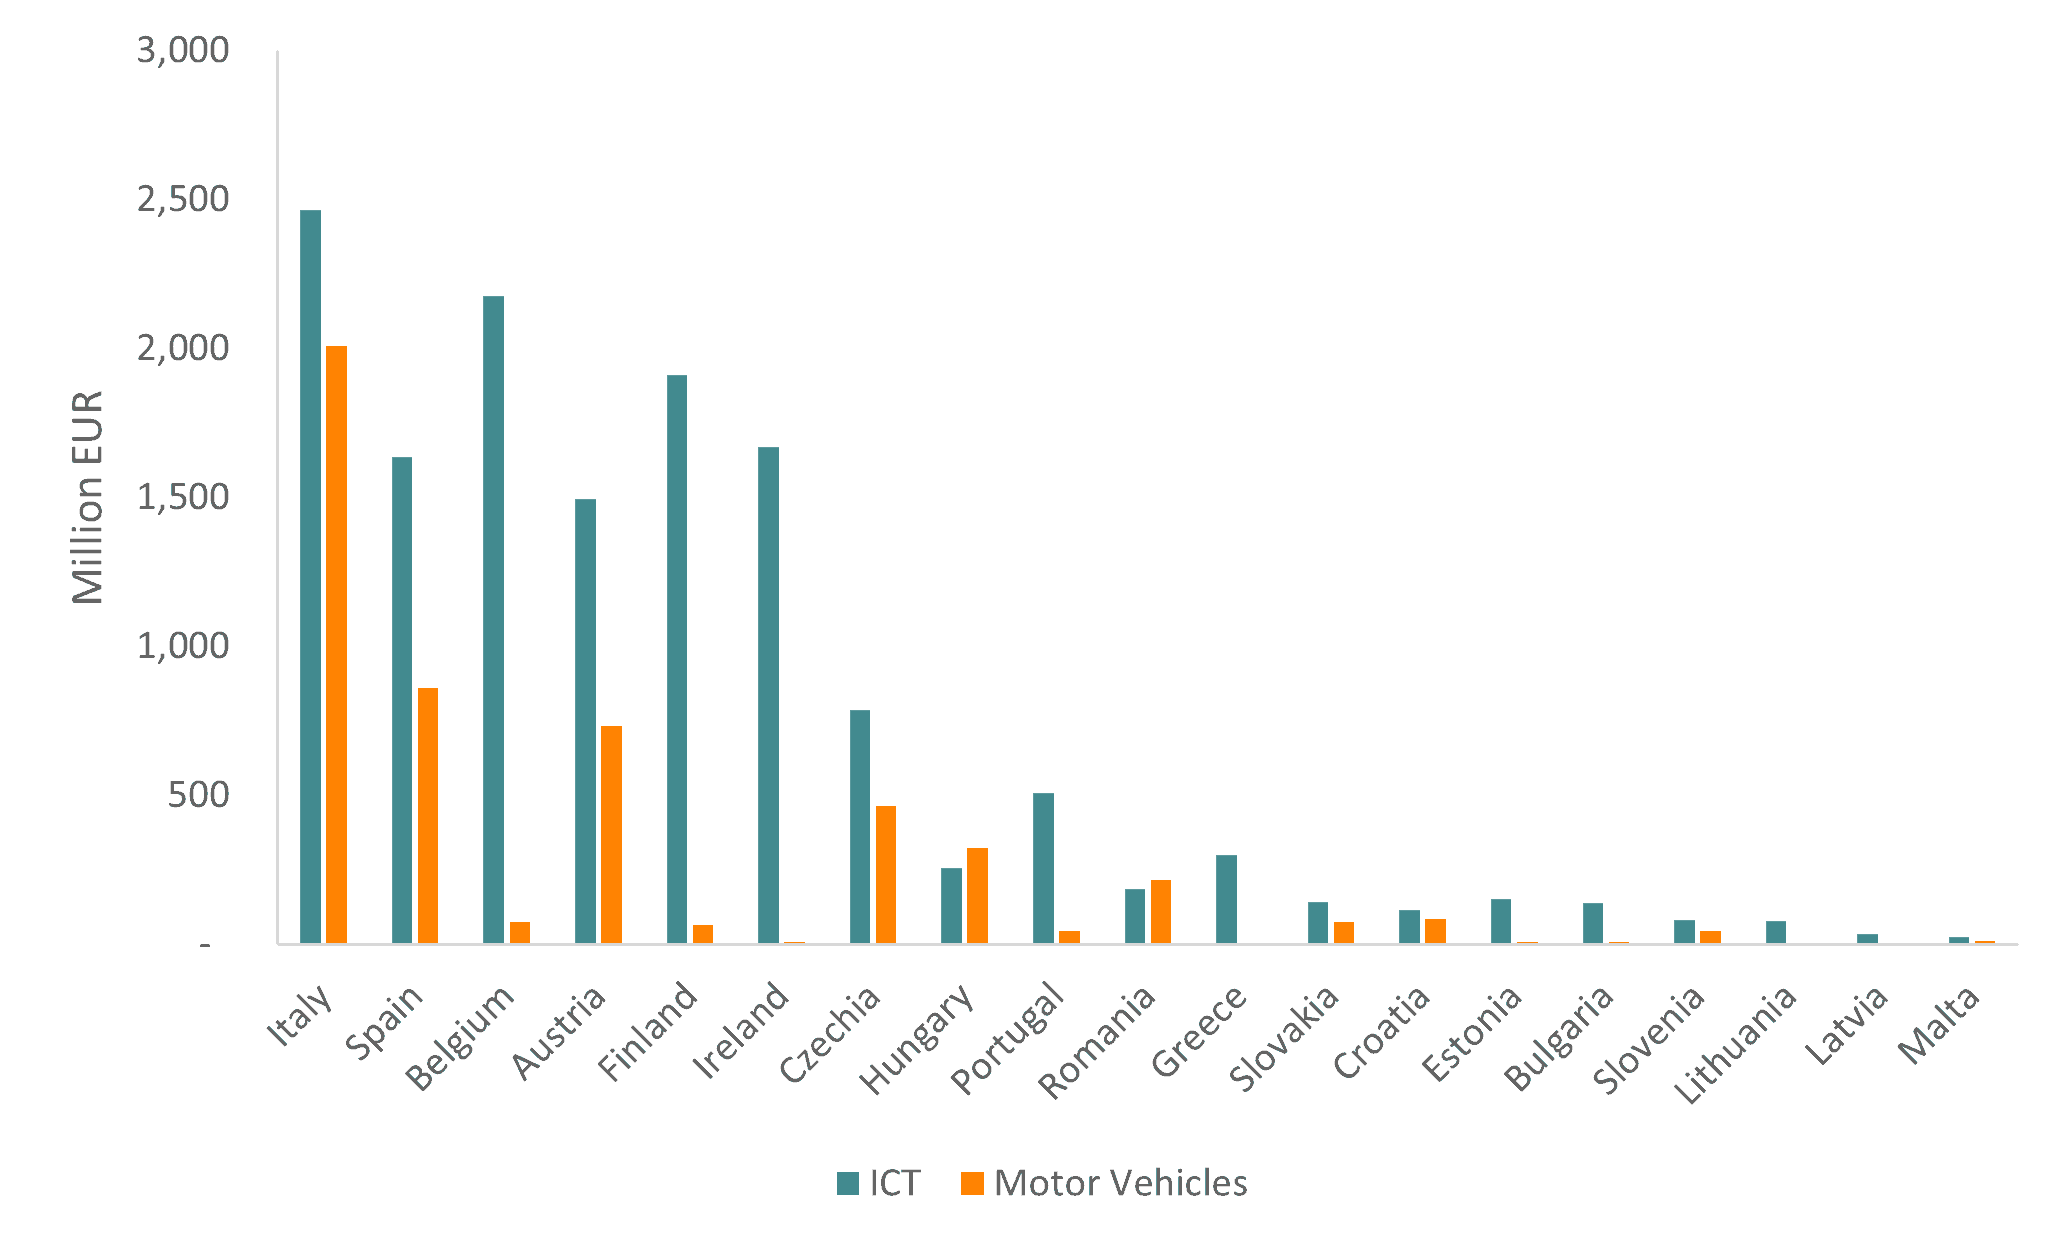
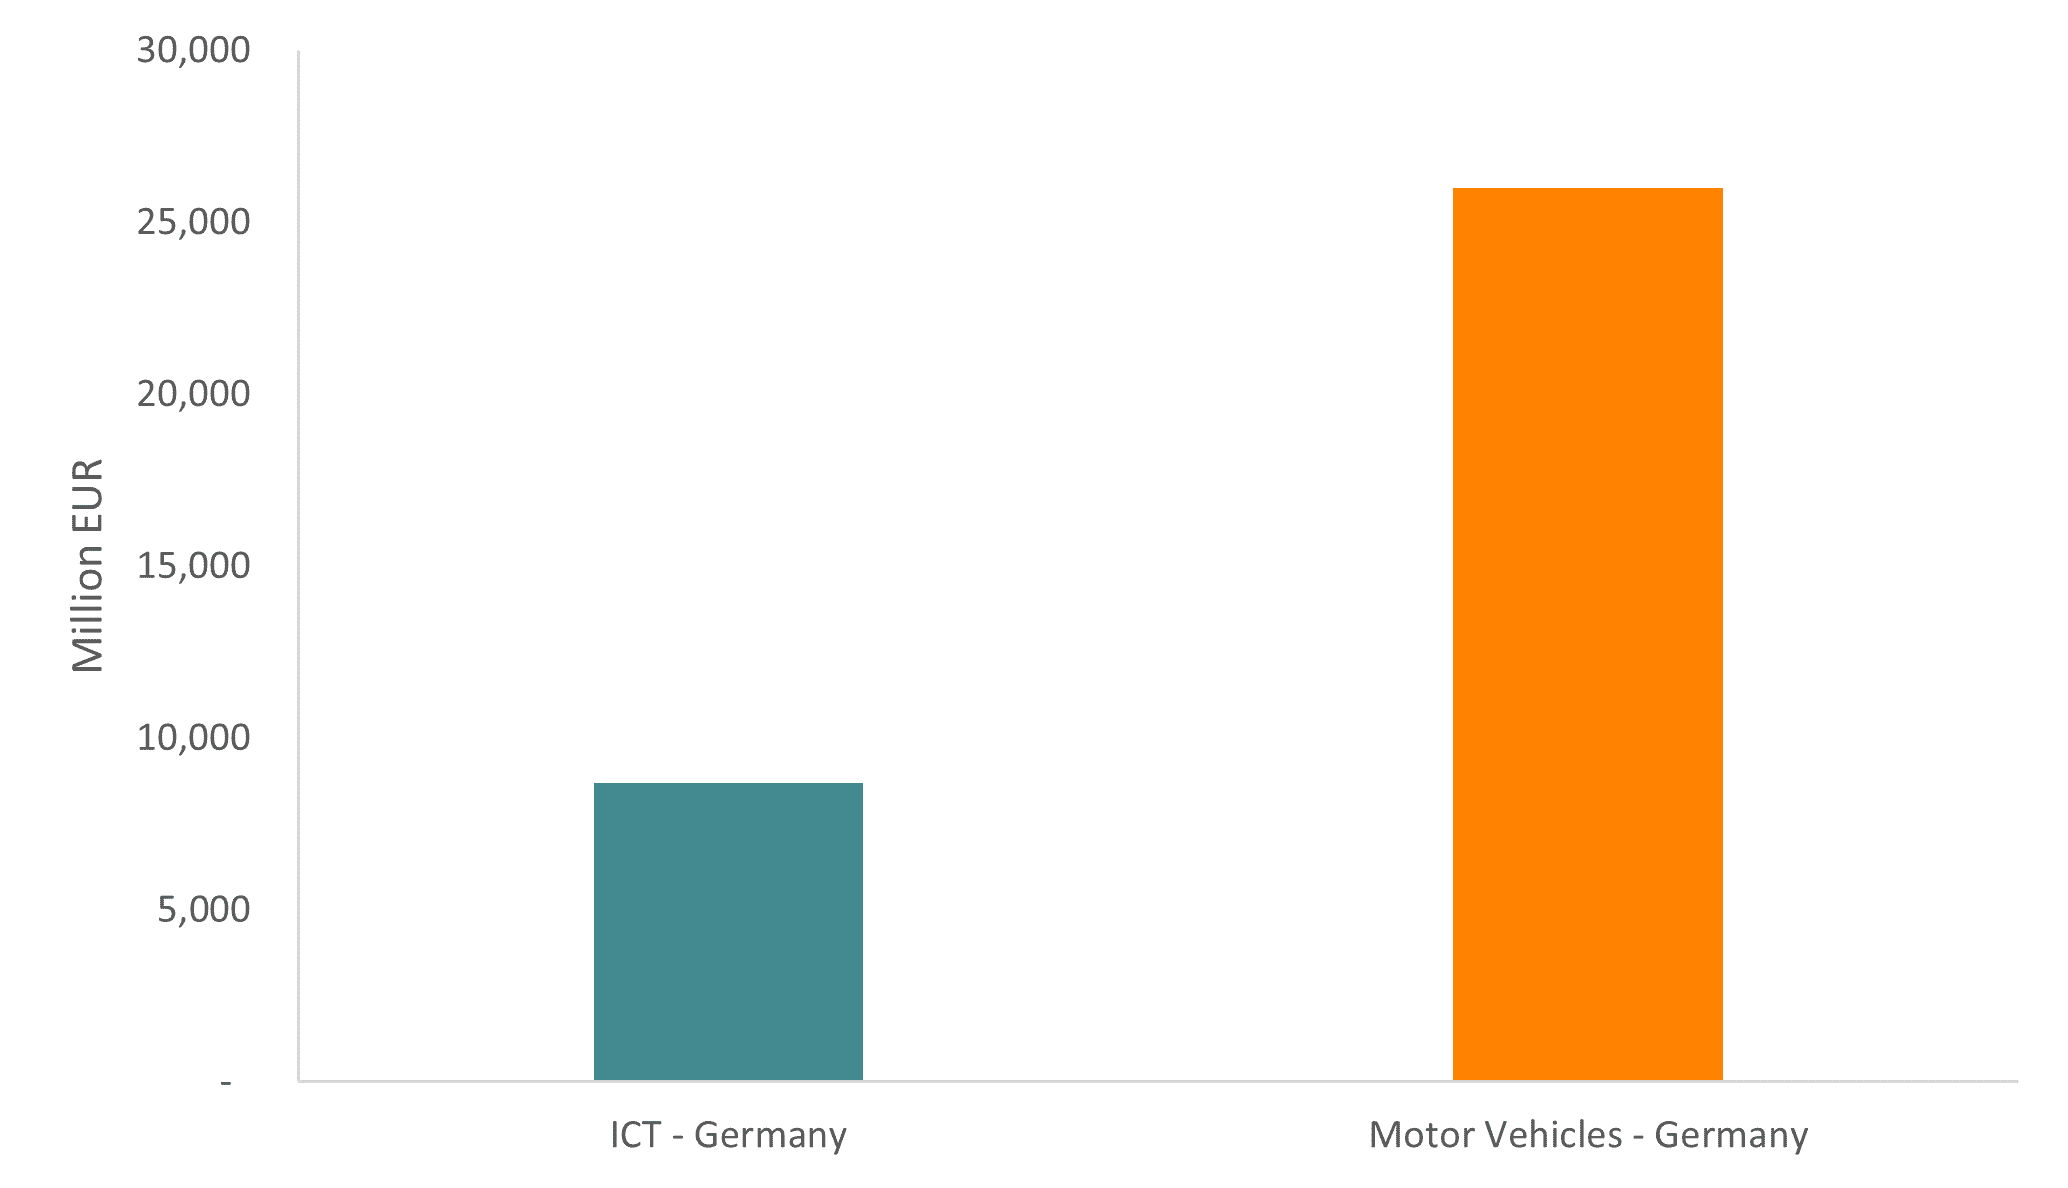
Higher IP activity generally comes as a result of a larger spending in R&D. However, what makes ICT special is that, thanks to technical standards and SEPs, R&D spending is done by the entire ecosystem and not just by a few innovative but vertically integrated companies. The next figure presents business spending on R&D in ICT and the motor vehicles industry – two of the largest sources of R&D spending in the EU. The data show that R&D in motor vehicles was boosted by the significant spending done in Germany (Figure 4), mostly by the large car manufacturers, but R&D in ICT was bigger than motor vehicles across all the other member states, including some of the EU most important car exporters such as Spain, Slovakia or Czechia (Figure 3). Technical standards can partly explain this outcome: because standards reduce information costs and trade barriers, they support a more uniform distribution of R&D activities in which firms, across all EU member states, can participate.
Figure 3: Business spending on R&D across ICT and motor vehicles in 2021

Source: Eurostat. Author’s calculations. Denmark, France, Luxembourg, the Netherlands, Cyprus and Sweden not included due to missing data. ICT business spending on R&D for Ireland refers to 2019 and for Latvia for 2020.
Figure 4: German business spending on R&D across ICT and motor vehicles in 2021

Source: Eurostat. Author’s calculations.
The product compatibility brough by technical standards and SEPs to the ICT sector not only contributed to market specialisation but also to a level of openness that sets it apart from other industries. In 2021, there were 37,000 firms working in the European ICT manufacturing sector, and almost seven out of ten were involved in international trade. In comparison, only 22 percent of EU manufacturing firms exported goods to other countries or bought their inputs from abroad. Trade intensity, measured as the sum of imports and exports as a proportion of turnover, in the EU ICT sector was much larger than in chemicals, machinery or motor vehicles.
These observations get to the core of two of the European Commission’s greatest misunderstandings in the analysis that accompanied the proposal for SEP reform: treating the EU as an isolated entity, and as a result of that, excluding the rest of the world from the analysis. As noted in a previous paper, the European Commission believes that, on balance, the benefits of the proposal outweigh the costs because there are many more European implementers than holders. This is true at the European level, but the European Commission’s logic is deeply flawed when the same reasoning is applied at the global level.
In the case of many ICT products, the majority of SEP implementers are located outside the EU, while the SEP holders are important investors and companies in the EU. In smartphones, IoT devices and even cars, the majority of the production is headquartered in the Asia-Pacific region not in the EU. Even though it is difficult to estimate the distribution of different incomes within a sector, the data suggest that in the value-chain of these ICT goods, Europe’s strength lies in R&D activities rather than in production, which brings tangible benefits in the form of royalties and licensing payments. In 2016, it was estimated that the mobile telecommunication industry generated patent royalty of USD 14.2 billion.
In summary, the EU is a R&D powerhouse for many of the technologies protected under SEPs and since most of the global production of the goods using these technologies is done outside Europe, the EU is a net exporter of innovation and a receiver of revenues from the licensing of these technologies. It is very odd that the Commission is proposing a regime that effectively will reduce license revenues when most of these revenues come from other regions, undermining EU’s competitiveness.
The European Commission proposal for SEP reform relies on an agenda of redistribution in favour of SEP implementers, not growth in value added for the economy. For officials and political decision-makers, the big prize with technical standards and the SEP system is that it generates more value added to the economy. But growing margins for SEP implementers do not entail growth in value added. Because value-added is positively correlated with openness and market specialisation – enabled by technical standards and SEPs – the European ICT sectors have higher value-added, productivity and wages than many other European industries, including automotives.
This is why understanding the broader economic value of SEPs is important for any policy formulation. The data shows that many EU companies are technological leaders in their fields. Therefore, weakening SEPs and the system of protection and rewards behind technical standards will be detrimental to all EU companies which are part and parcel of the system that produces technical standards, which are many and distributed across all EU member states.
The long-term effect of SEP reform is that income and profits of upstream generators of technology would shrink and reduce their capacity to invest in R&D. The effect would be to push technology generation closer to downstream corporate users, which would have a negative impact on the high levels of specialisation in the ICT value chain and on the chances of EU countries to complete the digital and energy transition.
One response to “The Economic Value of Standard Essential Patents and the Costs of the Commission’s SEPs proposal”