Standing Up for Competition: Market Concentration, Regulation, and Europe’s Quest for a New Industrial Policy
Published By: Oscar Guinea Fredrik Erixon
Subjects: EU Single Market European Union
Summary
After the failed merger of Alstom and Siemens – the two giants of Europe´s railway manufacturing sector – the French and the German governments presented a manifesto with a set of radical proposals designed to reshape EU industrial and competition policy. In an article addressed to all European citizens, the President of France, Emmanuel Macron, urged for reform of EU competition policy, to protect Europe from foreign competition[1]. MEP Guy Verhofstadt, the leader of the European liberals, supports similar claims that Europeans cannot compete with Chinese or American firms[2]. One of the Franco-German suggestions would empower the European Council to veto European Commission decisions on competition policy. French and German Ministers argue that Europe´s competitiveness in manufacturing is in decline. Somehow weakening EU competition policy, the manifesto claims, will strengthen Europe´s competitiveness. This argument is wrong. To be competitive, European firms need more not less competition. Measures to promote market competition in Europe should be at the front and centre of any future industrial policy. Unfortunately, the evidence shows that market competition in Europe is not rising but declining.
Since the beginning of the financial crisis, market concentration has been growing in most EU member states. Many service and manufacturing industries are supplied by a handful of firms and market concentration is getting worse year on year. But rising market concentration is just one of the symptoms of a less competitive Europe. Markets show signs of a decline in business churn and a high and persistent level of market power. Tourism, legal and accounting, and advertising show some of the highest margins across countries. Over time, the auto, chemicals, and construction industries have experienced the fastest growth in markups.
So, what is it stopping new companies from entering these markets? One reason is that markups are not necessarily equal to profits. While markups might be increasing, fixed costs could be eating away at any potential profit. These fixed costs could be in traditional capital investment or in intangible capital such as investing in advertising, adopting the latest technology or acquiring the skills to comply with the latest regulation. Our econometric analysis suggests, however, that higher markups are associated with higher profits which in turn shows that fixed costs alone cannot explain the rise in margins.
Digitalisation and technology are the usual suspects behind this rise in market concentration. They have allowed companies to expand and capture new markets rapidly. But if technology is the primary cause behind market concentration, then productivity would be soaring, and this is not the case. In some industries, Europe´s labour productivity has not increased since 2001.
A crucial factor sheltering incumbents from competition is the restrictiveness of regulation. By imposing compliance costs, regulation can be used as a tool to protect incumbents from competition. This has profound implications. If political rent-seeking like lobbying for a change of regulation which has the effect of protecting firms from competition is more profitable than competing in innovation, the culture of a company will shift away from innovation and towards politics.
Regulatory barriers have a direct impact on competition. And therefore, any change in competition policy should take account of the level of regulatory restrictiveness in each sector. Our econometric analysis suggests that higher levels of regulation are associated with higher levels of market concentration and market power.
European markets are not as open to competition as it is sometimes claimed. The need for European champions is dubious when markets like railway are so regulated that getting in is nearly impossible. The economic analysis also highlights that market concentration, market power and the profitability of the incumbent dangerously reinforce each other. Protected by barriers to entry, firms can merge and use any market power to raise markups and enjoy larger Promoting European champions, without any regard to the regulatory context and the contestability of the markets in which firms operate, bears the risk of solidifying businesses structures, dismantling the competitive pressure that is still left in Europe´s economy.
Competition is not the curse but the cure to Europe’s competitiveness. Any industrial policy that is really fit for the 21st century should have the promotion of competition at its core. Market competition provides the most efficient firms with the resources needed to grow, and it encourages companies to use the latest technology to maintain their competitiveness. This process results in a more productive and innovative Europe. More competition, rather than less, will incentivise European firms to continue striving for innovation, produce new goods and services at better quality and lower prices, to the benefit of consumers and firms. Ultimately, this is the true source of European competitiveness.
[1] Macron, E. (2019, March 4). Dear Europe, Brexit is a lesson for all of us: it’s time for renewal. The Guardian.
[2] Verhofstadt, G. (2019, 1 March). Europe’s Missing Champions. Project Syndicate.
1. Introduction
Europe, it is often said, needs European Champions – companies that can compete on global markets at a time when Big is Beautiful and the big industrial brands are growing into behemoths. The French and German governments have launched a joint manifesto for a new industrial policy in Europe, and they call for a series of new policies, chiefly among them a revamp of competition policy which includes the possibility of the European Council to override the European Commission in merger-review cases[3]. The idea that EU competition policy needs to be reformed has started to get traction with even liberal politicians supporting such a change[4] with competition policy featuring in President Macron´s call to European citizens[5]. Obviously, their case for changes to competition policy comes hard on the heels of the European Commission’s rejection of the rail merger between Alstom and Siemens. Even if the manifesto includes some ideas which may be worth exploring, it is worrying that the two most powerful governments in the EU are rushing to reinvent industrial policies that verifiably failed in the past. It is equally troubling that they take their cue from a view of current markets, concentration and firm power that is profoundly wrong. Market competition in Europe is on the decline and has been for decades. Just like in the United States, the power of individual or small groups of firms to dominate certain markets has grown remarkably over the past decades, not least because of scores of new regulations that have raised the barriers to entry.
Take the railway sector as an example. Following the debate after the rail-merger failure, the impression of some seems to be that the railway sector (like many other European industries) operates under conditions of cut-throat competition. Moreover, there seems to be growing support for the notion that we are all (producers and consumers alike) at risk of being bulldozed by Chinese firms – propped up by Beijing – stealing market shares from Europeans in Europe. However, this is a misleading view. In the first place, market barriers have been pretty good at preventing Chinese firms from entering the European railway market. And, second, the reality is that Alstom and Siemens are by far the main rail players in Europe.
If the Franco-German manifesto was inspired by the failed rail merger, then it is really time to start worrying. Revealingly, both companies have argued that they already control their entire national markets and, therefore, that competition after the merger will not worsen[6]. Quite so. This Freudian slip describes the sector pretty accurately: the main international markets in the railway sector have significant barriers to competition. Import penetration in the railway supply industry is unreasonably low across Europe, Japan, Korea, China, and the US (ECORYS, 2013). If anything, there should be measures taken to improve the degree of competition and reduce the power of incumbents.
Railway is not the only sector where a few companies supply most of the market. In Europe[7], the ten largest companies control, on average, more than 80% of the market in postal, air transport, broadcasting, telecommunication, and water transport of each national market. And, as this paper will show, the degree of market concentration has increased over the years. While this was expected due to market consolidation during the recession, the number of firms exiting the market has not been matched by new companies coming in. The decline in business churn is yet another symptom of the fall in economic and business dynamism in Europe. And the weakening in competition has not been unnoticed. Businesses, in manufacturing and in services, have been able to harness market power and raise their markups – at the expense of consumers. The answer to this problem is clear: Europe’s market needs more competition, not less.
Cutting regulation is critical to improving competition. This paper will demonstrate that regulatory barriers to entry can be so formidable that they suppress any competitive pressure from markets. Incumbents are willing to put up and even favour mounting regulation if that prevents competition. Our analysis suggests that the restrictiveness of regulation and the decline of market competition are clearly linked. Besides, growing market concentration unleashes greater incumbent´s markups and profits that reinforces the trend of higher market concentration.
As markets are becoming more regulated, policy-makers in Europe cannot ignore the impact of regulation on competition policy. If they take account of it, they may arrive at strikingly different conclusions to those of their French and German counterparts. Market competition in Europe is in decline, and regulatory barriers contribute to growing levels of market concentration and market power by sheltering incumbents from competition. In this context, any proposal designed to weaken competition policy in Europe is destined to solidify business structures at the detriment of economic growth, innovation, and prosperity.
Section two provides a picture of the state of market competition in Europe at member state and industry level. The analysis shows that market competition in Europe is declining. Section three explores the role of regulation explaining this decline in market competition. It presents the lack of progress in the liberalisation of the economy in Europe and it estimates econometrically the impact of regulation on market concentration and market power.
[3] A Franco-German Manifesto for a European industrial policy fit for the 21st Century. This document can be accessed at: https://www.gouvernement.fr/en/a-franco-german-manifesto-for-a-european-industrial-policy-fit-for-the-21st-century
[4] Verhofstadt, G. (2019, 1 March). Europe’s Missing Champions. Project Syndicate.
[5] Macron, E. (2019, March 4). Dear Europe, Brexit is a lesson for all of us: it’s time for renewal. The Guardian.
[6] Financial Times (2019, February 6). The blunders that derailed European train merger. This article can be accessed at: https://www.ft.com/content/c8a0e064-2a23-11e9-a5ab-ff8ef2b976c7
[7] EU countries included are Austria, Belgium, Czech Republic, Estonia, Finland, France, Germany, Italy, Latvia, Poland, Portugal, Romania, Slovenia, and Spain representing 69% of EU GDP.
2. A Bigger Share of the Pie: Evidence of Rising Market Concentration in the EU
Every course on Economics 101 starts with a presentation of the economy which resembles the way a first-year medical student studies the human body. As doctors first learn how the human body works without illnesses, economists study the economy with no unemployment, no market failures, and perfect competition. In reality, however, economies do suffer from long-term unemployment, experience positive and negative externalities, and markets range from being perfectly competitive to completely monopolistic.
Competition, like regular exercise, is good for the health of the market economy. The healing properties of competition work in two ways: first, competition leads to the exit of inefficient firms as companies strive to offer products of better quality and lower prices. This process supports the allocation of labour and capital to the companies which are successful, which in turn has positive effects on the overall productivity. Secondly, competition encourages innovation as firms look for ways to offer new and better products at lower costs.
Market concentration is not necessarily a problem in itself. Competition could be fearsome even with a few players. If consumers are willing to shop around and barriers to entry are low, competition will thrive. However, in addition to growing market concentration, markups, which are the difference between the cost of the product and the price paid by consumers, have also been rising. Still, it is not the level of markups which is concerning, as firms could charge higher prices because they produce better products; it is the persistence of these markups that is worrying.
The evidence that market power is on the rise and markets have become more concentrated is broad and compelling. De Loecker and Eeckhout (2018) show that the average global markup has gone up from 1.1. in 1980 to around 1.6 in 2016. Similarly, the IMF (2018) found evidence of increasing market power across a broad base of industries and countries with markups in Europe rising since 2000. The OECD (2018) has also noticed the growth in markups over the period driven by firms at the top of the markup distribution. In the US, the Economist magazine reported that two-thirds of the 900-odd sectors covered by America’s five-yearly economic census became more concentrated between 1997 and 2012. In addition, some studies have presented evidence of market concentration in individual industries such as agriculture, hospitals, wireless and the loan and deposit markets[8].
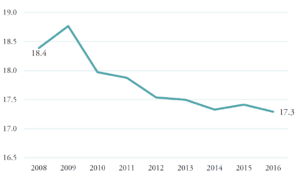
The lack of competition can be seen by the declining speed at which new firms enter markets, and old companies fade away. Take for instance the difference between new businesses and those closing, referred to as business churn and shown in Figure 2.1. The trend is clear. Business churn in Europe is in decline. Even though market consolidation after the economic crisis can explain some of this decline, the current rate at which new businesses have been created and old ones foreclose is far from the levels before 2008. If the economic crisis was the reason behind the fall in business churn, economic dynamism should have recovered following the improvement in the economy. The fall in economic dynamism is a phenomenon that spans beyond Europe. In the US, there has also been a long-term decline in business churn[9]. Business churn impacts market concentration and economic growth in two ways. First, new companies tend to offer goods and services at a price closer to the marginal cost, reducing the average markup in the economy. Secondly, new entrants that manage to stay in the market tend to have higher productivity than the old companies which exist the industry.
Figure 2.1: Business churn in Europe
Source: Eurostat, authors’ calculations.
Note: EU comprises Austria, Belgium, Bulgaria, Czech Republic, Denmark, Estonia, Finland, France, Germany, Hungary, Ireland, Italy, Latvia, Lithuania, Luxembourg, Netherlands, Portugal, Romania, Slovakia, Slovenia, Spain, Sweden, and the United Kingdom
If markups are increasing, companies will normally try to enter markets where incumbents are enjoying higher margins. However, the opposite is occurring. Europe is experiencing more market consolidation and lower rates of business churn.
One possible reason for why businesses are not entering these markets could be because markups are not necessarily equal to profits. While markups might be increasing, fixed costs could be eating away at any potential profit. These fixed costs, however, do not necessarily have to be in traditional capital investments, such as machinery, but could be in intangible capital. Brand loyalty, advertising, or the ability to comply with the latest regulation requires long-term investments. For instance, as a share of the variable cost, US firm’s spending on marketing and management has increased from 12% in 1950 to 22% in 2016 (Traina, 2018). These investments in intangible capital improve efficiency and facilitate economies of scale, but some of them – such as the ability of firms to manage red tape – are often barriers to entry for new firms.
Barriers to entry and market concentration reinforce each other. A fall in firm entry rates leads to higher concentration and incumbent’s profits. This windfall provides an advantage to incumbents who can use these profits to raise entry barriers, leading to even lower rates of new firms entering the market[10]. These barriers can take multiple forms. They may come as a result of developments within markets or be imposed by regulation which raises the cost of market entry.
One usual suspect behind the increase in market concentration is technology. Digitalisation has allowed companies to expand and capture new markets rapidly, in a way that has not been possible before. This is particularly true in digital services where marginal costs are close to zero. Without a trade-off between cost and quality, any digital product which is marginally better than its competitor will gain most of the market share. Network effects, which are also a fundamental feature of the digital economy, are another force behind market concentration. When services benefit from network externalities more customers use these services, so the more valuable they become. Strong network effects make a product less substitutable and increase the opportunity cost of switching to a competitor.
Technology and networks effects are positive developments for consumers. We enjoy products at lower costs and benefit from the interactions and inputs from the people in our networks. Better technology and more innovation push up productivity growth which makes us all better off. However, if innovation were the driving force behind market concentration, labour productivity would grow considerably, as incumbents, using new technologies to their advantage would become more efficient. And even if firms at the technology frontier are enjoying this productivity boost as a result of more substantial investments in technology, there are no productivity gains across the economy. As it is shown in the supplementary Annex accompanying this paper, in some European sectors labour productivity has not increased since 2001[11].
But it is regulatory barriers that are the focus of this study. These barriers represent a fixed cost which deters new entrants. Even though every company in the market bears the cost of higher regulation, incumbents are better suited to adapt and influence current and future regulatory costs. Technology and regulation can also be seen as complementary factors behind the rise in market concentration. Even if firms get a step ahead because of innovation or better management practices, they can use these rents to lobby regulators and raise regulatory barriers.
Most of the debate on market concentration and market power has been focussed on the US economy. There, researchers have unveiled growing evidence of higher market concentration which impacts economic growth, investment, and inequality. (Grullon et al., 2017 and 2018; Furman and Orszag, 2015 and 2018; Bessen, 2016; Gutierrez and Philippon, 2017). This paper aims to begin this conversation in Europe, by presenting new evidence of growing market concentration and market power in EU countries at a time where the rules underpinning competition policy are being put into question.
The next section looks first at the EU countries with the highest levels of market power and those that have experienced the most significant changes in market concentration over time. Secondly, market concentration and market power are assessed at the industry level.
Market concentration is measured using the Herfindahl-Hirschman Index (HHI) and the market share of the ten largest firms by turnover (C10). Market power is measured using the level of markup. If a firm can set prices significantly above costs, it means that it has the confidence that such higher prices will not harm its profits, which indicates market power[12]. Markups are proxied by the price-cost margin, which is defined as turnover minus cost over turnover.
The data on market concentration and market power used in this paper has been gathered by the Competitiveness Network (CompNet). CompNet was set up by the EU system of Central Banks and collects firm-level data from member states on competition, productivity, labour, trade, and finance[13]. This section presents data for Austria, Belgium, Czech Republic, Estonia, Finland, France, Germany, Italy, Latvia, Lithuania, Poland, Portugal, Romania, Slovakia, Slovenia, and Spain[14]. These 16 countries represent 70% of EU GDP.
2.1 Market Concentration and Market Power in Europe: A Country Level Analysis
Market concentration has been increasing in most of the EU member states for which data is available. Since the beginning of the financial crisis of 2008, all countries but Poland show a rise in market concentration (HHI), with the greatest increases in percentage terms registered in Estonia, Czech Republic, Austria, Finland, and Spain. Between 2008 and 2012, the ten largest companies by turnover have captured an increasing share of the market in 12[15] out of the 16 member states included in the analysis.
In relation to market power, the countries where firms are charging the highest markups were the Czech Republic, Austria and Germany. These countries show the most substantial markups in 2012 and throughout the period (2001-2012). Nonetheless, between 2008 and 2012, the average level of markup in the economy fell by 8%. In nine member states (Belgium, Finland, France, Italy, Latvia, Poland, Portugal, Romania, and Spain) there was a fall in markups while in five (Austria, Czech Republic, Estonia, Germany, and Slovenia) member states have seen firms increasing their margins.
The fall in markups and the increase in market concentration in many European countries can be explained as a result of the market consolidation that many markets underwent after the financial crisis. Pressured by a fall in demand, many firms have had to reduce their commercial margins or merge with their competitors in order to survive.
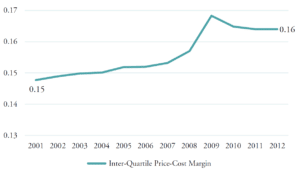
Even though average markups have fallen since 2008, the distribution of these markups has followed a different trend. Since the beginning of the 2000s, firms at the top of the markup distribution have seen their margins growing faster than firms at the bottom. Figure 2.2 below shows the rising level of the inter-quartile price-cost margin, which registers the difference between the markups charged by firms at the top third and the bottom first quartile[16]. The growth in the inter-quartile price margin indicates the growing inequality among firms with firms at the top charging growing margins as compared to those at the bottom of the markup distribution.
Figure 2.2: Inter-Quartile Price-Cost Margin
Source: CompNet, authors’ calculations.
Note: Weighted average by total turnover in Austria, Belgium, Estonia, Finland, France, Germany and Spain.
2.2. Market Concentration and Market Power in Europe: An Industry Level Analysis
Postal, air transport, telecommunications, broadcasting, and water transport are among the most concentrated markets in many EU countries[17]. These are sectors where the incumbents hold the majority of the market share. For example, in Germany, the ten largest companies capture more than 90% of the market in air transport, postal, water transport, and broadcasting. Market structure can partially explain these levels of market concentration. Industries such as postal, telecommunication, water and air transport are also network industries with significant sunk costs and prone to have few players. Yet, within the same sectors, market concentration varies widely across countries which implies that making these industries more competitive is possible. For example, market concentration (HHI) in the postal sector in France is three times higher than in Romania.
Market concentration is substantial in many service and manufacturing industries where a healthy dose of competition would be expected. For example, in Germany, the ten largest companies control 75% of the information and service activities which include tasks such as data processing and data hosting. In Italy and Spain, the ten largest temporary employment agencies control 70% and 63% of the market. In Poland, tourism is the eight most concentrated sector in the economy. Similarly, the manufacturing of beverage lays within the five most concentrated sectors (C10 & HHI) in Austria, Estonia, Slovenia, Finland and Romania.
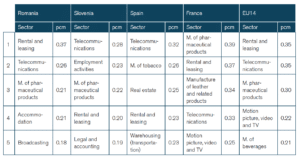
In relation to market power, the service sector contains most of the industries with the highest markups: tourism, legal and accounting, advertising, management consultancy, information activities, broadcasting, real state, and rental and leasing show some of the highest margins across several countries. For example, management consultancies charge the fifth highest markups in the Austrian economy. In Belgium, four of the five sectors with the highest markups are sectors within services. Legal and accounting is one of the top-five sectors with the highest markups in Finland, Belgium, Estonia, Portugal, and Slovenia.
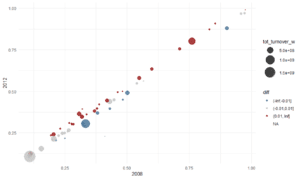
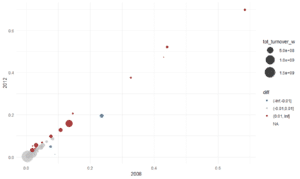
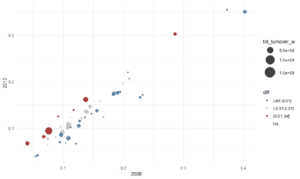
To understand the changes in market concentration and market power, it is essential to identify the sectors which have experienced the largest variations in market concentration and market power since the financial crisis (2008) to the latest year in which data is available for all the countries (2012). Figures 2.3, 2.4, and 2.5 below show the changes in market concentration (HHI/C10) and market power (pcm) for the EU14 in 2008 (x-axis) and 2012 (y-axis). The value of each sector is weighted by its total turnover which is indicated by the size of the circle. The colour of the circle indicates whether the level of market concentration and market power has increased (red), decreased (blue) or stayed relatively the same (grey). The industries with the highest levels of market concentration and market power are those at the top right corner[18], while the red dots show the industries where market competition has declined over time. The supplementary Annex, which can be accessed as a separated document, includes the same charts for each of the analysed countries.
In the EU14, the ten largest companies have acquired a larger market share in 66% of the sectors, with the most significant increases seen in land transport, video and TV production, manufacturing of furniture and manufacturing of transport equipment (Figure 2.3). In relation to the HHI, postal, air and water transport, and the manufacturing of tobacco are outliers with very high levels of market concentration. In industries for which HHI is lower than 0.2, land transport, manufacture of computer, electronics and optical products, manufacture of vehicles, and video and TV production show the largest increases in market concentration (Figure 2.4).
Regarding market power, proxied through the price-cost margin, Figure 2.5 shows that in most sectors margins have fallen, a result expected during a period of economic stagnation or recession. However, there are still a significant number of sectors (13 sectors out of 46) for which markups in 2012 were higher than in 2008. Looking at the industries with the most significant turnover, the auto industry, chemicals, and construction show the highest rise in market power.
Figure 2.3: EU14 Market concentration (market share of the ten largest firms by turnover (C10))
Source: CompNet, authors’ calculations.
Note: EU14 comprises Austria, Belgium, Czech Republic, Estonia, Finland, France, Germany, Italy, Latvia, Poland, Portugal, Romania, Slovenia, and Spain. The value of each sector is weighted by its total turnover which is indicated by the size of the circle. The colour of the circle indicates whether the level of market concentration and market power has increased (red), decreased (blue) or stay relatively the same (grey).
Figure 2.4: EU14 Market concentration (Herfindahl-Hirschman Index (HHI))
Source: CompNet, authors’ calculations.
Note: EU14 comprises Austria, Belgium, Czech Republic, Estonia, Finland, France, Germany, Italy, Latvia, Poland, Portugal, Romania, Slovenia, and Spain. The value of each sector is weighted by its total turnover which is indicated by the size of the circle. The colour of the circle indicates whether the level of market concentration and market power has increased (red), decreased (blue) or stay relatively the same (grey).
Figure 2.5: EU14 Market power (Price Cost Margin)
Source: CompNet, authors’ calculations.
Note: EU14 comprises Austria, Belgium, Czech Republic, Estonia, Finland, France, Germany, Italy, Latvia, Poland, Portugal, Romania, Slovenia, and Spain. The value of each sector is weighted by its total turnover which is indicated by the size of the circle. The colour of the circle indicates whether the level of market concentration and market power has increased (red), decreased (blue) or stay relatively the same (grey).
[8] Congressional Research Service (2010) shows that market concentration increased in eight of the nine agricultural industries it tracks. Fuglie et al. (2012) finds an increase in market concentration among agricultural supply industries. Vogt and Town (2006) find that hospital HHI increased by 47% between 1990 and 2003. A study by the FCC (2014) finds wireless HHIs increasing from under 2,700 in 2008 to over 3,000 in 2013. Corbae and D’Erasmo (2013) document an increase in concentration of the loan market share and deposit market share of U.S. banks between 1976 and 2010.
[9] Draghi, M. (2017, March 13). Moving to the Frontier: Promoting the Diffusion of Innovation. The European Central Bank. This document can be accessed at: https://www.ecb.europa.eu/press/key/date/2017/html/sp170313_1.en.html
[10] In the extreme case of monopoly, only one company will supply the entire market, producing less output at a higher price. Moreover, since monopolists know that higher levels of production would reduce their profits, investment will also fall.
[11] National consolidation to build the capacity required to compete internationally and the increases in merger and acquisitions, particularly in the US, have also been pointed out as other possible explanations behind the rise in market concentration.
[12] Price cost margins may also reflect product quality and efficiency in addition to or rather than pure market power
[13] Additional information on the CompNet dataset can be accessed at: https://www.comp-net.org/data/. For a summary of the methodology and variables included in the dataset see CompNet (2016). CompNet firm-level based dataset: User guide for researchers. This document can be accessed at: https://www.ecb.europa.eu/home/pdf/research/CompNet/CompNet-database-user_guide-round4.pdf
[14] Country coverage varies depending on the level of aggregation and the type of indicators.
[15] These countries are Austria, Belgium, Czech Republic, Estonia, Finland, France, Germany, Latvia, Portugal, Romania, Slovenia, and Spain
[16] Similar findings have been presented by Furman and Orszag (2015) for the US economy.
[17] Annex 1 presents the top-five sectors by market concentration (HHI, C10), and market power (price cost margin) in 2012 across Austria, Belgium, Czech Republic, Estonia, Finland, France, Germany, Italy, Latvia, Poland, Portugal, Romania, Slovenia, and Spain representing 69% of EU GDP. Individual sectors have been aggregated per country using total turnover as a weight to calculate the top-five sectors with the highest levels of market concentration and market power across the EU14.
[18] These industries are also reported in Annex 1.
3. Regulation, Barriers to Entry and Market Concentration
The economic literature has put forward three broad conceptions of the role of regulation. In the first and more benign one, regulation is developed to fix market failures (Pigou 1920). In less benevolent concepts, regulators impose costs on industries for their benefit and the benefit of politicians (McChesney 1987; Djankov et al. 2002) or, as presented by Stigler[19] in 1971, regulation is developed by the industry and is designed and operated primarily for its benefit.
In practices, these three ways of describing how regulation works may happen simultaneously. For example, an environmental regulation that limits the amount of pollution emitted by a particular industry, reducing the negative externality resulting from the pollution, can have political objectives in addition to fixing a market failure. Depending on the design of the regulation, it could also increase not just production costs but the cost of entry into that industry.
Stigler´s view represents a useful starting point to understand the current rise in market concentration. While regulators have to satisfy the interest of producers and consumers, producers are likely to win as they are better organised and possess specialised knowledge of the industry. As a result, incumbents can influence the political process and shape regulation in their favour (Healy et al., 2015). As a policy measure, regulation has a clear advantage over other forms of industrial support like subsidies. While subsidies encourage new entrants, regulatory barriers directly limit competition.
This is important to acknowledge: regulatory barriers have a direct impact on competition. A more permissive competition policy in Europe will lead to a degree of market consolidation that, because of the regulatory barriers protecting incumbents, will be very difficult to reverse. If markets are contestable, i.e. with few barriers to entry, then even highly concentrated industries should behave as if they have many competitors (Baumol, 1982). If entry costs are high, as a result of regulatory fixed costs or licensing requirements, firms will escape the competitive pressure of the market economy[20].
The idea that regulation can be used as a successful tool to protect incumbents from competition has profound implications. Not just because of the likely decrease in the quality and increase in the prices of the goods and services consumed but because of what it signals to businesses. If political rent-seeking like lobbying for a change of regulation which has the effect of protecting firms from competition is more profitable than competing in innovation, the culture of a company will shift away from innovation towards politics, at the detriment of economic growth and overall prosperity. Analysis of the Italian economy demonstrates that politically connected firms are more likely to survive and to grow in terms of revenues and employment, although this growth in size is not coupled with productivity growth.[21] (Akcigit, Baslandze, and Lotti, 2018). In Spain, research has shown that capital and labour were inefficiently allocated in the period prior to the economic crisis and this misallocation was particularly acute in the sectors where regulation was most prevalent (Garcia-Santana, et al., 2016).
3.1. Measuring Regulatory Barriers
The OECD measures a country’s regulatory stance over time using its economy-wide indicator of product market regulation (PMR)[22]. The economy-wide PMR is made of a number of sub-indicators measuring state control, barriers to firms, and barriers to trade and investment. The qualitative information gathered by the OECD is transformed into quantitative information by assigning a numerical value which ranges between zero and six, where a lower value reflects a more competition-friendly regulatory stance[23].
The PMR index shows that for the EU[24], more than half of all the product market liberalisation undertaken from 1998 to 2013 was made during the first five years. The overall PMR score fell by 0.13 between 2008 and 2013, which is markedly less than the declines observed during earlier periods (-0.44 between 1998 and 2003 and -0.22 between 2003 and 2008). The deceleration in the pace of reforms might reflect that liberalisation has become harder or that countries have moved away from market-friendly legislation. This lack of progress is evident in some of the components of the overall PMR indicator, in particular, those that cover barriers to entry and exit.
Figure 3.1 below demonstrates this clearly. It shows barriers in services, a subcomponent of administrative burdens on start-ups, and the economy-wide PMR for the EU member states in 2008 and 2013. As can be seen, the level of barriers in services is significantly higher than for the economy-wide PMR. Besides, the progress made by member states during this period was much more restricted in barriers to services than for the overall index. The slope of the line joining the dots indicates the degree of liberalisation between periods. A 45-degree line represents no changes in the indexes over time. Figure 3.1 shows that the slope of the line for barriers to services is steeper and closer to a 45-degree line than for the overall economy-wide PMR.
This lack of progress in reducing barriers to entry in services has real implications. The previous section showed a considerable level of market concentration and markups in some service industries across many EU member states. The high level of regulatory protection has a bearing in the decline in market competition and must be taken into account in any future discussion of EU industrial and competition policy.
Figure 3.1: Economy-wide PMR and barriers in the services sector
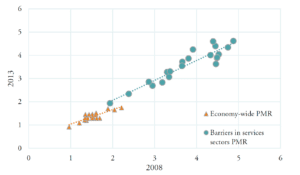
Source: OECD.
Note: Data available for Austria, Belgium, Czech Republic, Denmark, Finland, France, Germany, Greece, Hungary, Ireland, Italy, Netherlands, Poland, Portugal, Spain, Sweden, and the United Kingdom.
3.2. Market Concentration, Market Power, Profitability and Regulation: An Econometric Analysis
While regulation impacts market competition in theory, this section tests this hypothesis empirically. Our assumption is that the degree of competition in an economy is closely connected with regulatory barriers, particularly barriers to entry. New firms tend to draw prices closer to marginal costs, while the exit of less efficient firms tends to free up resources to be used by more efficient ones. First, by stopping this process, barriers to entry distort the reallocation of labour and capital from the less to the more efficient firms, which ultimately damages the overall productivity of the economy. Secondly, by adopting pricing strategies that hamper competition, firms are no longer incentivised to improve their efficiency. Even more, a lack of competitive pressure reduces the incentives for firms to innovate and slows down the rate at which old technologies and products are replaced by new ones.
An econometric model using panel data is set up to investigate the impact of regulation on market competition. The objective of this analysis is not to prove a particular channel of causality but to highlight the significance of the relationship between regulation, market concentration, market power and the profitability of the incumbent.
There is an extensive literature which associates regulatory restrictiveness with diminished dynamisms because of wasteful rent-seeking (Tullock 1967, Posner 1975) that creates barriers to entry (Olson, 1982) or diverts talents from productivity endeavours (Murphy, Shleifer, and Vishny 1991). More recently, Gutierrez and Philippon (2017) also investigate the role of regulation in the growing levels of market concentration in the US economy. The authors show that US industries with growing regulation experience substantial increases in concentration. De Loecker and Eeckhout (2018) find evidence of a strong relationship between market valuation relative to sales, which they use as a measure of the stock of profits, and markups. Finally, the IMF (2018) finds that profits and market concentration measures are positively related.
To perform this analysis, we merge data from OECD Product Market Regulation (PMR)[25] and the Competitiveness Research Network (CompNet) to build an unbalanced panel dataset with indicators on product market regulation, market power, market concentration and profitability for 18 EU countries which make up 72% of EU GDP. Table A4.1. in the supplementary Annex presents the countries and periods included in our dataset.
3.2.1. Empirical Results
The first set of regressions explore the effect of regulation on market power, market concentration and profitability using fixed effects regression analysis. The regressions were run using cluster-robust standard errors at the country level.
We estimated the following three regressions:
(1) Market powerit=β0+β1 Regulatory Barriersit+εit
(2) Market concentrationit=β0+β1 Regulatory Barriersit+εit
(3) Profitabilityit=β0+β1 Regulatory Barriersit+εit
The results of our fixed effect panel regression are presented in the table below:
Table 3.1: Regression results
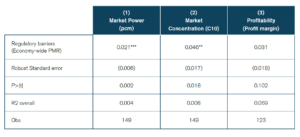
Note: * p<0.10; ** p<0.05; *** p<0.01.
This analysis shows that regulatory barriers are positively related to market power, market concentration and profitability of the incumbent. For market power and market concentration, this association was found to be statistically significant. In other words, the higher the level of regulation the higher the markups and market concentration. A change in market regulation, however, may take some time to impact the economy. The same regressions were run with a one-year lag in the PMR index, obtaining significance results for market power and market concentration.
It is also possible that firms, having gained market power, use the additional profits from setting prices above the marginal costs to persuade governments to raise regulatory barriers. A similar regression analysis was run but reversing the variables in the equation. The results show that higher levels of market power, market concentration and profits are associated with higher regulatory barriers in the economy.
This empirical analysis demonstrates that market competition and regulation are intimately related. This is important for three reasons: first, to illustrate that the lack of progress in introducing pro-maker reforms has had real consequences and contributed to higher levels of market concentration in Europe; second, to shows that if policy-makers want to make Europe more competitive, they need to tackle barriers to entry to make markets more contestable; and thirdly, given the power of regulatory barriers on competition, to illustrate that a relaxation of competition policy without tackling these barriers, will lead to further market concentration which is unlikely to be reversed.
The second set of regressions explore the relationship between market power, market concentration and profitability. A reduction in the level of competition enables businesses to charge prices above marginal costs. The additional profits coming from these higher prices can be used to lobby for protection and further reduce competition, leading to more market concentration and enabling firms to subsequently increase markups and profits.
To test this hypothesis, we estimated the following three regressions:
(4) Market powerit=β0+β1 Market concentrationit+εit
(5) Market powerit=β0+β1 Profitabilityit+εit
(6) Profitabilityit=β0+β1 Market powerit+εit
Our analysis suggests that market concentration, market power and profitability are positively related to each other. There is evidence that market concentration and profits lead to higher markups and, at the same time, that markups have a positive effect on the incumbent´s profits. In other words, an increase in market concentration that leads to higher markups, allows firms to charge higher prices and gain increasing profits. And these additional profits also help firms to acquire additional market power[26]. Moreover, the significant positive relationship between markups and profit is in line with the findings of the IMF (2018) and suggests that fixed costs alone cannot explain the growth in markups. If that were the case, the coefficient between markups and profits would be insignificant, which it is not.
Table 3.3: Regression results
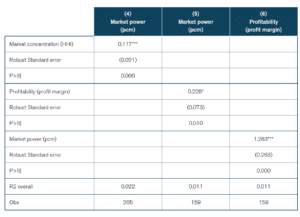
Note: * p<0.10; ** p<0.05; *** p<0.01.
[19] George Stigler (1971). The Theory of Economic Regulation.
[20] Another worrying feature of regulation is its growing complexity (Olson, 1982). Bessen (2016) shows that a large share of the rise in valuation and profits in the US can be accounted by factors associated with growing complexity of regulation.
[21] This is not an isolated case. Other studies have found that corporate political activity is associated with favourable tax treatment (Richter, Samphantharak, and Timmons 2009; Alexander, Mazza, and Scholz 2009), regulatory rate setting (Bonardi et al., 2006), tariffs (Mayda et al., 2010), government contracts (Goldman et al., 2013), and bailouts (Duchin and Sosyura 2012).
[22] Additional information on the OECD PMR and the underlying data can be accessed at: http://www.oecd.org/eco/growth/indicatorsofproductmarketregulationhomepage.htm
[23] A separated Annex includes a tree-structure of the integrated product market regulation indicator.
[24] EU countries included in the analysis: Austria, Belgium, Czech Republic, Denmark, Finland, France, Germany, Greece, Hungary, Ireland, Italy, Netherlands, Poland, Portugal, Spain, Sweden, United Kingdom. The calculation of the EU PMR is a GPD weighted average of the member states PMRs.
[25] The OECD PMR is published at five years intervals for the years of 1998, 2003, 2008 and 2013. The data for in-between years is retrieved from linear interpolation between the published values. Other studies have followed the same methodology to calculate the gap years. See for example Thum-Thysen and Canton (2017).
[26] In the US economy Grullon et at (2018) found that even if mergers of firms in the same industry have become more profitable in general, the profitability is even greater in industries with higher concentration levels.
4. Conclusion
Few EU policies have been so successful as competition. However, what was once an unshakable truth of the EU acqui communautaire is beginning to tremble. The Franco-German manifesto on the EU future industrial policy offers a window into this new thinking. The manifesto calls for a new division of power between the European Council and the European Commission on competition policy, and a more interventionist and active role from member states on their industrial policies. This paper has shown that the economic diagnosis of the Franco-German manifesto is wrong and as a consequence its policy proposals are misguided.
Any future industrial and competition policy reform should take account of the following findings:
1. Market competition in most European countries has not increased but declined. Fewer firms control a higher share of the market in each industry. This process, which can be partly explained by the restructuring of the market following the 2008 crisis, has been accompanied, in some sectors, by growing levels of market power. The decline in market competition in Europe is bad news for European policy-makers and for European citizens. Competition is connected with competitiveness: higher levels of competition have positive effects on productivity, allow for a better allocation of capital and labour and encourage firms to embrace new technologies. Any new industrial policy in Europe should aim at reversing the trend of declining market competition.
2. Regulation does play a crucial role in explaining the decline in market competition in Europe. Policy efforts to make markets more contestable have flattened out, with virtually no progress made during recent years. This protection has allowed markets to become more concentrated and sustain considerable margins. The econometric analysis suggests that more stringent regulation leads to higher market concentration and market power.
3. Any change in competition policy should account for the regulatory context in which each firm operates. The degree of competition in a market is determined not just by the number of players and their market share but also by the contestability of the market. Without further regulatory reforms, to make markets more contestable, weakening competition policy will lead to further market concentration, squeezing consumers and firms, and crippling the economy.
References
Alesina, A., Ardagna, S., Nicoletti, G., & Schiantarelli, F. (2005). Regulation and investment. Journal of the European Economic Association, 3(4), 791-825.
Alexander, R., Mazza, S. W., & Scholz, S. (2009). Measuring rates of return on lobbying expenditures: An empirical case study of tax breaks for multinational corporations. JL & Pol., 25, 401.
Bassanini, A., & Ernst, E. (2002). Labour market institutions, product market regulation, and innovation.
Baumol, W. J. (1986). Contestable markets: an uprising in the theory of industry structure. Microtheory: applications and origins, 40-54.
Bessen, J. E. (2016). Accounting for rising corporate profits: intangibles or regulatory rents?. Boston Univ. School of Law, Law and Economics Research Paper, (16-18).
Bonardi, J. P., Holburn, G. L., & Vanden Bergh, R. G. (2006). Nonmarket strategy performance: Evidence from US electric utilities. Academy of Management Journal, 49(6), 1209-1228.
Calligaris, S., Criscuolo, C., & Marcolin, L. (2018). Mark-ups in the digital era.
CoE, A. (2016). Benefits of Competition and Indicators of Market power. Issue Brief, 17.
CompNet (2016). CompNet firm-level based dataset: User guide for researcher.
Corbae, D., & D’erasmo, P. (2011). A quantitative model of banking industry dynamics. manuscript, University of Wisconsin, Madison, and University of Maryland.
De Loecker, J., & Eeckhout, J. (2018). Global market power (No. w24768). National Bureau of Economic Research.
Diez, M. F., Leigh, M. D., & Tambunlertchai, S. (2018). Global market power and its macroeconomic implications. International Monetary Fund.
Djankov, S., La Porta, R., Lopez-de-Silanes, F., & Shleifer, A. (2002). The regulation of entry. The quarterly Journal of economics, 117(1), 1-37.
Djankov, S., McLiesh, C., & Ramalho, R. M. (2006). Regulation and growth. Economics letters, 92(3), 395-401.
Draghi, M. (2017, March 13). Moving to the Frontier: Promoting the Diffusion of Innovation. The European Central Bank, Retrieved from https://www.ecb.europa.eu
Duchin, R., & Sosyura, D. (2012). The politics of government investment. Journal of Financial Economics, 106(1), 24-48.
ECORYS (2013). Sector Overview and Competitiveness Survey of the Railway Supply Industry. European Commission.
Financial Times (2019, February 6). The blunders that derailed European train merger. Financial Times, Retrieved from https://www.ft.com
Fuglie, K. O., King, J. L., Heisey, P. W., & Schimmelpfennig, D. E. (2012). Rising concentration in agricultural input industries influences new farm technologies (No. 1490-2016-128317).
Furman, J., & Orszag, P. (2015). A firm-level perspective on the role of rents in the rise in inequality. Presentation at “A Just Society” Centennial Event in Honor of Joseph Stiglitz Columbia University, 16.
Furman, J., & Orszag, P. R. (2018). Slower Productivity and Higher Inequality: Are They Related?
García-Santana, M., Moral-Benito, E., Pijoan-Mas, J., & Ramos, R. (2016). Growing like Spain: 1995-2007.
Goldman, E., Rocholl, J., & So, J. (2013). Politically connected boards of directors and the allocation of procurement contracts. Review of Finance, 17(5), 1617-1648.
Griffith, R., & Harisson, R. (2004). The link between product market reform and macro-economic performance (No. 209). Directorate General Economic and Financial Affairs (DG ECFIN), European Commission.
Grullon, G., Larkin, Y., & Michaely, R. (2018). Are US industries becoming more concentrated?. Forthcoming, Review of Finance.
Gutiérrez, G., & Philippon, T. (2017). Declining Competition and Investment in the US (No. w23583). National Bureau of Economic Research.
Healy, P., Henderson, R., Moss, D., & Ramanna, K. (2015). A crisis in the theory of the firm.
Koedijk, K., & Kremers, J. (1996). Market opening, regulation and growth in Europe. Economic Policy, 11(23), 443-467.
Loayza, N. V., Oviedo, A. M., & Servén, L. (2005). Regulation and macroeconomic performance. The World Bank.
Macron, E. (2019, March 4). Dear Europe, Brexit is a lesson for all of us: it’s time for renewal. The Guardian, Retrieved from https://www.theguardian.com
Mayda, A. M., Ludema, R. D., & Mishra, P. (2010). Protection for free? the political economy of US tariff suspensions. IMF Working Papers, 1-48.
McChesney, F. S. (1987). Rent extraction and rent creation in the economic theory of regulation. The Journal of Legal Studies, 16(1), 101-118.
Murphy, K. M., Shleifer, A., & Vishny, R. W. (1991). The allocation of talent: Implications for growth. The quarterly journal of economics, 106(2), 503-530.
Nicoletti, G., & Scarpetta, S. (2003). Regulation, productivity and growth: OECD evidence. Economic policy, 18(36), 9-72.
Nicoletti, G., Bassanini, A., Jean, S., Ernst, E., Santiago, P., & Swaim, P. (2001). Product and labour market interactions in OECD countries.
Norman, L., Maria, O. A., & Luìs, S. (2004). Regulation and macroeconomic performance. World Bank Policy Working Paper.
Olson, M. (2008). The rise and decline of nations: Economic growth, stagflation, and social rigidities. Yale University Press.
Pigou, A. (2017). The economics of welfare. Routledge.
Posner, R. A. (1975). The social costs of monopoly and regulation. Journal of political Economy, 83(4), 807-827.
Richter, B. K., Samphantharak, K., & Timmons, J. F. (2009). Lobbying and taxes. American Journal of Political Science, 53(4), 893-909.
Schiantarelli, F. (2005). Product market regulation and macroeconomic performance: A review of cross-country evidence. The World Bank.
Shields, D. A. (2010). Consolidation and concentration in the US dairy industry. Congressional Research Service Report, 41224.
Stigler, G. J. (1971). The theory of economic regulation. The Bell journal of economics and management science, 3-21.
The Economist (2016, March 26). The problem with profits. Big firms in the US have never had it so good. Time for more competition. The Economist, Retrieved from https://www.economist.com
The Economist (2016, March 26). Too much of a good thing. Profits are too high. America needs a giant dose of competition. The Economist, Retrieved from https://www.economist.com
Thum, A. E., & Canton, E. (2017). Estimating Mark-ups and the Effect of Product Market Regulations in Selected Professional Services Sectors: A Firm-level Analysis (No. 046). Directorate General Economic and Financial Affairs (DG ECFIN), European Commission.
Traina, J. (2018). Is aggregate market power increasing? production trends using financial statements.
Tullock, G. (1967). The welfare costs of tariffs, monopolies, and theft. Economic Inquiry, 5(3), 224-232.
Verhofstadt, G. (2019, 1 March). Europe’s Missing Champions. Project Syndicate, Retrieved from https://www.project-syndicate.org
Vogt, W. B., & Town, R. (2006). How has hospital consolidation affected the price and quality of hospital care?.
Annex 1: Market Concentration and Market Power in EU Member States by Sector
Table A1.1: Top-five sectors by market concentration (HHI) – 2012
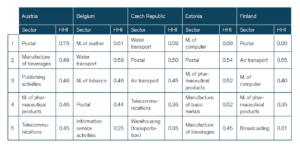
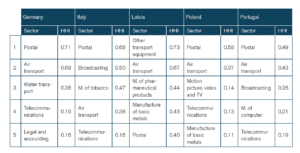
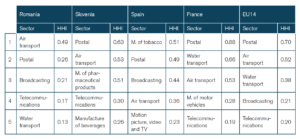
Source: CompNet, authors’ calculations.
Table A1.2: Top-five sectors by market concentration (Market share of the ten largest companies, C10) – 2012
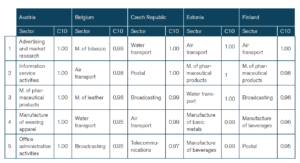
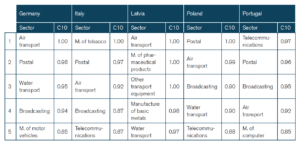
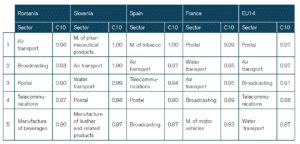
Source: CompNet, authors’ calculations.
Table A1.3: Top-five sectors by market power (Price Cost Margin) – 2012
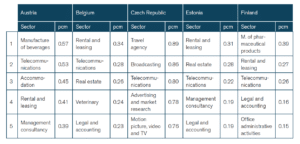
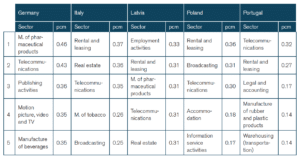
Source: CompNet, authors’ calculation