Shifting into Digital Services: Does a Crisis Matter and for Who?
Published By: Erik van der Marel
Subjects: Digital Economy European Union Services WTO and Globalisation
Summary
How do trade patterns change after an external shock such as an economic crisis, and is this shift structural? This paper uses a Difference-in-Difference (DID) approach to investigate whether services trade became more digital after the Global Financial Crisis (GFC) in 2008. It finds that the GFC formed an independent break from the previous period that turned services trade to become more digital – although there are signs that this somewhat already happened before 2008. Software-intense services such as R&D services, information services, computer services and charges for Intellectual Property Rights (IPR) saw on average a 6 percent higher increase in global exports compared to other non-digital sectors post-2008. Countries with higher internet usage and with already comparative advantage in these sectors saw this higher increase in digital trade. More striking is that in particular upper-middle income countries and countries with high manufacturing activity saw the sharpest shift into digital services trade after the GFC. These significant outcomes forecast a direction into which patterns of services trade are likely to turn after the current economic crisis resulting from COVID-19.
1. Introduction
How do trade patterns change after an external shock such as an economic crisis, and is this shift structural? What countries are likely to profit from such move, and can one make any predictions which countries are likely to see a further shift away from traditional sectors into digital services after the current crisis? Quotes in business media are clear that the Covid-19 crisis will significantly “accelerate digitalization and is serving as a catalyst for the growth of non-physical goods trade” (Bloomberg, 2020).
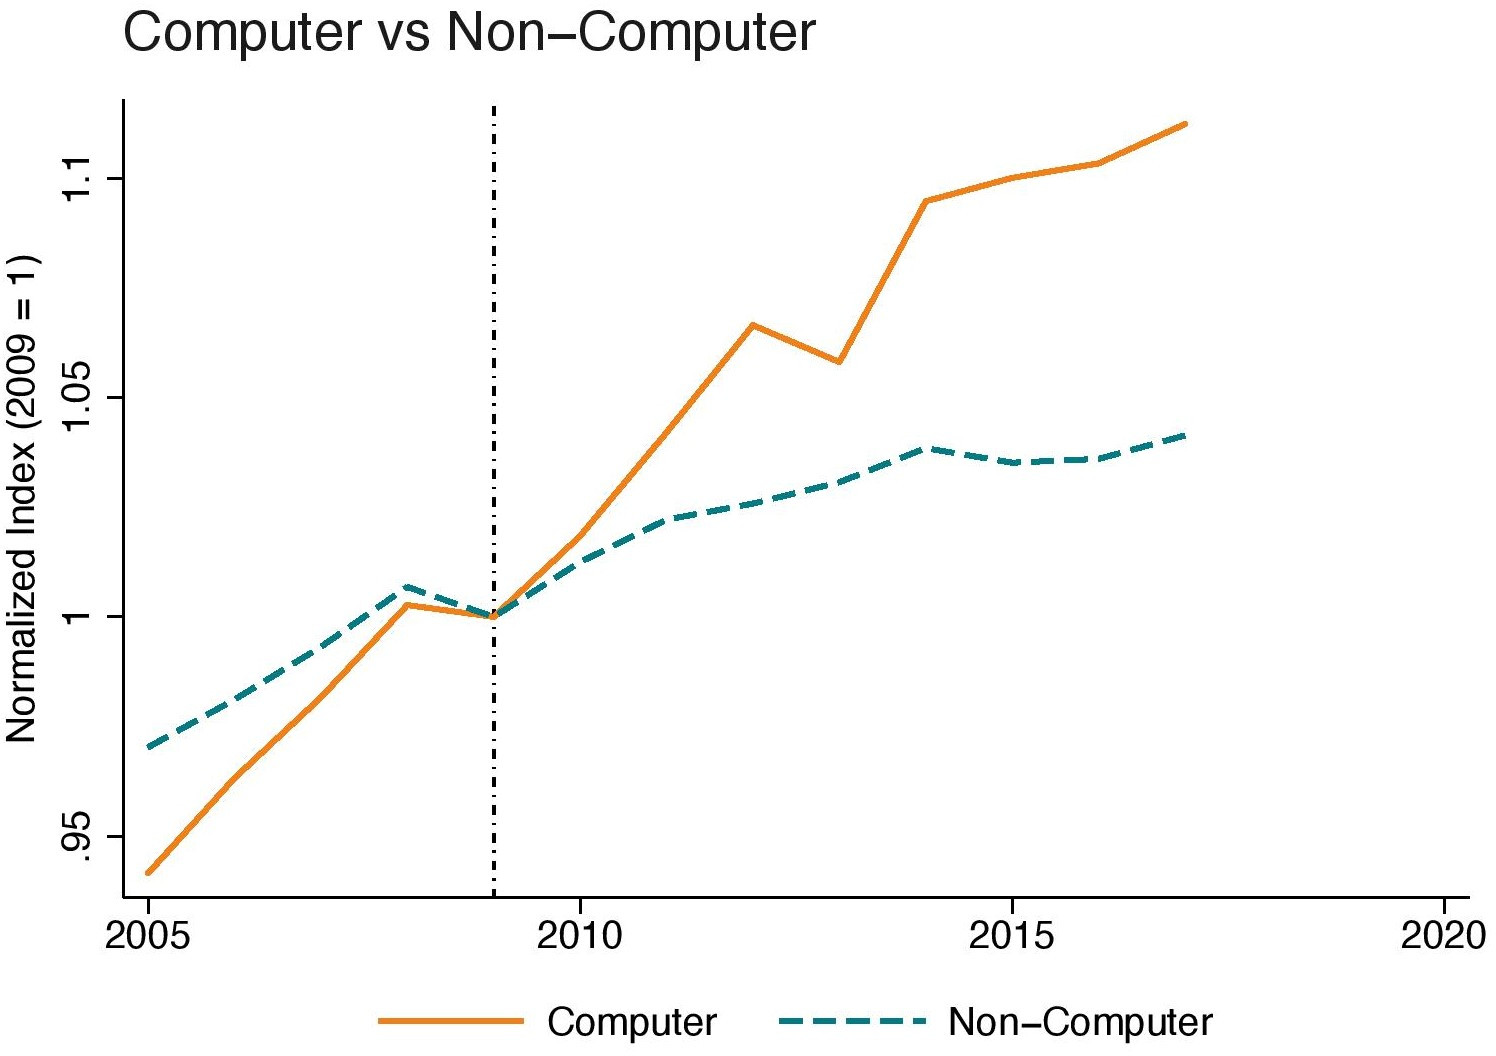
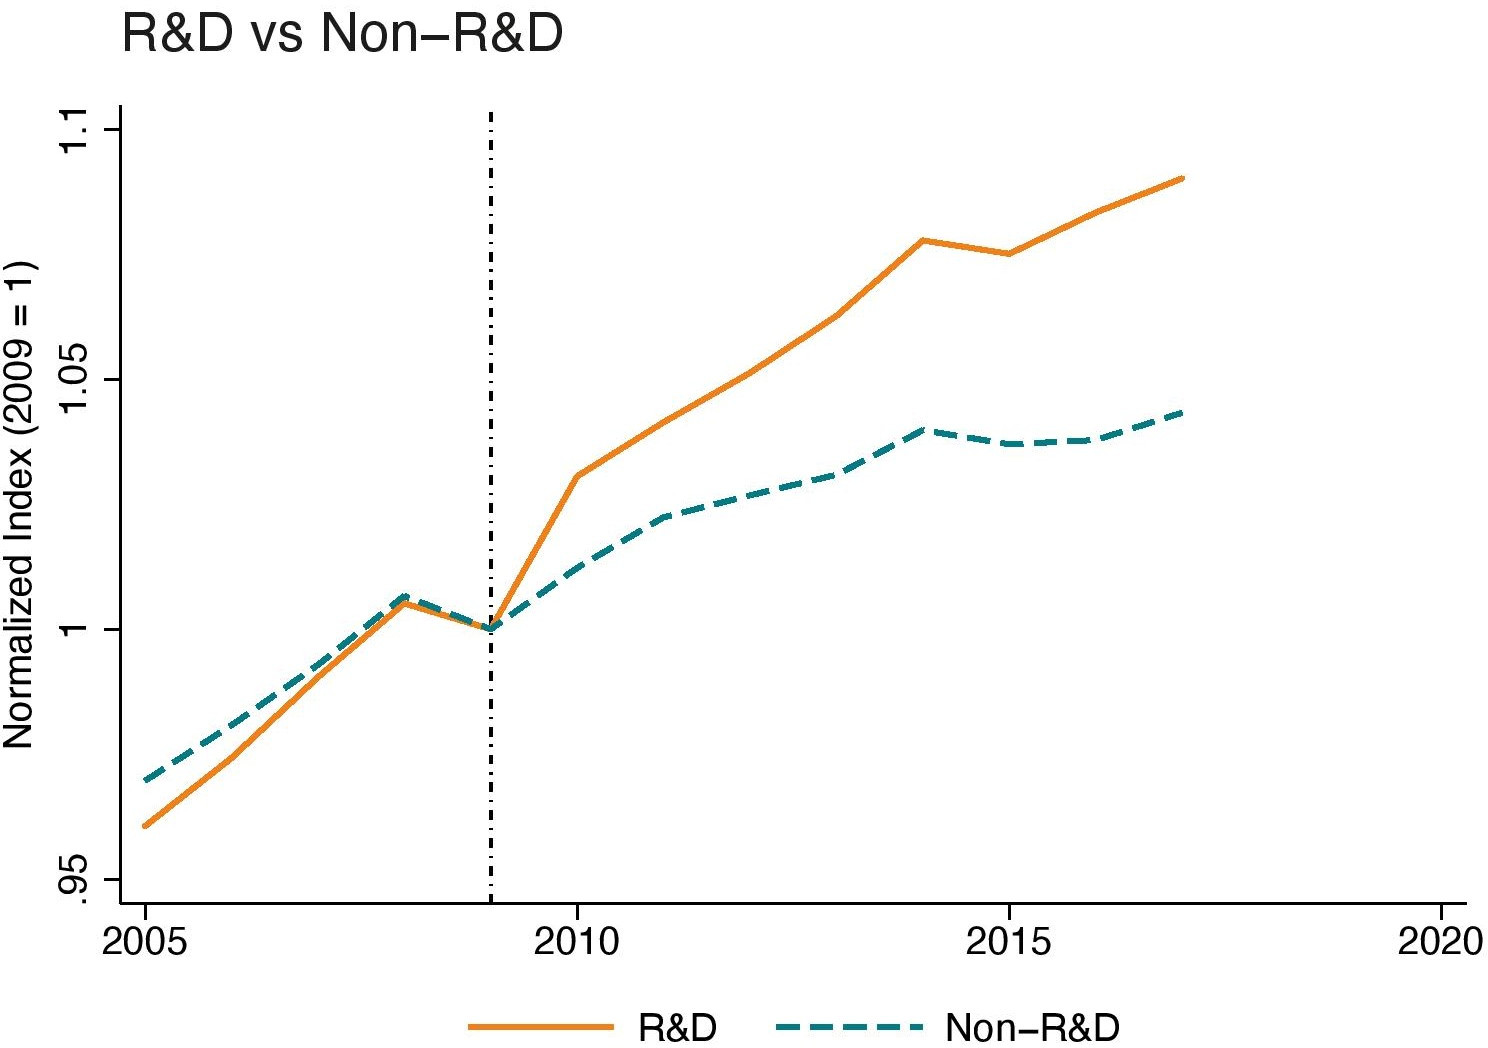
The rapid growth of trade in services, or trade in non-physical goods, is nothing new. Compared to their physical counterparts, they have been growing fast after the Global Financial Crisis (GFC) of 2008. Figure 1 and Figure 2 show for instance that computer and R&D services have seen a fast-flowing pace of exports after 2008 compared to the rest of the services economy. Both sectors are highly digitalized and utilized already before the current economic crisis a great amount of software technologies. And yet, it is largely expected that digitalization of goods and services will further escalate after Covid-19 with obvious implications for trade. This paper therefore asks the question: can we really expect the crisis to be a breaking point for countries to shift into intangible digital trade, and if so, which countries are more likely to do so on the basis of their economic characteristics?
The previous literature on the relationship between trade and the GFC is divided into two parts. Both parts largely entail empirical works. The first part assesses the impacts of the trade collapse of 2008-2009 related to goods and have investigated this from various angles, such as from the perspective of global value chains (di Mauro et al., 2012); financial frictions and trade finance that played a contributing role (Ahn et al, 2011; Amiti and Weinstein, 2011); credit conditions (Chor and Manova, 2012), or have assessed that the trade shock has in large part been due to a demand shock and can be traced back to product characteristics (Bricongne et al., 2012). Theoretical models had also been applied and tested and found that the trade collapse was in main part due to a reduction in efficiency of investment in durable manufacturing, pointing out to the changes in demand rather than productivity or trade frictions that cause the trade collapse (Eaton et al., 2016), something that Behrens et al. (2013) also concluded.
The second part evaluates the GFC from a services vantage point, although this strand of the literature is much smaller. One first important work was provided by Borchert and Mattoo (2012) which separate services into two groups: those services that are related to goods trade, such as transport services, which all suffered a major blow; and other modern services such as technical and professional services. The authors show that demand for these latter services are less cyclical, which they test with Indian data. Incidentally, these services are also much more receptive to ICT and other software technologies, something that this paper explores. A related paper by Ariu (2016) delved deeper into the reasons as to why services are more crisis resilient with respect to a short-term shock. The main explanation needs to be found on the demand side. Services have a different elasticity with respect to GDP growth, which in effect means that their demand structure is more or less continuous and stable (especially for modern services), because of their consumable nature (as opposed to durable).
This work is related to this nexus between services trade and the economic crisis of 2008, but takes a long-term view on a different question: did the GFC in 2008 mark a structure shift away from trading in traditional non-digital sectors into more digital and software-intensive services, and if so, what characterizes a country’s economy who did so? The way the analysis of this research question is done is to take a historical perspective as employed in Freund (2009) who was one of the first to investigate the role of the trade collapse from a longer time horizon. Due to good available services trade data, this paper only starts in 2005 and therefore investigates its main hypothesis with respect to one crisis only: the GFC of 2008. In doing so, this paper looks at services only to isolate any stagnating trends of goods trade after the crisis, which was particularly manifest in the form of lower trade elasticities (WTO, 2020). Although services have suffered a blow too (albeit digital-related services much less so), this recent slow-down falls outside the scope of our time period.
To explore this research question, this paper uses a Difference-in-Difference (DID) approach and investigates whether patterns of services trade became markedly more digital post-GFC. We therefore test whether the GFC represented a “break” in the patterns of services trade. If so, one could learn from how such pattern looks like for countries. Just as now, there are compelling reasons to believe that then digitalization took off speed for firms which, as a result, for instance, enabled them to continue to outsource digital activities as services are less cyclical (Borchert and Mattoo, 2010). For instance, in the wake of the GFC, the banking sector made substantial adjustments in their business models, forced by new regulations and lower profitability (Caparusso et al., 2019). This undoubtedly may have pushed the digitalization agenda even further in the sector. Indeed, on average this paper finds that compared to the previous period, the GFC formed an independent move that turned services trade to become more digital – although there are signs that this somewhat already happened before 2008.
Moreover, this paper also asks the question which countries have experienced a greater increase in digital services trade, and on the basis of which economic characteristics. Not all countries are equally able to profit from a change in patterns of services trade. For instance, some countries are equipped with an improved physical digital infrastructure, a higher share of internet usage, and have a stronger capacity to absorb new digital technologies. Equally, some countries naturally have an economic structure that is catered towards services. Given that services are generally more digital-intense than goods, one would expect these countries to profit more from digitalization. Therefore, on the one hand, they are expected to profit comparatively more from digital services trade after the current crisis. On the other hand, however, the future of manufacturing entails that many advanced economies are likely to experience technological breakthroughs. These innovations require digital services to flow across borders, such as in the case of cloud computing (Gaurav and Hallward, 2018).
Hence, this paper tries to find answers to these questions by extending our baseline regressions as part of the DID analysis. In particular, we examine whether countries belonging to a specific income group of economic development have experienced this rise of digital trade after 2008. In similar fashion, we also verify whether other economic characteristics can explain this move into digital services, such as theh extent to which countries have already comparative advantage in digital services, have a high share of the population using the internet, and whether countries with a higher share of services and manufacturing employment and value-added are the ones that have seen this digital trade shift post-GFC.
The results show that indeed, the GFC seem to have set a watershed moment for services trade to become more digital: the growth of digital services exports appeared to have started to outperform other non-digital sectors after 2008 by around 6 percent, which wasn’t significant before. Depending on which data source of services trade is being used, however, there are some signs that in fact this differential growth of digital services trade started somewhat before the crisis. Further, the extended analysis shows that countries with comparative advantage in digital services and a strong internet usage are the ones that have seen a greater increase of digital services trade. However, more interesting results are that in fact upper-middle income countries and countries with a strong manufacturing base in terms of employment and value-added have seen a more sizable gap in digital services trade growing faster than non-digital services.
Finally, the empirical results allow us to visualize all countries on a map and examine which countries are the ones that are likely to have caused this shift into global digital services trade. We map all countries based on their economic characteristics as used in the extended regression analysis. This exercise portrays a chart of countries and shows that Costa-Rica, Israel, Romania, Great Britain, Malaysia, Sweden and the Philippines all share these economic characteristics that made them to experience greater growth in digital services trade post-GFC. These countries are therefore well-positioned to benefit again from the continued growth of digitalization and trade in non-physical goods after the current crisis.
The remained of the paper is organized as follows. The next section sets out the baseline econometric strategy, which is achieved by way of using a DID analysis. In this section we also explain how this paper measures and classifies the group of digital sectors, which is done by their way of software-intensities over labour. Then, the third section presents the results of the baseline regressions and extends the analysis by including countries’ economic characteristics in the DID analysis. In doing so it finds out which type of countries have experienced this significant shift into digital services trade after the GFC. Section 4 lays out a mapping of these countries, and finally the last section concludes by discussing the results in light of the current crisis.
2. Empirical strategy
As said, the empirical strategy employs a Difference-in-Difference (DID) approach in which the outcome variable is regressed against a set of dummies that separate two groups for two time periods. The two groups are the treatment group, the other one the control group. As with a standard DID analysis, the treatment group is exposed to a “treatment” in the second period, whereas the control group is not subjected to the treatment during either time period.
In this paper, the outcome variable is services trade which is regressed on the treatment group that is composed of sectors that are classified as software-intense (see below) for the period after the GFC. More specifically, a dummy variable is assigned to software-intense sectors starting from the year 2009. The control group, the none-software-intense sectors, are not exposed to this treatment and therefore receive a zero during the entire time period in our regressions. The DID approach is therefore made up two levels of “differences”, namely the one that distinguishes between software-intense and not software intense services sectors; and another one that differentiates between pre- and post-GFC, i.e. before and after 2009. In more formal terms, we regress the following baseline specification:

In equation (1), the response variable is the logarithm of cross-border exports of services (SX) in country c, for service sector s in time t. Data is taken from two sources to check for consistency of results across the two data sets, which are the WTO-UNCTAD-ITC annual trade in services and the underlying trade in services data as part of the OECD TiVA principle indicators. Then, the term denotes the dummy variable that is of interest. It captures any difference in services exports between software-intense and none-software-intense services before and after 2009.
The fixed effects capture all other aggregate factors that would cause changes in services trade over time even in the presence of a policy change. They are specified at country-sector, , and country-year, . The former controls for country-sector specific conditions, such as endowment and technology structures of a country that affect specific sectors or even services policy; the latter controls for country-specific trends over time that affect the entire economy, such as macro-economic circumstances. Sector fixed effects are applied at the 2-digit aggregate as data are reported at this level in both data sources. Finally, is the residual term. Regressions are estimated with robust standard error clustered by country-sector-year and are performed over the period 2005-2015/2017 in a panel setting throughout. Hence, four years identify the pre-GFC period whereas up to nine year determine the post-GFC period.
The first source of services trade is the WTO-UNCTAD-ITC dataset which covers exports and imports of total commercial services. This data source covers 222 entities which include countries and regional aggregations/economic groupings from 2005-2017 at 2-digit level. The data is in line with the sixth edition of the IMF Balance of Payments and International Investment Position Manual (BPM6) as well as the 2010 edition of the Manual on Statistics of International Trade in Services (MSITS 2010). This entails that, compared to the BPM5 classification, major changes for the Balance of Payments (BOP) classification for services have been introduced with regards to financial intermediation services, insurance services, intellectual property and manufacturing and maintenance services.
The second dataset is from the OECD and forms the trade in services data for TiVA. This dataset goes beyond commercial sectors as it covers several personal services such as health and education. The data covers in total 16 2-digit services sectors for 66 countries of which a variety of OECD and non-OECD emerging countries for the period 2005-2015. The dataset has a self-constructed industry code which closely follows the ISIC Rev 4 classification scheme. Compared to the WTO-UNCTAD-ITC dataset, this data has fewer combinations within commercial services. For instance, the former also reports separate entries for R&D services, computer services and professional and management services, whereas the OECD dataset aggregates these sectors up into “Other business services sector”. Similarly, Finance and Insurance are separated in the WTO-based dataset, whereas with the OECD data the two sectors are combined.
2.1 Software-intensities
Software-intensities are measured using information on US sectoral software usage. Specifically, this paper takes the 2011 Census ICT Survey from the US, which reports data at detailed 4-digit NAICS sector level. This data is survey-based and records how much each industry and service sector spend in Mln USD on ICT technology in terms of hardware equipment and computer software.
The survey reports two types software expenditure: capitalised and non-capitalised. We select both types of expenditures as both components inform us about the degree to which sectors are digital-intense. Capitalized expenditure is closer to the concept of intensities with respect to labour and capital as a factor of production, as used in the academic literature (e.g. Romalis, 2004; Chor, 2011). Non-capitalised expenditure instead relates more to the input support of firms which enters in the production function as intermediate inputs. Capitalised expenditure is comprised of longer-term investments made in computer software. It excludes purchases and payroll for developing software as well as software licensing and services, and maintenance agreements for software, which are all components that are measured as non-capitalized expenditure.
The year 2010 is selected for computing software-intensities. Choosing this year avoids the risk of being endogenous to the trade data as it lies in the middle of the time period. Software expenditure is divided over labour, for which we also use data for the year 2010. Data for labour is sourced from the US Bureau of Labour Statistics (BLS). These software-intensities are therefore similar to the ones computed in Ferracane and van der Marel (2020). For our DID analysis all we need is an indicator that assigns unity to a services sector that is assessed as software intense. In doing so, we determine a services sector as software-intensive on the basis of whether a 2-digit sector shows a software-over-labour ratio which is higher than the sample median. Sectors with a ratio below the median are assigned a zero.
Intensities are computed at 4-digit NAICS level and then concorded into 2-digit BPM6 and ISIC Rev. 4 depending on the trade data used in the regressions. Because no concordance table exists between NAICS and BPM6, a self-constructed matrix is used. Numbers are aggregated at 2-digit BPM6 level by taking the simple average. Note that one sector forms a mismatch between the two classification tables, which is Intellectual property / Royalties and license fees. This category is neither reported in the US Census nor in the BLS database. Nonetheless, this sector is important as it covers, among other items, patents, trademarks and copyrights, all activities which are digital-intense and for which the trade data records high levels of services exports. Therefore, we have developed our own concordance table to include this sector. Details of this procedure can be found in Annex 1.[1]
Table 1 and Table 2 show the selection of sectors that are classified as software intense following the WTO-UNCTAD-ITC and TiVA classifications respectively. In Table 1, Telecommunications, computer services and information services are natural outcomes given that these sectors are highly digital. Information services cover activities such as data processing services and web search, which are all highly intensive in the usage of software. Both financial and insurance services are also assessed as great users of software compared to labour. The two sectors are more broadly considered as very digital intense given that over the years internet technologies have massively changed the financial services industry.[2] This selection of sectors is extended with additional services that are commonly understood as digital-intense but are not strictly measured above the median, although they do when using other metrics such as the mean instead. They are shown in subsequent columns and are R&D services, Technical and other business services as well as audio-visual services.
We repeat our assessment of sectors as software intense for also the OECD TiVA classification, which is based on ISIC Rev 4. Table 2 shows which sectors fall above the median of our computed software-intensity after concording between 4-digit NAICS and 2-digit TiVA categories. Again, telecommunications and IT and other information services are classified as software intensive. The sector of publishing and audio-visuals is classified as software intense as well. Although this category also contains audio-visuals, which in Table 1 is not included in our primary selection, the sector also holds various other digital activities such as software publishing and sound recording which are high in the usage of software. For this table we start with this narrow definition of software intense services, and gradually add additional sectors, such as financial and insurance, distribution, and other business services.[3]
[1] The concordance table between 4-digit NAICS and 2-digit BPM6 can be obtained upon request. Admittedly, the inclusion of intellectual property / royalties and license fees as a service is a BOP decision and some debate exists whether this is truly a service. In addition, for some countries, this may also reflect tax and transfer pricing as drivers of observable trade in this sector. However, since this sector is included in all publicly available data sources recording trade in services, we prefer to include it. Nonetheless, in our regression we have also dropped this sector entirely as additional (unreported) robustness checks. Results do not alter in any way apart from slight coefficient size changes. Results are available and can be obtained upon request.
[2] Another non-ICT sector that is shown to be very software-intense is the retail sector. However, neither the US Census nor the BPM6 classification shows a separate entry for retail or wholesale distribution services, which is the reason why this sector is omitted in our analysis of intensities and is not covered in our regression analysis.
[3] The sector distribution is not shown in the WTO-UNCTAD-ITC database, but is nonetheless measured as high in the usage of software, in particular retail services. In Table 2, business services are selected to accommodate the inclusion of Technical and other business services and R&D services in Table 1, which are part of this sector.
3. Regressions results
The results of the baseline regression equation are reported in Table 3 and Table 4 for the WTO-UNCTAD-ITC and OECD TiVA data respectively. The columns in both tables are presented in correspondence with the columns in Tables 1 and 2 in which we categorize the different digital sectors. In Table 3 the coefficient result in column 1 shows a positive and strongly significant outcome. This indicates that the period after 2008 saw a significant increase in exports in sectors classified as digital. Subsequent columns in the table report the coefficient results when gradually adding other digital sectors. In all columns except column 4 the coefficient results are also positive and significant. Adding technical services to the list of digital sectors in column 4 shows however and insignificant result.
The results in Table 4 show in similar manner a positive and strongly significant outcome, except in the last column when the sector Arts, entertainment, recreation is appended to the list of digital sectors. As noted in the table, the time coverage is slightly shorter because of the limited number of years available in the OECD TiVA dataset. Note that even though the classification list of sectors does not entirely overlap from column to column between Table 3 and Table 4, a striking comparison appears between the coefficient sizes reported across both tables. Specifically, the closest list of digital sectors that is comparable between the two data sources is in column 5 of Table 3 and column 3 of Table 4.[1] Comparing both results in the two columns reveals an almost identical coefficient size, namely 0.64 and 0.59.
In economic terms, by taking these two coefficient results and computing the expected values implies a trade impact that ranges between 6.1 and 6.6 percent. It suggests that digital services sectors have experienced a higher increase of exports of about 6 percent compared to non-digital sectors in the years following the GFC, i.e. after 2008
3.1 Results by year
A legitimate question is however whether the GFC truly caused a take-off in trade for digital services compared to other non-digital sectors. On the one hand, as discussed above, there is literature that indicates that the crisis-resilience of services during 2008-2009 was in large part due to their digital nature which kept firms to continue outsourcing these services with the use of software. The crisis could therefore have intensified the development of digital technologies and increased trade in services that were able to become digitalized and delivered across borders. On the other hand, digital technologies are often not unique to a specific crisis or any other period, as their development is a continuous process and the process digital innovations typically takes time. In that scenario, one would expect the growth of digital and other digitalized services trade to set off before 2009.
In order to assess exactly around which year trade in digital services started to grow faster than in other sectors, we regress the baseline specification with an extension to take stock of the yearly effect. In doing so we regress the following equation:

In equation (2), we regress the dummies for software-intense sectors with a dummy that signify every year in our dataset and as provided in the equation. We do this except the first year 2005 so as to have a starting point and to avoid multicollinearity in the data due to the inclusion of the fixed effects. The coefficient of interest is the term that measures yearly trade effect between 2006-2015/17. The term captures on a year-by-year basis whether trade in digital services was positively different in regard to other non-digital sectors compared to 2005. If the coefficient results are positively significant as of the year 2009 and/ or after, it implies that digital services trade did really take-off post-GFC. In the event we find positive and significant coefficients before 2009, it would suggest that the increase of digital trade compared to other sectors is indistinguishable between the two periods.
The results of the yearly effects using data from the WTO-UNCTAD-ITC can be found in Table 5. The results in columns 1-5 follow the same order as in the previous tables. The results in column 1 suggest that the narrow definition of software-intense services have a significant impact as of, not before. Moreover, this coefficient sizes grow in importance across years indicating that the gap between trade in digital and non-digital services become bigger over time. When expanding our list of digital sectors in columns 3 and 5 also positive and significant results are found after 2008. Again, in both columns the growth of digital services grows faster over time. No significant results are found in columns 2 and 4 however when either financial services or technical services are added to the list of digital services. The insignificant findings when adding technical services is consistent with the results reported in Table 3. Figure 3 presents the trade difference in percentage terms for all years and categories of digital services.
The results using the OECD TiVA data are reported in Table 6. Overall, most significant coefficients are found after the GFC, but some differences appear compared to Table 5. First, for the narrow definition of digital trade in column 1, significant results are only found as of 2014. Second, in all digital sector categories significant coefficients are reported. Moreover, the shift of digital services growth seem to have taken place already somewhat before 2009 as significant results are also found before this year, in particular in column 3 and 4. When adding the sector of arts (in lieu of distribution) in column 5, this result becomes insignificant for the year 2007 and only weakly significant for 2008. In short, the year-on-year result from the regressions suggest that digital services trade started to grow faster compared to other services already somewhat before the GFC of 2008, namely in the year 2007.
Figure 4 graphically illustrates the trade difference in percentage terms. The graph shows that out of the five definitions of software-intense services, two definitions show a higher trade impact that lies within a range of 5-10 percent. Besides, as we move further away from the year 2009 in time, this trade difference tends to more substantial, albeit with a time lag. The figure shows that especially from 2012 onwards, the level of trade in digital services grew more pronounced compared to other services.[2] Given that our preferred list of software-intense services is captured in column 3, the results therefore need to be compared with the results in column 5 of Table 5. This time too, the two coefficient sizes are remarkably similar, ranging between 1.38-1.44 between 2015 and 2017, which comes down to a trade difference in favour of digital services of around 15 percent.
3.2 Synthetic Control Method
The following sub-sections perform additional robustness checks and extended analyses to our baseline regression from equation (1). These extensions follow the methodologies and additions as presented in Freund et al. (2020) and Manelici and Pantea (2020) that also uses a difference-in-difference strategy as baseline. Specifically, first a Synthetic Control Method (SCM) is performed to complement the difference-in-difference analysis. Then, the regressions are expanded with country-specific characteristics to extend the baseline results (next section).[3]
To perform a SCM, we need to choose between two the trade data sources. One requirement to perform the SCM regressions is to have a full square matrix of trade data, which is almost given with the OECD TiVA data. Although the number of services sectors is fewer than in the WTO-UNCTAD-ITC database, the OECD data reports more trade values by country-sector-year so that after dropping all empty cells in the dataset eventually more observations are retained.[4] An additional requirement of this method is that an independent variables is added as a covariate. Freund et al. (2020) choose to add lagged trade variables which will be done for this specification too for 1 and 2 years. Moreover, given that the rise of services trade is strongly connected with a general shift of economies into services activities (see for instance Sáez et al, 2015), we also add services production and value as an additional independent variable. We use these two covariates separate when performing the SCM.
To implement this methodology, we follow the practise as outlined in Galiani and Quistorff (2018). This method conducts so-called placebo estimates in space, which means estimations are run for the same treatment period for all other control units. We also infer p-values as computed in Cavallo et al. (2013), Abadie et al. (2015), which determine the statistical significances by running placebo tests. We set the randomly placebo treatment groups at 5000, as in Freund et al. (2020) and Acemoglu et al. (2016). Note that unlike Cavallo et al. (2013), we are not interested in multiple events as there is only one time in point that form the basis of our hypothesis, namely ≥ 2009. However, we are interested in multiple treatments as our selection of digital sectors span more than one industry. This option is available in the package as developed by Galiani and Quistorff (2018). We select the digital sectors from the category “Digital + Bus.” in Table 2 as the treatment sectors and compare the outcome with the synthetic non-digital sectors which are called in the SCM the “donor sectors”.
The graphical results of the SCM analysis can be seen in Figure 5. We show the results of three different specifications: one in which the log of production for each services sector is used with two years lag of trade values (SCM 1), a second one in which the log of value is used with two years lag of trade (SCM 2) and third, one in which the log of production is used with one year lag of trade (SCM 3). The panels show the evolution of digital services compared with other synthetic sectors (i.e. donor sectors). From 2008 onwards, the gap between digital services and the donor sectors experienced a marked growth, even though the gap appeared to have increased somewhat before. In 2015, six years after the break, exports in digital services had expanded 0.21 times (SCM 1) to the year 2008, and relative corresponding growth for the synthetic sectors across all countries. This estimate does not differ much from the estimate found in Table 6 for the year 2015, namely 15 percent. The associated p-values for the SCM regressions can be seen in Table 7. Typically, p-values are given for the years starting the treatment, i.e. 2009. It shows that the statistical trade difference is significant.
3.3. Extended baseline results
We also extend the analysis following Freund et al (2010) to include country characteristics in the baseline regression equation with the aim to find out what type of countries have benefited from the growth of digital services trade post-GFC. The way in which this is done is to interact a vector called that consists of variables measuring the economic country characteristics. This vector is then interacted with the difference-in-difference dummy that signifies the group of digital sectors from 2009 onwards. In more formal terms, we augment the baseline specification as follows:

As stated in equation (3), we split up our country variables into quartile groups in which the Q1 and Q1 are the two groups that performs above the group median, whereas Q3 and Q4 are the two groups below the median. We apply this quartile groups in most cases, except when groups are already predefined by a database. Note that these country groups are denoted with and in large part vary by country-time, except when specifically indicated. In all country clusters, whether they are measured in quartiles or pre-determined for several occasions, we apply group fixed effects respectively as represented by in equation (3). All other terms in the equation remain unchanged and follow the baseline specification. In similar manner as before, we report results in sequential order by progressively adding digital services corresponding to Table 2.
The country-specific economic variables which and which are measured in vector in equation (3) and are therefore used in the interaction terms are: World Bank income groups classification, revealed comparative advantage (RCA), internet usage, as well as services and manufacturing employment and value-added. All variables used and their summary statistics can be seen in Table B1 onwards in Annex B.
Income Groups
The first country-specific variable categorizes countries into income groups. We use the World Bank’s classification of income group in which the institution categorizes all countries’ economies around the globe into four income clusters, namely high (H), upper-middle (UM), lower-middle (LM), and low-income (L) countries. Assigning countries to each group is performed on a yearly basis and is done with the help of Gross National Income (GNI) per capita (in current USD) using the Atlas method. The list of countries belonging to an income group therefore differs per year. The four categories are used for our extended regressions of which the results are shown in Table 8.
In this table, the group of upper-middle income countries obtain a positive and highly significant coefficient result throughout all digital sector specifications. The list of countries falling in the middle-income group are for instance Argentina, Costa Rica and Malaysia. In column 3 covering the preferred list of digital sectors the coefficient result for the high-income group is only weakly significant. High-income groups include countries such as Hong-Kong, the UK, the USA and Japan. In all other country groups, no statistical significance is found. Note that the trade difference is economically more important for the middle-income group than for the high-income group. Figure 6 sets out these computed trade differences in digital service trade for each income group, with the coloured bars indicating when this trade impact is significant. Upper middle-income countries have experienced an increase in digital services trade that was 15 percent higher than non-digital sectors following the GFC, a more than threefold increase compared to high-income countries where this growth was only 3.25 percent.
Revealed Comparative Advantage
A country enjoys comparative advantage when it is relatively productive in exporting a particular good or service compared to all other industries and sectors. The trade literature has established a measure, called revealed comparative advantage (RCA) to measure this relative export productivity, originally developed by Balassa (1965). An RCA index with a value of 1 typically indicates a country has a comparative advantage. We use this measure and divide the index across four groups: one group of countries called super RCA, which have a value that is higher than 1 and above the median value that is created for all countries with an RCA higher than 1; a second group with an RCA higher than 1 but below this group median (called strong RCA); a third group with an RCA lower than 1 (indicating comparative disadvantage), but still having a value higher than the second group median that is created for all countries having a value lower than 1 (called median RCA); and finally a group of countries with a value lower than 1 and lower than this second group median (called weak RCA). Note that the RCA variables is defined by sector.
Results are presented in Table 9. What becomes immediately clear is that the group of countries with a strong RCA have a positive and significant coefficient result, whereas the group with a super strong RCA have only a weakly significant outcome. Moreover, in the preferred specification, the former group also shows a slightly greater economic impact, as shown in Figure 7. These are countries having a strong comparative advantage in IT-services such as Romania, Bulgaria, Luxembourg, Estonia, Argentina and Morocco. Or for countries having a strong RCA in publishing and broadcasting such as Malaysia, Hong Kong and Singapore. However, surprisingly the group of countries with an even greater trade impact are the ones with a weak comparative advantage in digital sectors. Depending on the specific digital sector, these are countries such as Vietnam, Colombia and Brazil. They have a very low comparative advantage in digital sectors and yet appear to have seen one of the highest growth rates in digital services trade compared to non-digital sectors post-GFC.
Internet Usage
The availability and usage of physical digital infrastructure is likely to be strongly associated with the extent to which countries have seen a higher growth rate in digital services trade. This is something that is accounted for in our regressions too and the results are reported in Table 10. We use the World Bank / ITU indicator of internet usage as a percentage of the population.[5] Ideally, other indicators that represent more strongly digital infrastructures that form a source for digital services trade would be used such as the extent to which data centres are prevalent in a country (van der Marel, 2020), but due to our time period this is not possible. However, digital internet usage is typically highly correlated with other types of digital infrastructures such as the presence of IXPs and data centres.
Looking at Table 10, what again becomes clear is that not necessarily the ones with the highest levels of internet usage have seen a significant higher growth rate in digital services trade, i.e. the super users, as they show a weak significance. Instead, the second category of strong internet users as well as the medium users show a significant coefficient result that is much stronger. This pattern is also reflected in the economic impact across the three groups. As presented in Figure 8, the super users have only seen a modest growth of digital services trade of around 4 percent, whereas the medium users almost double this rate. The group of medium users are for instance Saudi Arabia, Kazakhstan, Italy, Hungary, Russia, Malaysia and Costa Rica. The fourth group with the weakest internet usage has seen a decline in digital services exports although this result is not precisely estimated. This group consist of, for example, China, Cambodia and Turkey.
Employment
A more structural indicator of economic characteristics is employment. Typically, advanced countries have an employment pattern in which the majority is found in services. The share of services employment tends to decline for countries further down the development ladder, where manufacturing and agriculture still employ a larger share of the population. On average, high-income countries have a services employment share of 75 percent, middle income countries of 46 percent and low-income countries 26 percent. Employment patterns in manufacturing have a reversed configuration even though differences between income groups are less pronounced. High-income countries share an industry employment of 22 percent, middle income countries between 22-26 percent, and for low-income counties this share a however much lower, around 12 percent. Differences within groups are visible too. For instance, in the US the share of industry employment is 19 percent, whereas for Mexico and Italy, two other OECD economies, this share is much higher, namely 26 percent.
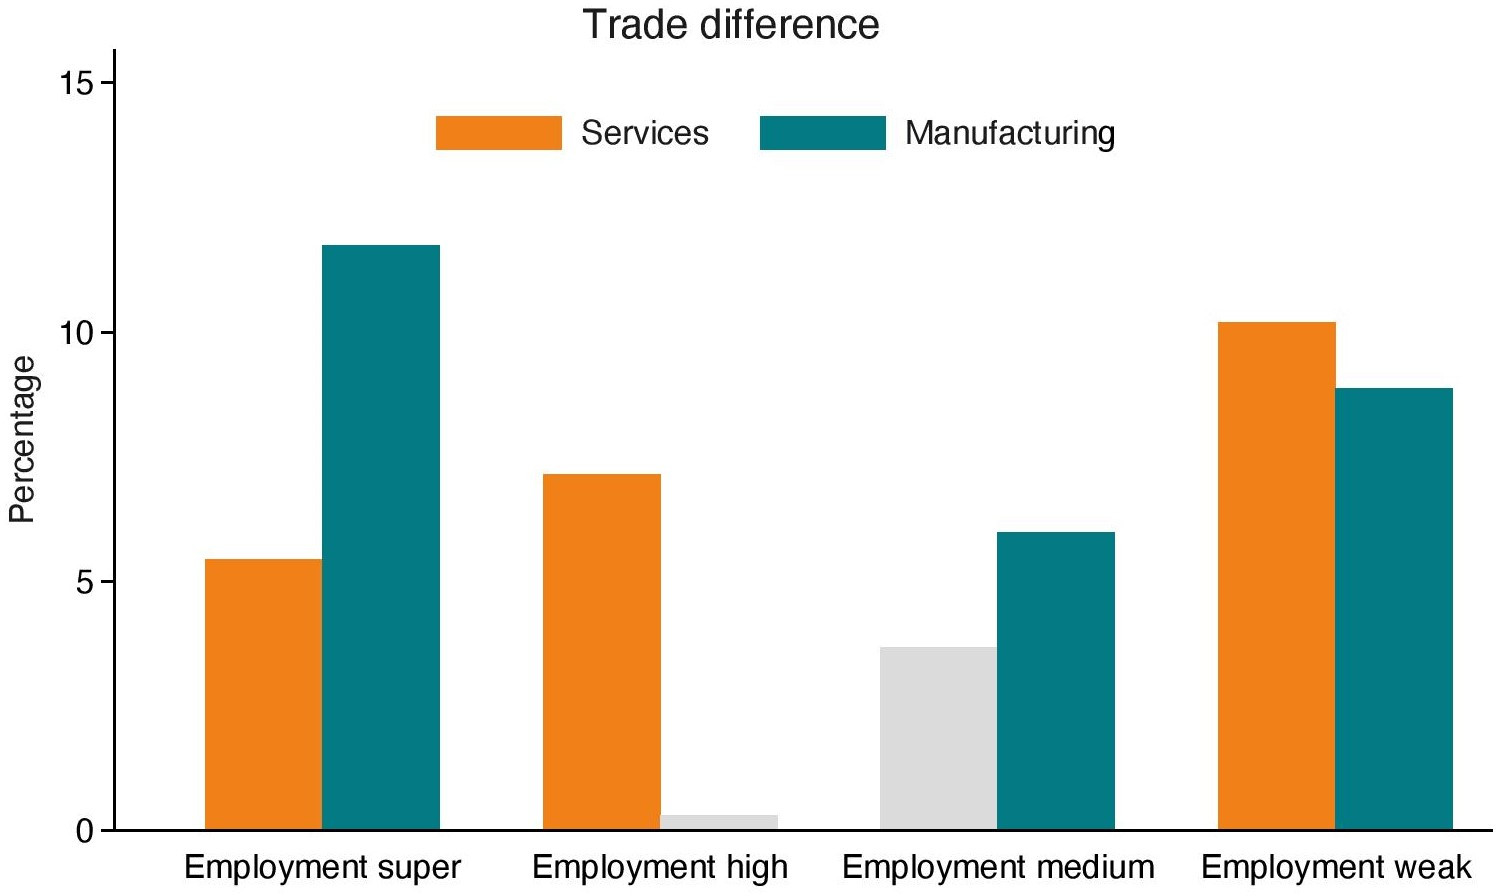
Table 11 and Table 12 show the regression results using employment shares for both services and manufacturing respectively. Table 11 reports that the results are significant for all but the third group of countries with medium levels of services employment. This is also true for the preferred specification of digital services in column 3. The results imply that the digital trade benefits as of 2009 have been relatively spread across countries with different levels of employment levels. Further, when looking at manufacturing employment instead in Table 12, this pattern becomes more concentrated in the sense that countries with highest shares of manufacturing employment obtain a highly significant coefficient result. Significant results are however also found for the countries with very low employment shares in manufacturing. In economic terms, the countries with the highest shares in manufacturing employment exhibit highest digital trade increased compared to other sectors, as shown in Figure 9.
Value-Added
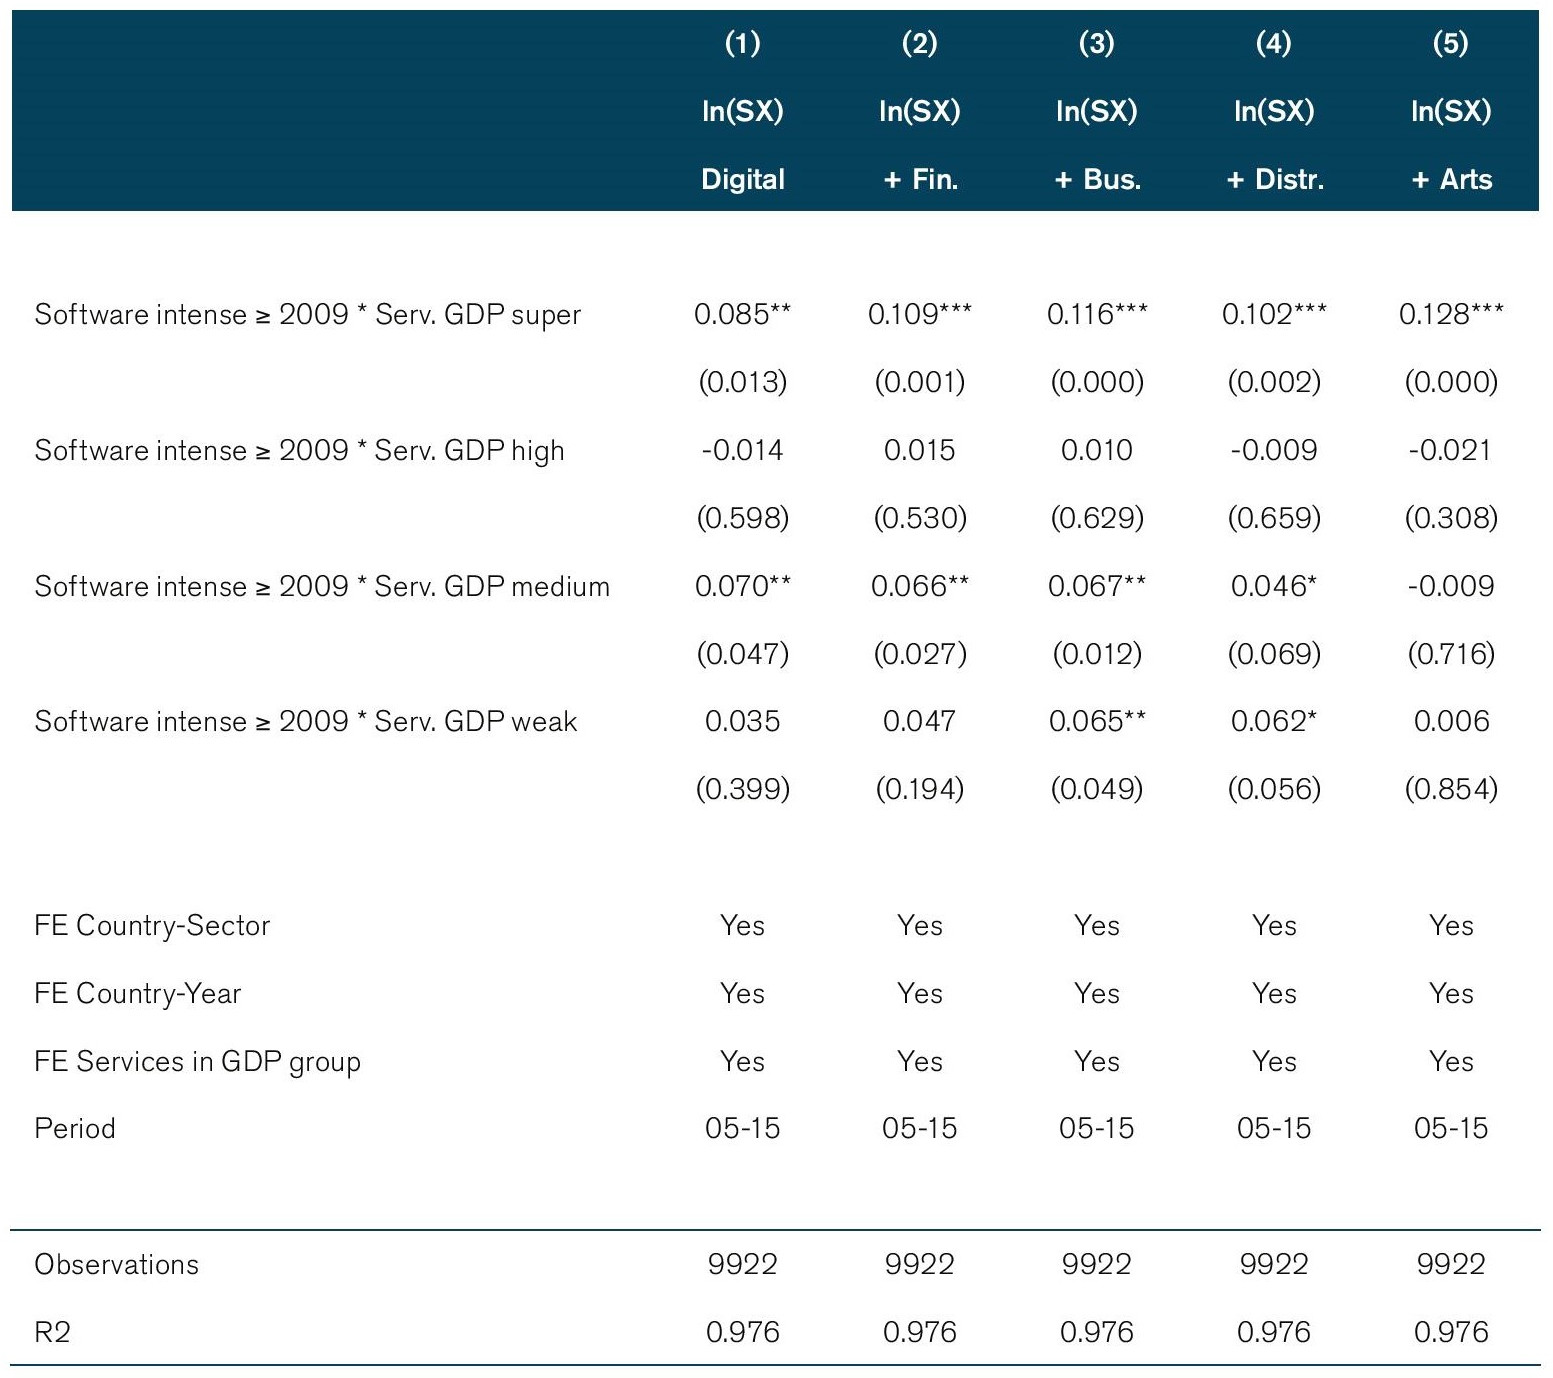
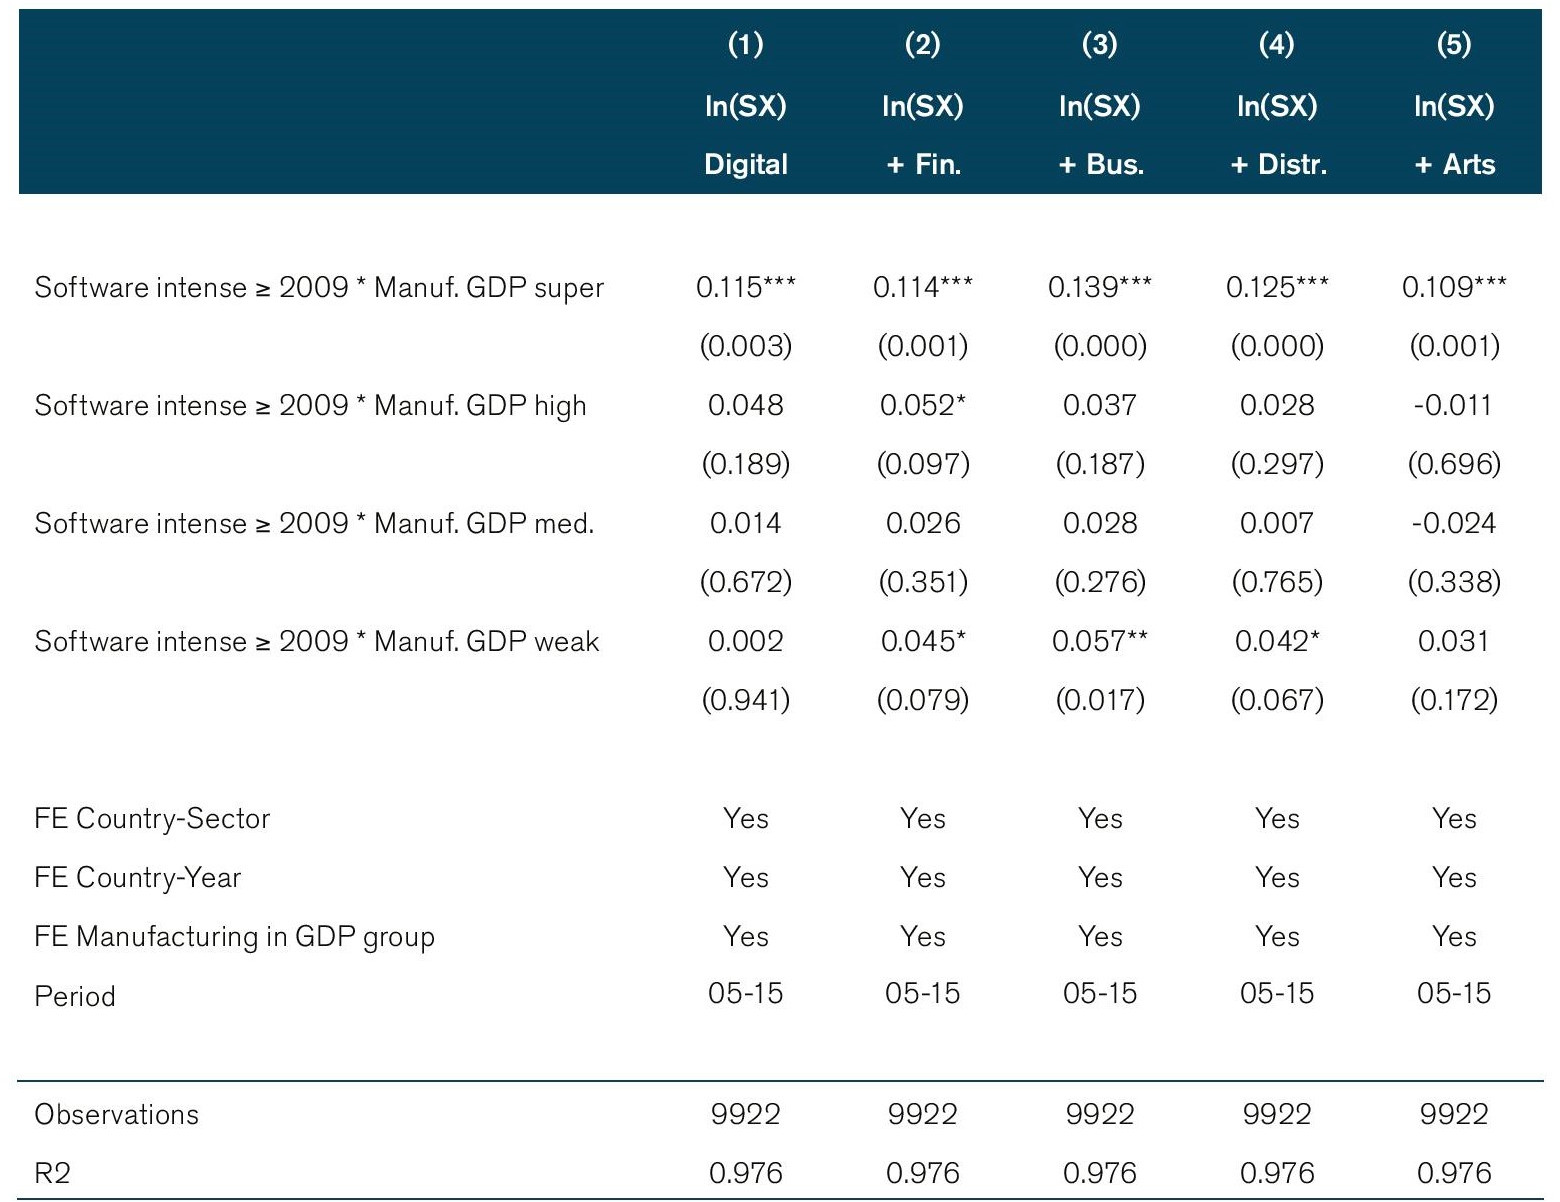
In similar manner, instead of employment we include the extent to which countries generate value-added from the services and manufacturing sector. A high services or manufacturing employment may come in tandem with high value-added generated from these sectoral activities. However, that’s not always the case as typically this outcome depends on a country’s productivity rate. The results of including services and manufacturing value added are shown in Table 13 and 14 respectively. The variables for value-added are given as shares in GDP.
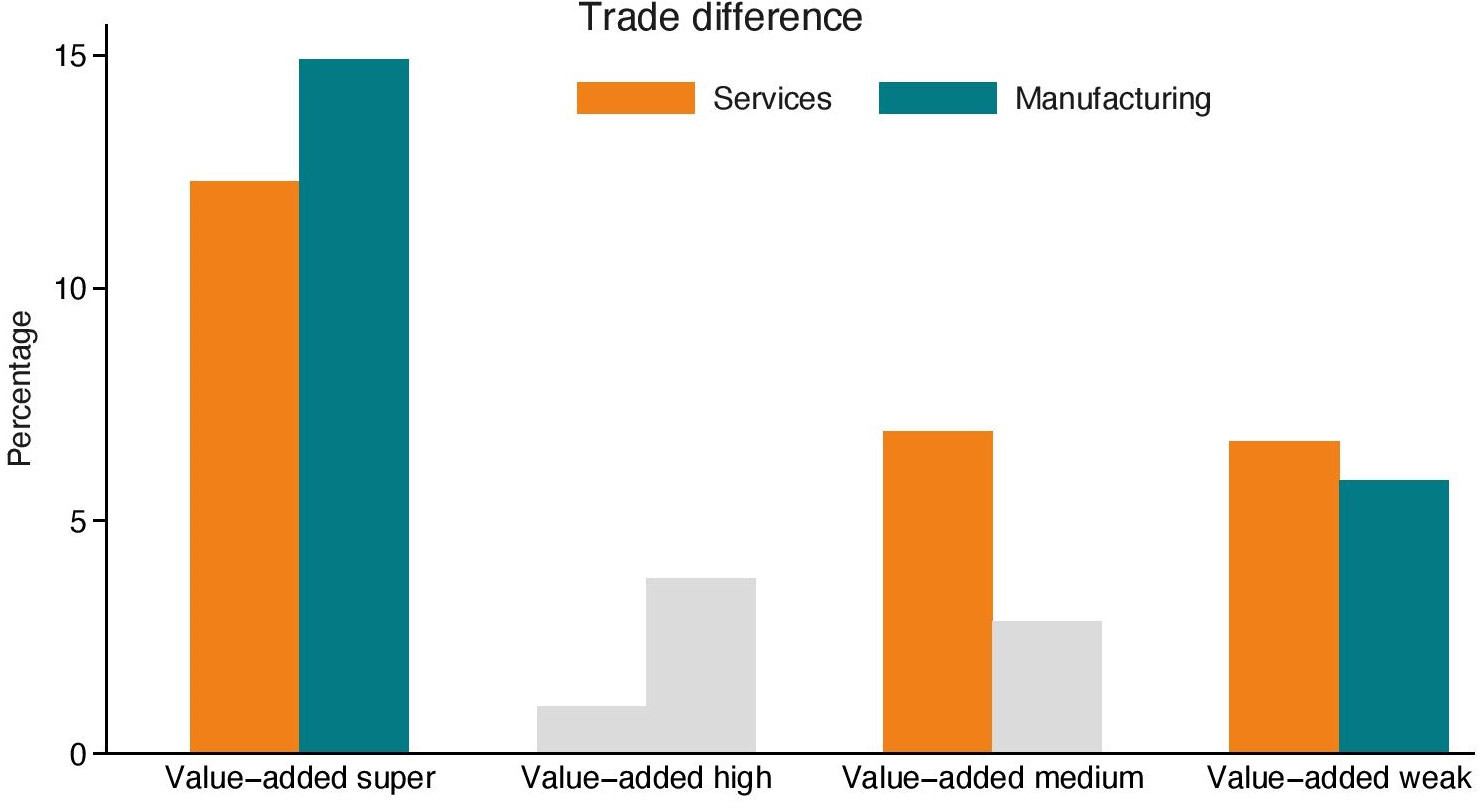
Both tables show that countries with a super high level of value-added originating from either services or manufacturing exhibit strong significant results, suggesting that these two group of countries have seen strongest trade growth in digital services as of 2009. Interestingly, significant growth rates are also seen for the group of countries that have low services or manufacturing value-added in their GDP. One potential explanation is that countries with low services value-added in GDP must by default have a higher manufacturing value-added in GDP and vice versa. Interestingly, when comparing Figure 10 and Figure 9, countries with greatest manufacturing activities in terms of both employment and value-added reveal to have experienced strongest trade growth in digital services.
Imports
As a final extension, we also check whether countries have experienced a higher increase in digital trade with respect to imports as opposed to exports. We use similar baseline regression as for exports using the TiVA and WTO-UNCTAD-ICT data but now for imports as both data sources also report this type of flow. The results from the TiVA data are reported in Table 15. In there, it becomes clear that for all digital sector specifications the results are highly significant, but in particular in columns 1, 3 and 5. The preferred specification is in column 3 in which a coefficient size of 0.104 implies a positive import effect post-GFC of around 11 percent. This percentage is much higher than the 6 percent found for exports in Table 4. When using trade data from WTO-UNCTAD-ITC a similarly large coefficient result is found (output omitted).[6] The preferred sector specification using this data source generates an coefficient result of 0.111, which implies an difference in trade impact of 11.74 percent.
We also develop an extended baseline specification for imports for the four income groups. The results are reported in Table 16. As in the previous table, all coefficient results are significant suggesting that countries of all levels of development have seen a greater or lower level of digital services imports post-GFC compared to non-digital sectors. However, s sharp difference occurs between the first three income groups of high-income, and upper-middle and lower-middle groups, which all have seen a strong increase in digital services imports, compared to the group of low-income countries which has experienced a markedly lower growth in digital services imports with respect to other non-digital services. This latter group of countries therefore saw a stronger import increase in other types of services falling outside the realm of digital sectors. This effect for low-income countries was relatively big as Figure 11 reports.
[1] This corresponds to column “Digital + Audio” in Table 1, and column “Digital + Bus.” in Table 2, respectively.
[2] Note that the bar indicated in light-grey indicate the insignificance of the coefficient results reported in Table 5.
[3] The SCM was first developed by Abadie and Gardeazabal (2003) and has subsequently been used in various other papers such as Abadie et al. (2010, 2015), Cavallo et al. (2013) and more recently Acemoglu et al. (2016).
[4] Generally, the OECD TiVA trade in services does not report trade values for the sector Private households for many countries and for some countries also other personal services such as education and health.
[5] The often-used variables of secure internet servers (share population) was also used in the regressions, but data for this indicator only starts in 2010, which is not sufficient as this year lies after 2009, our starting year of interest.
[6] Due to the high number of tables these output results are omitted, but available upon request.
4. Mapping Countries
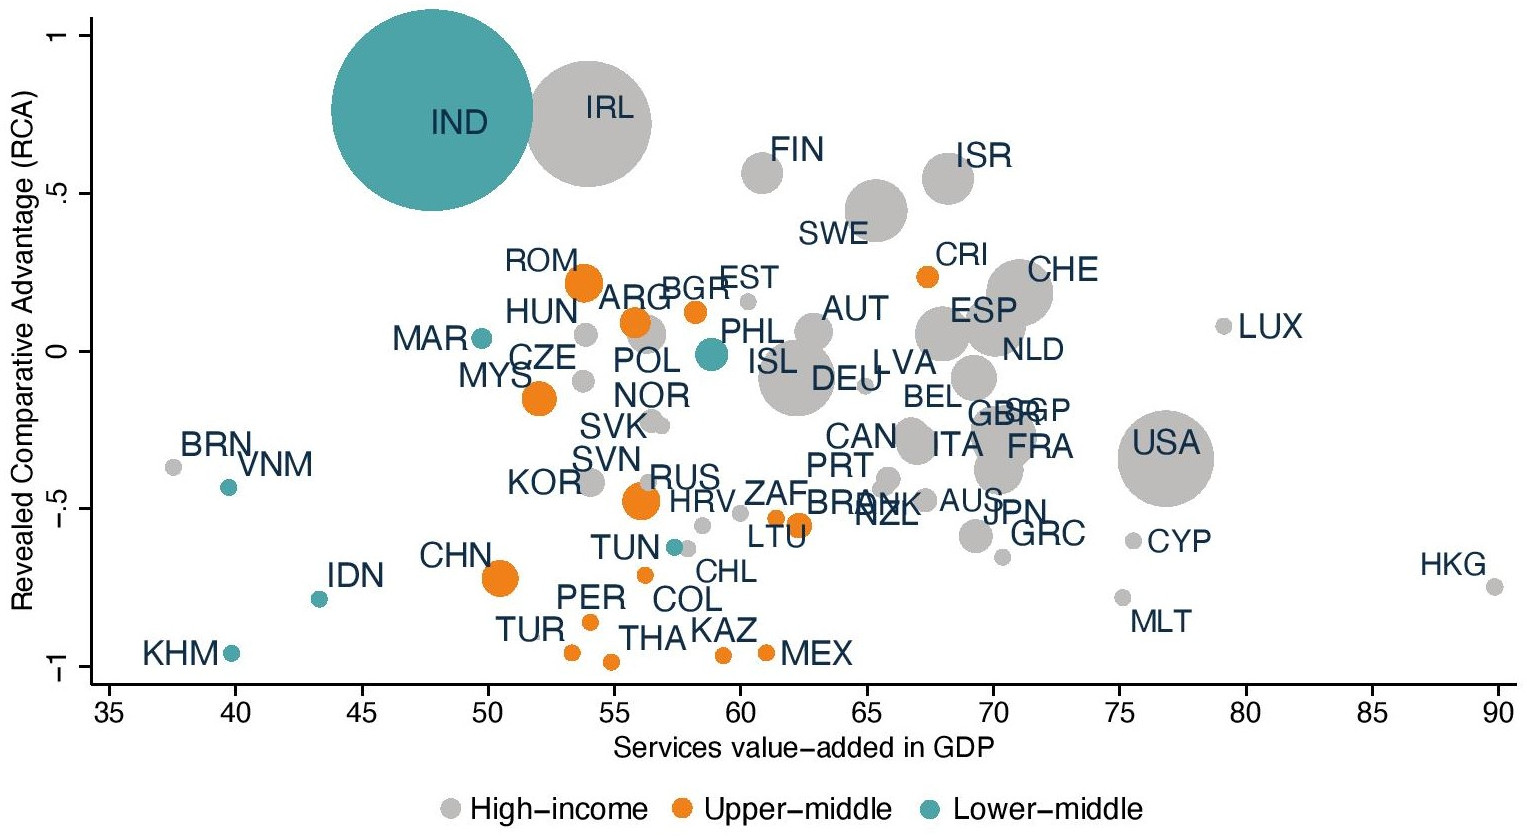
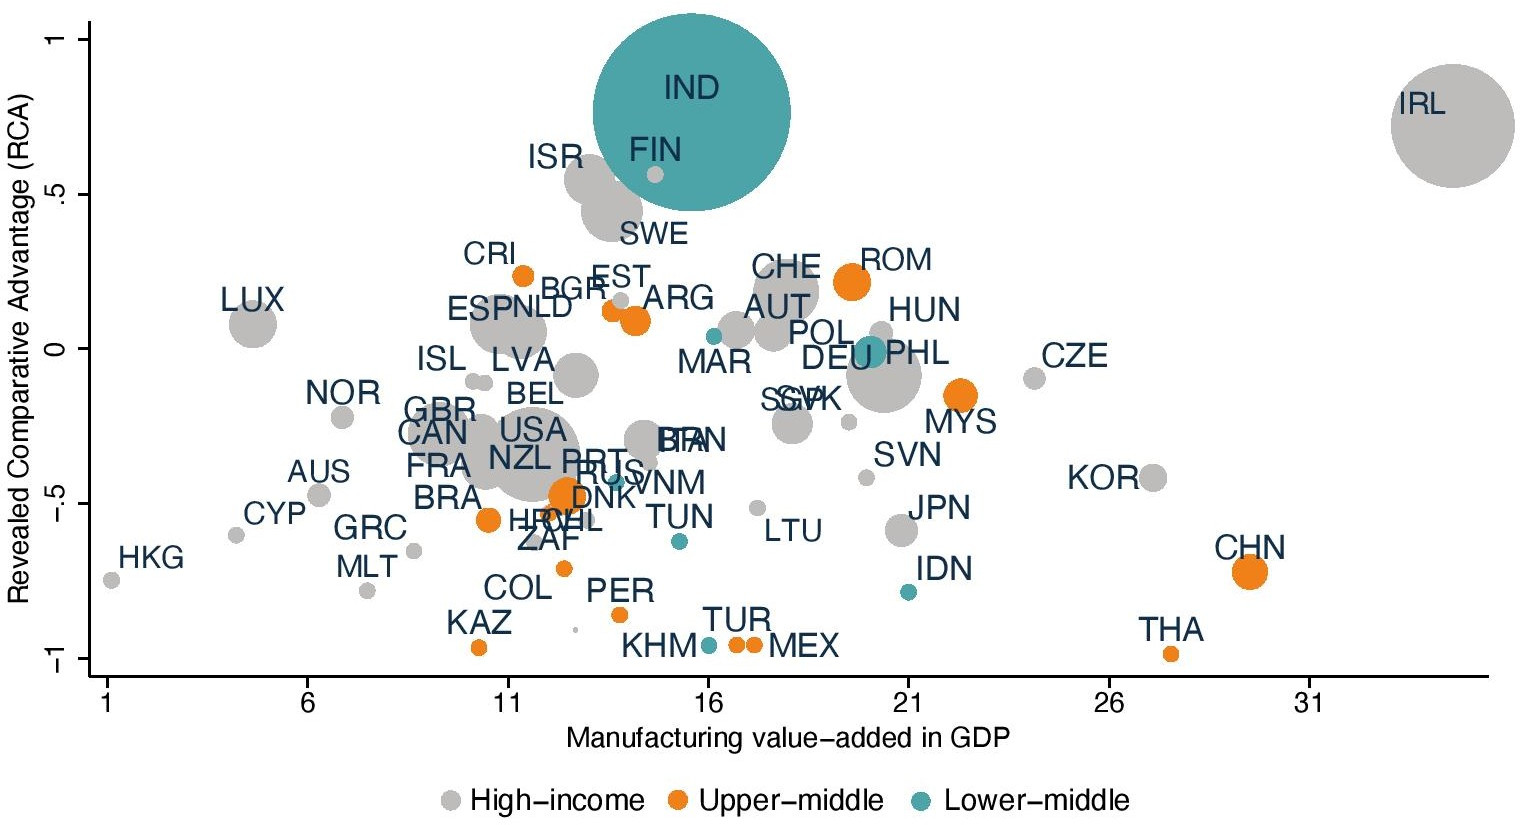
It would be instructive to understand which countries have experienced significant trade increases in digital services after the 2008 GFC. In doing so, one could acquire improved insights into which countries are likely to experience a further successful shift into digital services trade after the current crisis. One can perform such exercise by mapping and visualizing these countries’ relative position vis-à-vis another on the basis of the economic characteristics which have been used in the previous analysis. This mapping is shown in Figures 12-14 for all countries.
We start by analyzing countries position with respect to their internet usage (as a share of the total population), which in Figure 12 is plotted on the horizontal axis. In the figure, each dot marks a country’s position with the bubble size indicating the level of exports for the IT and information services sector. The reason for choosing this sector is because it forms the most straightforward example of digital services and the sector’s activities are at the basis of our selection of digital sectors as outlined in Table 2. Further, on the vertical axis the RCA indicator is plotted for the IT sector. The RCA variable is normalized following Laursen (2015) to facilitate visualization. Then, the colors of each bubble specify the income group to which a country belongs. Note that for the figure we take the year 2015 in which no low-income is found anymore in our country sample.[1] Blue indicates high-income countries, red upper-middle income countries, and finally green lower-middle income countries.
The figure suggests there is an upward trend between a country’s revealed comparative advantage in IT and information services and internet usage with India as a major exception. High-income countries are almost all placed at the right of the graph, whereas the middle-income countries at the left. More interesting however is to zoom into the relative position of countries while remembering the significant result found in Table 8 (income groups), Table 9 (RCA) and Table 10 (internet usage). Upper-middle income countries, countries with strong and weak RCAs and with a medium to high internet usage showed a positive significant result. Countries that broadly fall into this overlapping categorization would be for instance Costa Rica, Romania and Bulgaria being upper-middle income countries, and Israel, Ireland and Spain that belong to the high-income group of countries. These countries have developed a relatively high comparative advantage with medium to strong internet usage.
By similar token, in Figure 13 all country variables are plotted in identical order, but internet usage is being replaced for services value-added in GDP – another economic characteristic used in the regressions. This indicator represents the extent to which countries are active in services and generate their national income from the services sector. This time, no notable trend between comparative advantage and services value-added in GDP is detected. However, the regression results from Table 13 did show that the category of countries with the highest services value-added in GDP profited he most form digital services exports after 2008. (i.e. the super group). When looking at Figure 13, the countries that fall into this group with also a high comparative advantage in IT and information services are, for instance, Switzerland, Spain and Israel. Not far behind are Costa Rica, Sweden and the UK, although the latter doesn’t not have comparative advantage in the sector (but does have comparative advantage in another digital sector such as Financial services).
Finally, Figure 14 plots countries’ share of manufacturing value-added in GDP on the horizontal line whilst all other indicators stay the same. In Table 14 it become clear that the super group of countries with the highest share of manufacturing value-added were the one profiting from the shift in digital services exports. As one can see in the figure, these are countries such as Ireland, Czech Republic and Korea, although these countries do not have comparative advantage in the IT and information sector. Instead, other countries such as Hungary, Romania, the Philippines do classify in the basket of countries with high manufacturing value-added in GDP and have comparative advantage in the sector. They are also are either a high or upper-middle income country which, as Table 8 showed, have profited a lot from the shift into digital services export post-GFC. Malaysia being an upper-middle income country also appeared to have benefitted from the move into digital services post-2008, although it has comparative advantage in telecommunications rather than IT-services.
[1] Cambodia was the only country that was still classified as a low-income country in 2014.
5. Conclusion
This paper has put forward evidence that countries have shown a distinctive shift in their trade patterns after the GFC of 2008 into digital services. Using two different datasets of services trade, our results show that in most part countries started to “de-link” their services trade patterns as of the year 2009 into more software-intense services such as computer, information, R&D and financial services from the more traditional services sectors that are less intensive in the usage software. However, depending on the trade data used, our results also show signs that this disassociation already started somewhat before the GFC, namely in 2007.
More interesting, however, is that we also investigate for which type of countries this growing gap between digital and non-digital services became most pronounced. The results show that the growth of software-intense services compared to other sectors was strongest post-GFC for upper-middle income countries. That seems contradictory to the notion that digital trade successes are typically found in advanced countries. The latter countries also show significant positive results, but these changing trade patterns are strongest for the upper-middle income countries. One potential explanation is that digital trade is sensitive to spill-over effects and digital entrepreneurship attracts many young people. Upper-middle income countries have an employment population that is relatively young whilst showing a higher urbanisation rate where external scale economies usually are high.
The analysis further reveals that countries with high internet usage as a share of the population and countries with already high comparative advantage in services have also seen a significant break in digital services trade form other non-digital services. Overall, these outcomes don’t come as a surprise as internet usage and export productivity are strong predictors for digital services trade. What is more surprising however is that countries with a very high share manufacturing value-added and employment have seen the greatest digital services trade growth. Countries where value-added and employment in services are high have profited from this digital shift too, but the results are economically more important for the manufacturing-based economies.
One possible reason for this result is that digital technologies hang together with the automation process that many manufacturing industries have undergone in recent year. The use of robots, 3D printing and other forms of the Internet-of-Thing in many advanced industries require software-intense services which in turn can be outsourced and traded. This result, and the previous set of results, hold interesting insights with respect to the current economic crisis. With the collapse of many supply chains, the pandemic has ramped up impetus for greater automation for not only manufacturing but also services. Our results suggest that after this crisis, a further “break” away from traditional services into digital services is likely to happen and that countries with a strong (digital) manufacturing base will profit most from that.
Moreover, the move into digital services also forms opportunities for closing the so-called digital divide for that also poorer countries seem to have profited most from the growth gap between digital and non-digital trade so far. However, one worrying trend is the prospect for the poorest countries as they have appeared to lose from any digital trade increase.
References
Abadie, A. and Gardeazabal (2003) “The Economic Costs of Conflict: A Case Study of the Basque Country”, American Economic Review, Vol. 93, No. 1, pages 113-132.
Abadie, A., A. Diamond and J. Hainmueller (2010) “Synthetic Control Methods for Comparative Case Studies: Estimating the Effect of California’s Tobacco Control Program,” Journal of the American Statistical Association, Vol. 105, No. 490, pages 493-505.
Abadie, A., A. Diamond and J. Hainmueller (2015) “Comparative Politics and the Synthetic Control Method”, American Journal of Political Science, Vol. 59, No. 2, pages 495–510.
Acemoglu, D., S. Johnson, A. Kermani, J. Kwak and T. Mitton (2016) “The Value of Connections in Turbulent Times: Evidence from the United States,” Journal of Financial Economics, Vol. 121, No. 2, pages 368-391.
Ahn, JB., M. Amiti, and D. E. Weinstein (2011) “Trade Finance and the Great Trade Collapse”, American Economic Review, Vol. 101, No. 3, pages 298-302.
Amiti, M. and D. E. Weinstein (2011) “Exports and Financial Shocks”, The Quarterly Journal of Economics Vol. 126, No. 4, pages 1841–1877.
Ariu, A. (2016) “Crisis-Proof Services: Why Trade in Services Did Not Suffer During the 2008-2009 Collapse”, Journal of International Economics, Vol. 98 (C), pages 138-149.
Behrens, K., G. Corcos and G. Mion (2011) “Trade Crisis? What Trade Crisis?”, The Review of Economics and Statistics, Vol. 95, Issue 2, pages 702–209.
Bloomberg (2020) “Tracking Covid-19’s Impact on Trade”, Supply Lines, Bloomberg, Brendan Murray.
Borchert, I. and A. Mattoo (2010) “The Crisis-Resilience of Services Trade”, The Service Industry Journal, Vol. 30, Issue 3, pages 2115-2136.
Bricongne, J.-C., L. Fontagné, G. Gaulier, D. Taglioni and V. Vicard (2012) “Firms and the Global Crisis: French Exports in the Turmoil”, Journal of International Economics, Vol. 87, Issue 1, pages 134–146.
Caparusso, J. Y. Chen, P. Dattels, R. Goel and P. Hiebert (2019) “Post-Crisis Changes in Global Bank Business Models: A New Taxonomy”, IMF Working Paper WP/19/295, Washington DC: IMF.
Cavallo, E., S. Galiani, I. Noy and J. Pantano (2013) “Catastrophic Natural Disasters and Economic Growth”, The Review of Economics and Statistics, Vol. 95, No. 5, pages 1549-1561.
Chor, D. and K. Manova (2012) “Off the Cliff and Back? Credit Conditions and International Trade during the Global Financial Crisis”, Journal of International Economics, Vol. 87, Issue 1, pages117–133.
Eaton, J., S. Kortum, B. Neiman and J. Romalis (2016) “Trade and the Global Recession”, American Economic Review, Vol. 106, Issue 11, pages 3401-3438.
Freund, C. (2009) “The Trade Response to Global Downturns: Historical Evidence”, World Bank Policy Research Working Paper No. 5015. Washington DC: The World Bank.
Freund, C., A. Mulabdic and M. Ruta (2019) “Is 3D Printing a Threat to Global Trade? The Trade Effects You Didn’t Hear About”, Policy Research Working Paper No. 9024; WDR 2020 Background Paper. Washington DC: The World Bank.
Laursen, K. (2015) “Revealed Comparative Advantage and the Alternatives as Measures of International Specialization”, Eurasian Business Review, Vol. 5, No. 1, pages 99 – 115.
Manelici and Pantea (2020) “Industrial Policy at Work: Evidence from Romania’s Income Tax Break for Workers in IT”, forthcoming.
Nayyar, G. and M. Hallward-Driemeier (2017) “Trouble in the Making? The Future of Manufacturing-Led Development”, Washington DC: The World Bank.
Quistorff, B. and S. Galiani (2018) “The Synth_Runner Package: Utilities to Automate Synthetic Control Estimation Using Synth”, Stata Journal, Vol. 17, No. 4, pages 834-849.
van der Marel, E. (2020) “Sources of Comparative Advantage in Data-related Services”, EUI RSCAS Working Paper, No. 2020/3 Global Governance Programme-393, European University Institute, Florence.
Tables and Figures
Figure 1: Trade growth for computer and other services (2005-2017)
Source: WTO-UNCTAD-ICT.
Figure 2: Trade growth for R&D and other services (2005-2017)
Source: WTO-UNCTAD-ICT.
Table 1: Software-intensive sectors using the WTO-UNCTAD-ITC classification
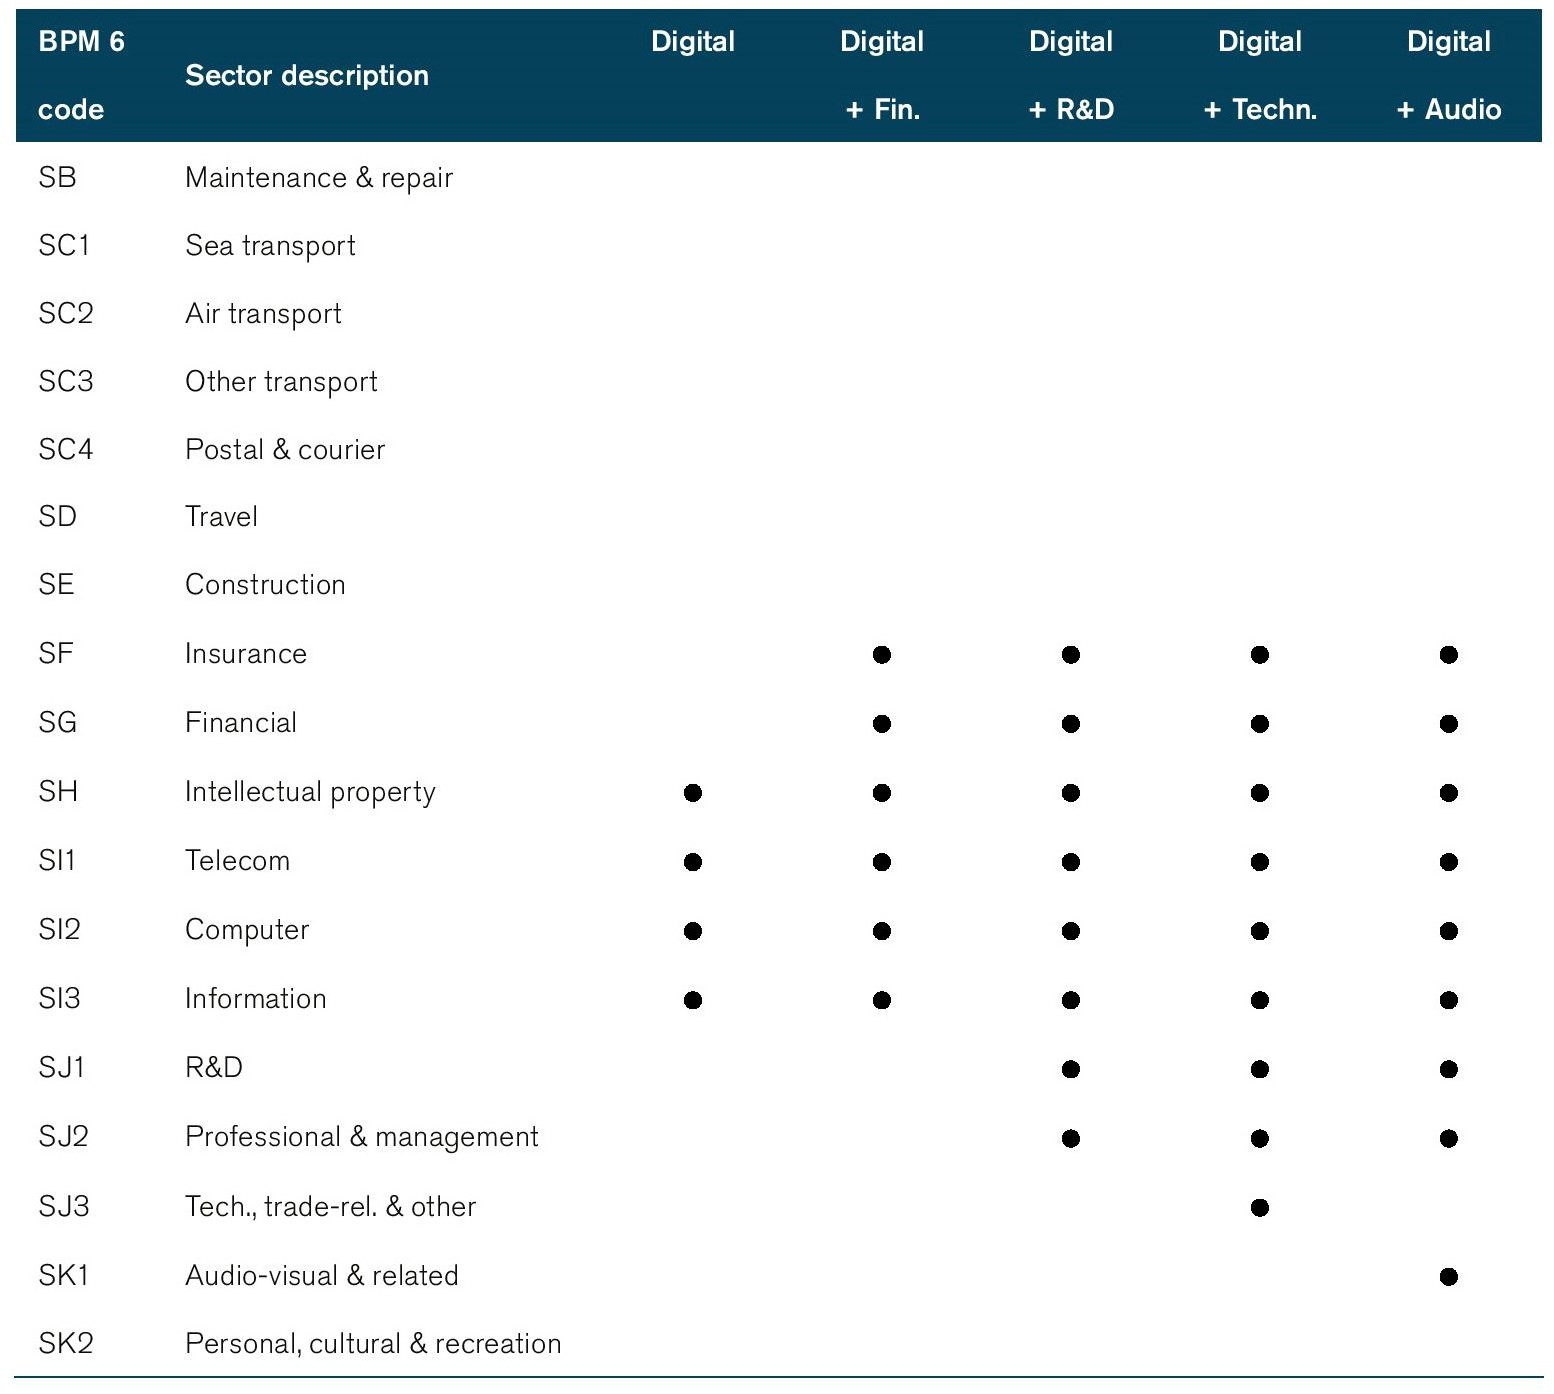
Note: sector classification is based on the WTO-UNCTAD-ITC database.
Table 2: Software-intensive sectors using the TiVA classification
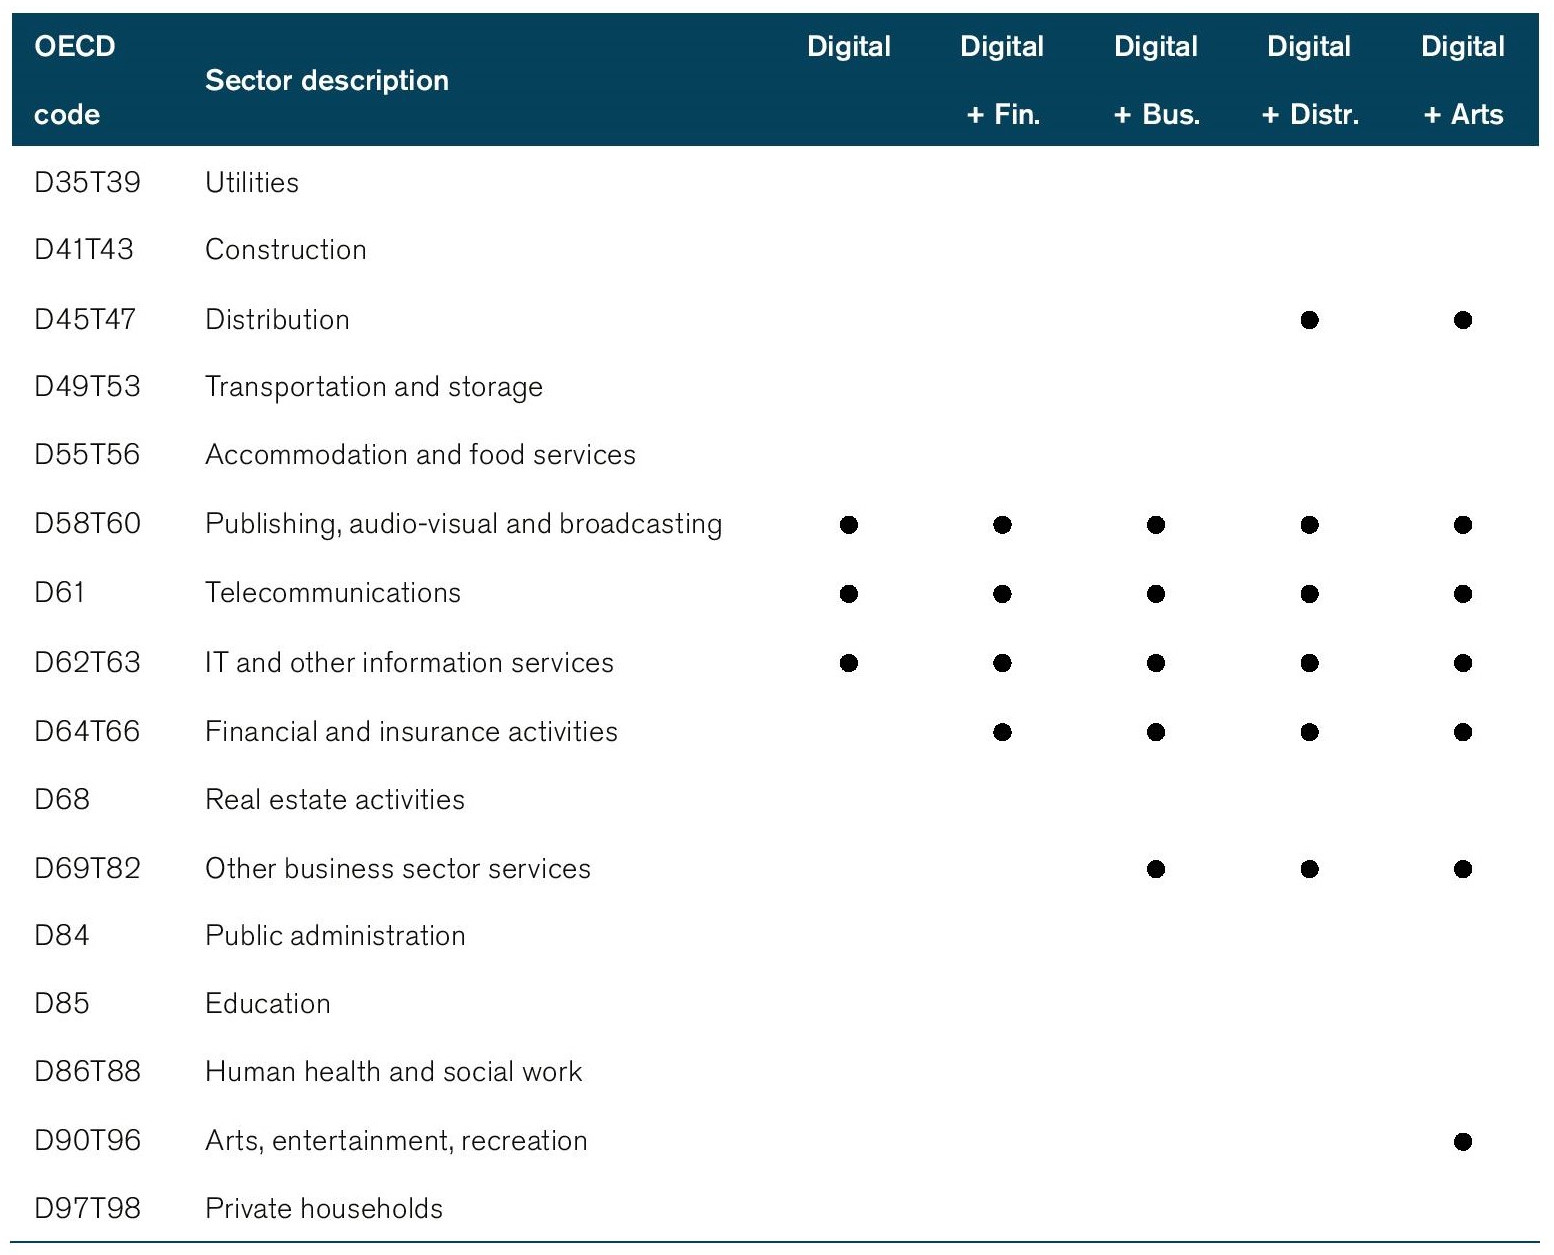
Note: sector classification is based on the OECD TiVA database.
Table 3: Baseline regression results using WTO-UNCTAD-ITC dataset
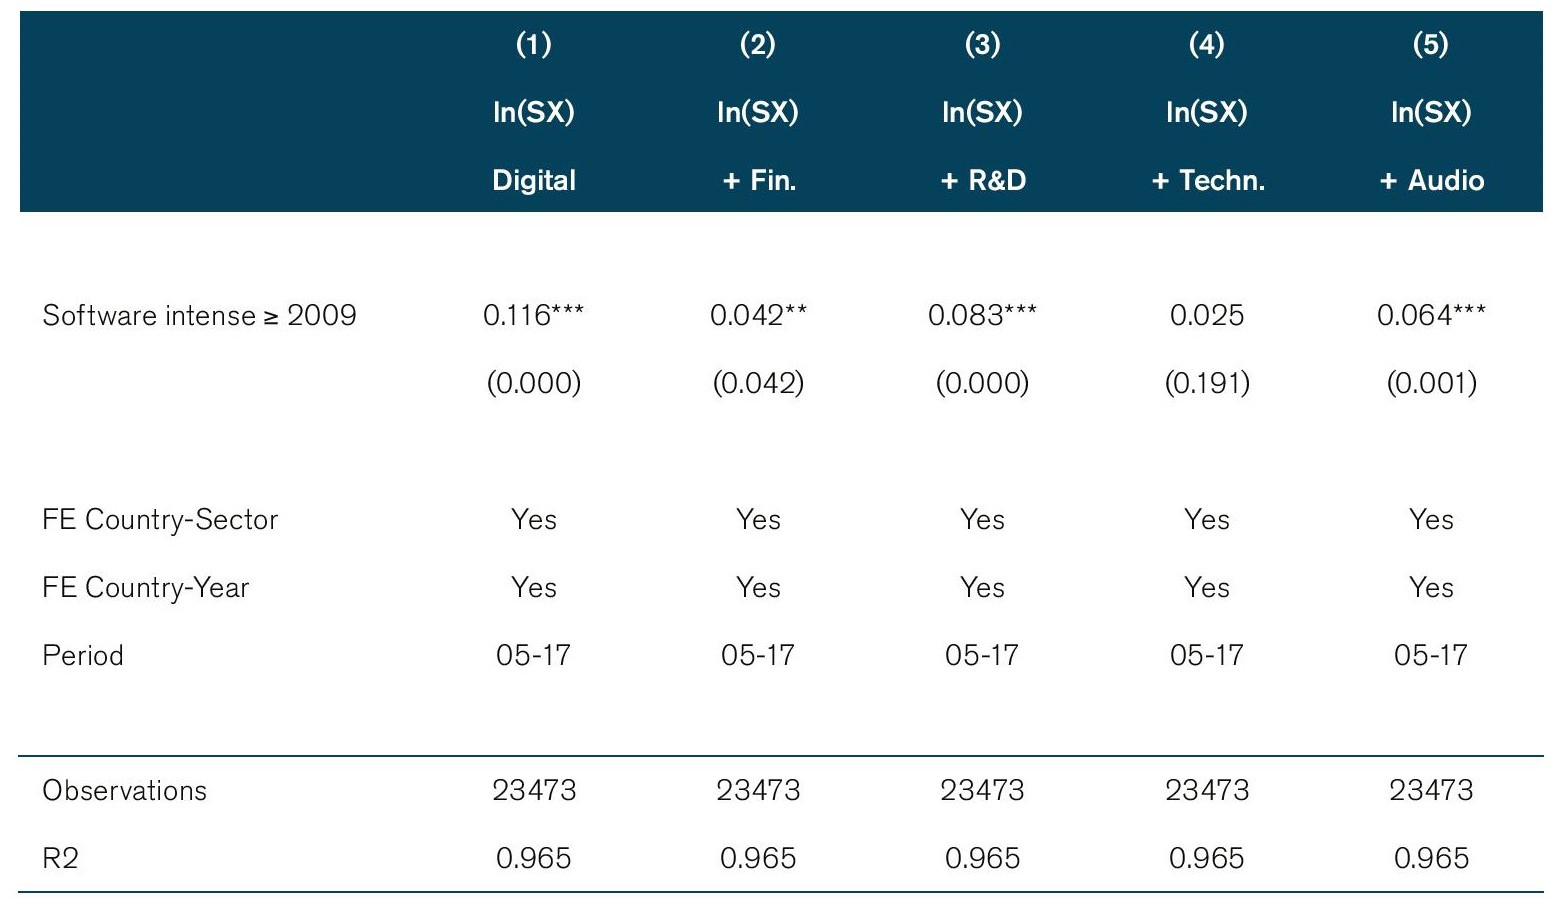
Note: * p<0.10; ** p<0.05; *** p<0.01. P-values are given in parenthesis. The dependent variable the log of services exports ln(SX) using data from the WTO-UNCTAD-ITC BPM6 database. Fixed effects are applied at the country-sector and country-year level. Period of regressions is 2005-2017. Regressions are estimated with robust standard error clustered by country-sector-year. Column titles correspond to the sector specification as presented in Table 1.
Table 4: Baseline regression results using TiVA dataset
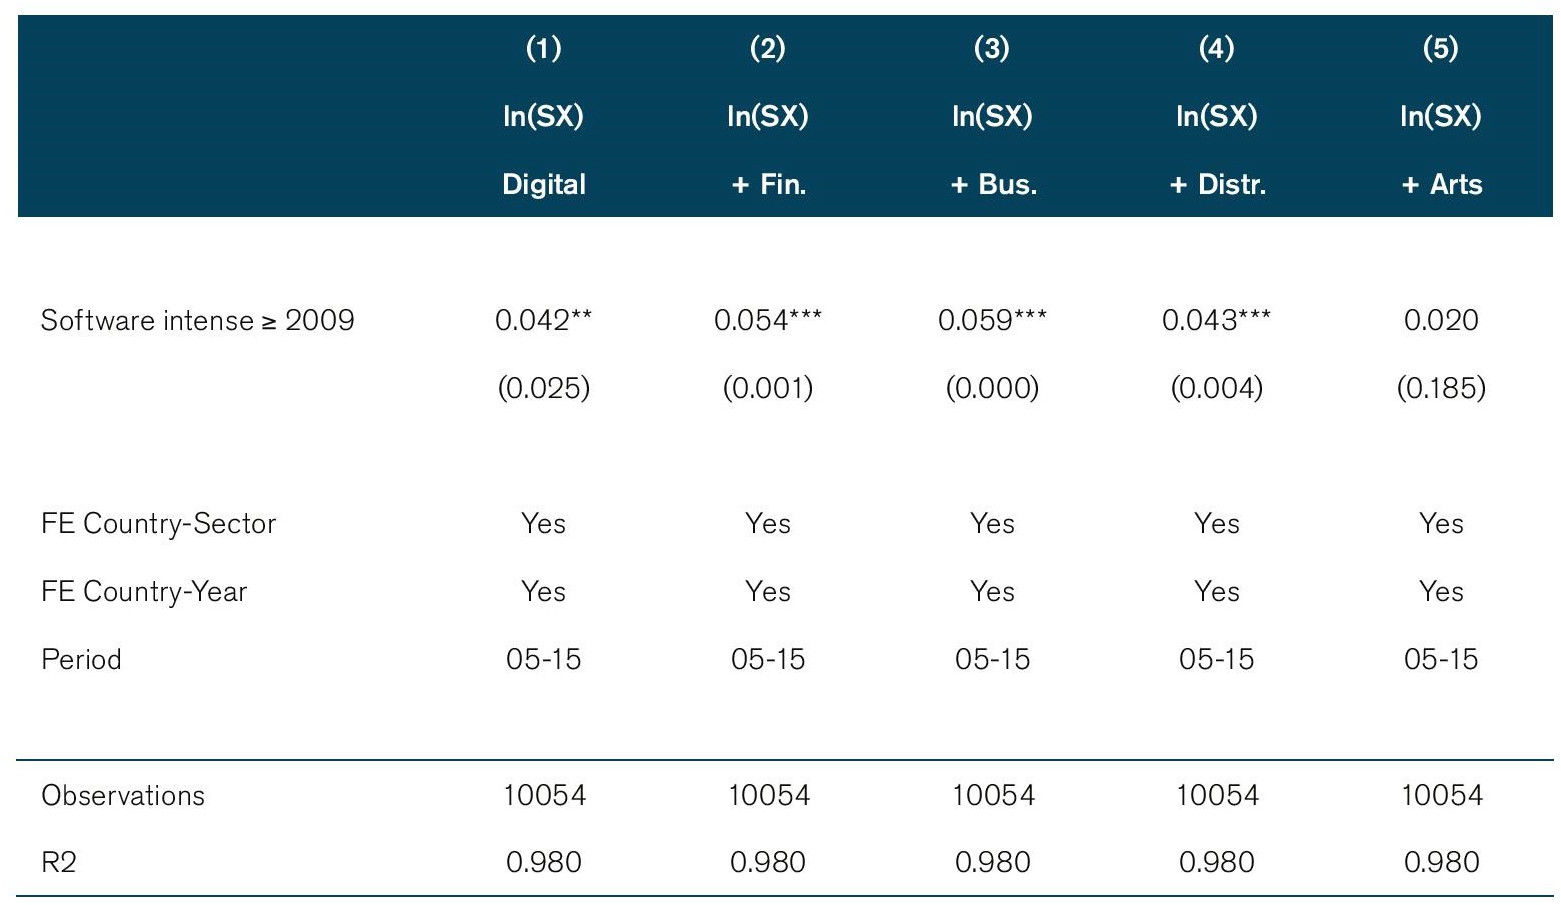
Note: * p<0.10; ** p<0.05; *** p<0.01. P-values are given in parenthesis. The dependent variable the log of services exports ln(SX) using data from the OECD TiVA database. Fixed effects are applied at the country-sector and country-year level. Period of regressions is 2005-2015. Regressions are estimated with robust standard error clustered by country-sector-year. Column titles correspond to the sector specification as presented in Table 2.
Table 5: Baseline regression results using WTO-UNCTAD-ITC dataset by year
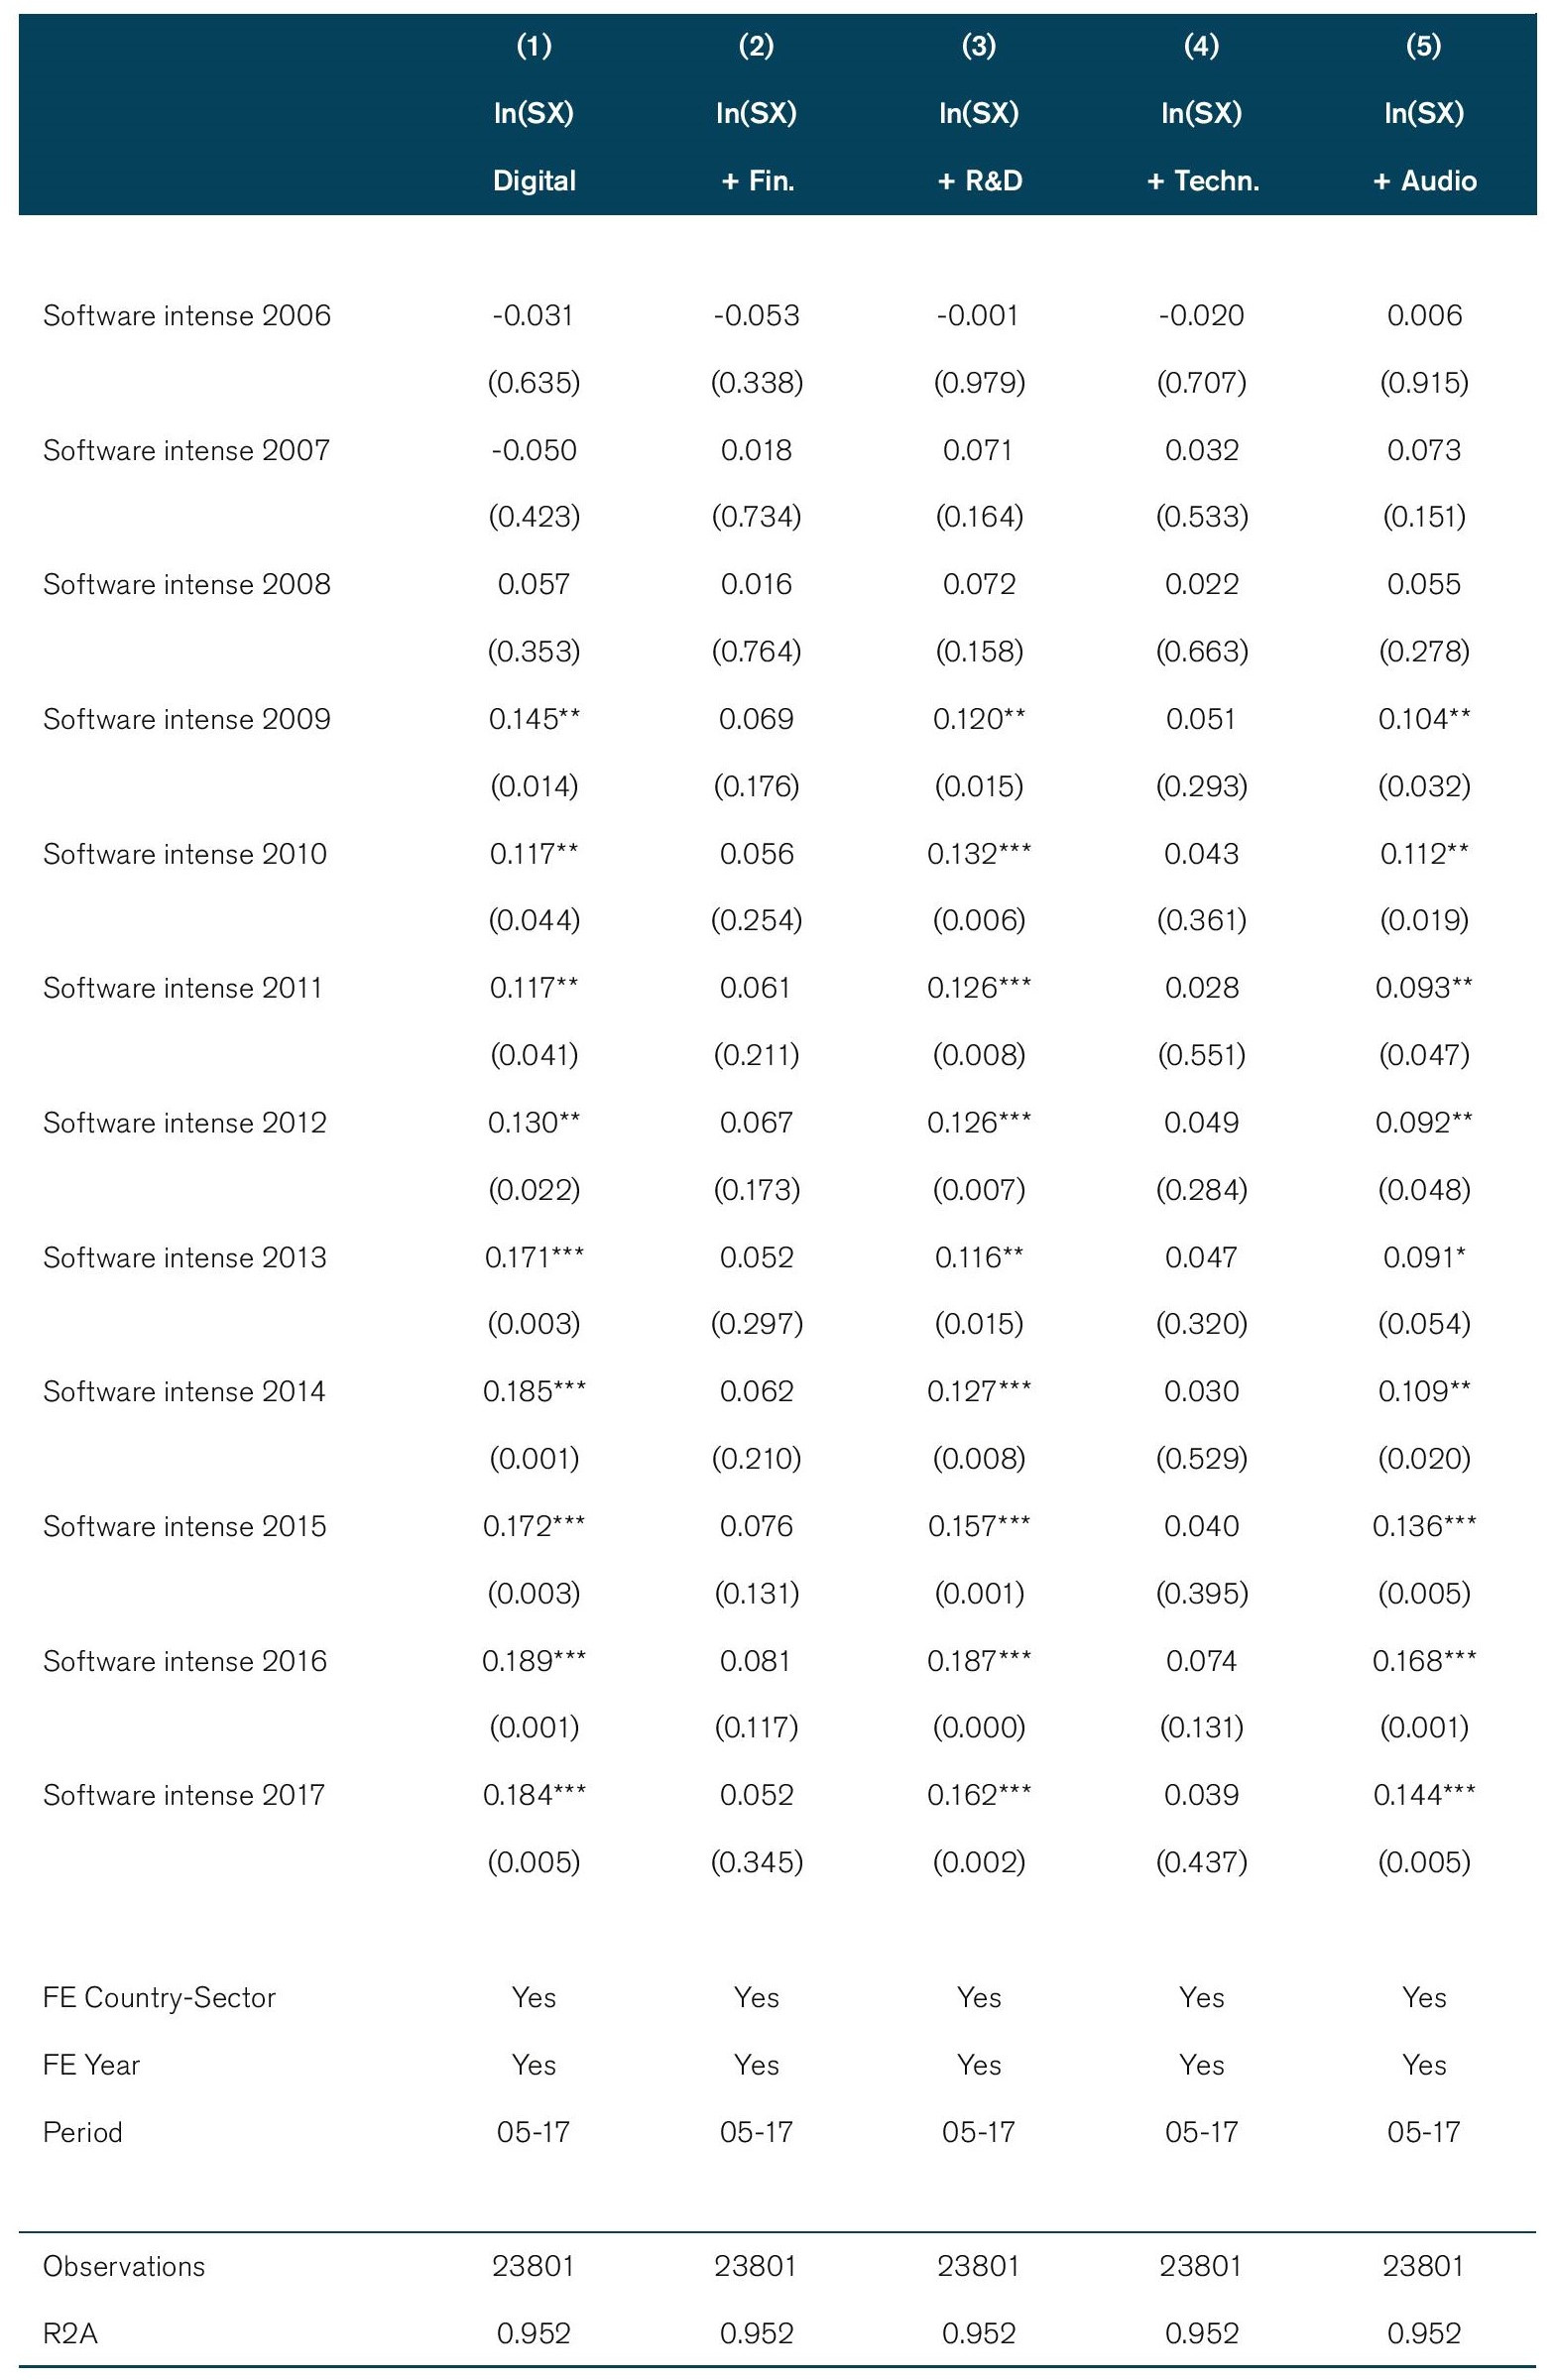
Note: * p<0.10; ** p<0.05; *** p<0.01. P-values are given in parenthesis. The dependent variable the log of services exports ln(SX) using data from the WTO-UNCTAD-ITC BPM6 database. Fixed effects are applied at the country-sector and year level. Period of regressions is 2005-2017. Regressions are estimated with robust standard error clustered by country-sector-year. Column titles correspond to the sector specification as presented in Table 1.
Figure 3: Trade difference using WTO-UNCTAD-ITC dataset by year
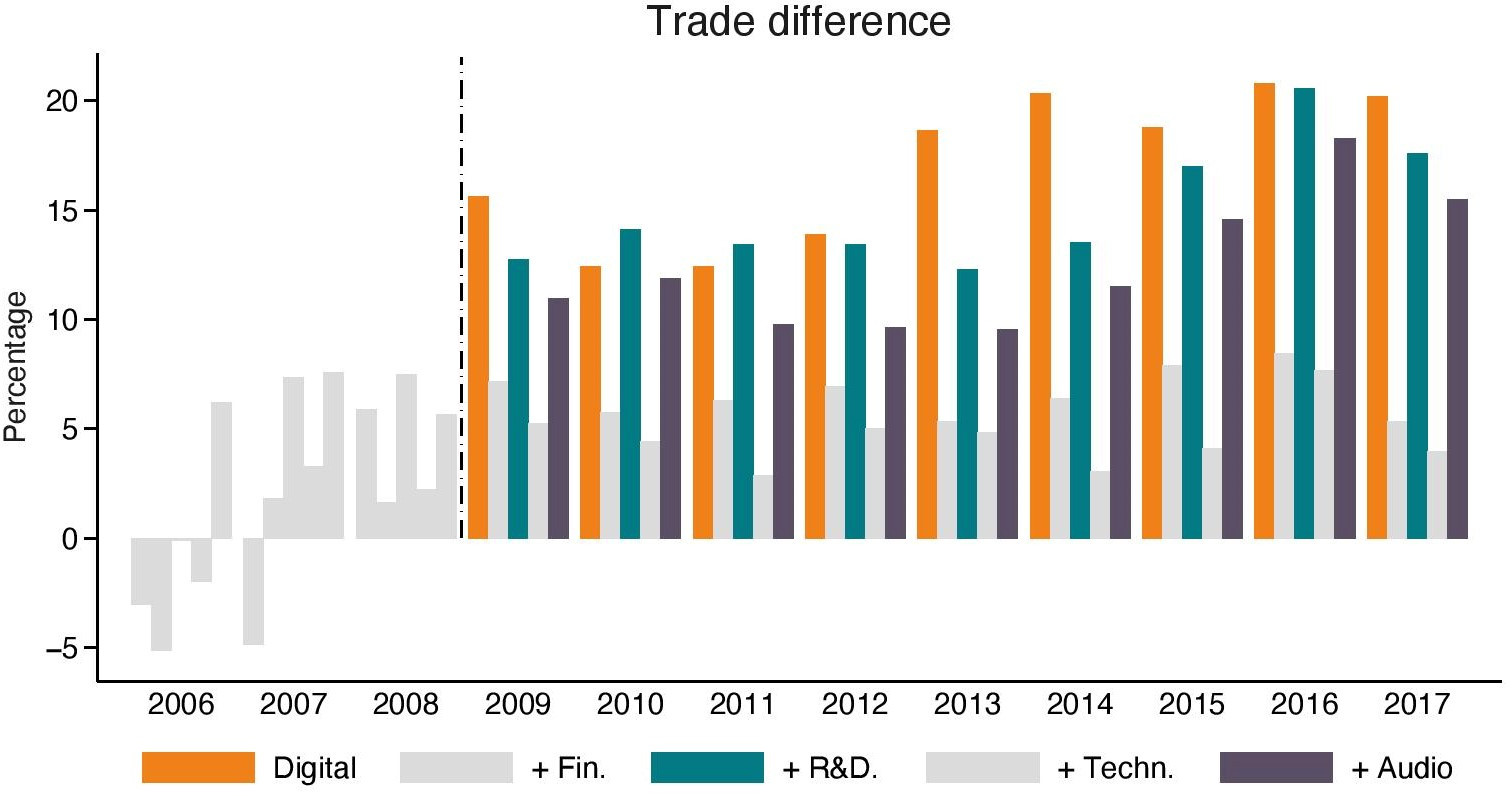
Note: Results correspond to the coefficient estimates shown in Table 5.
Table 6: Baseline regression results using TiVA dataset by year
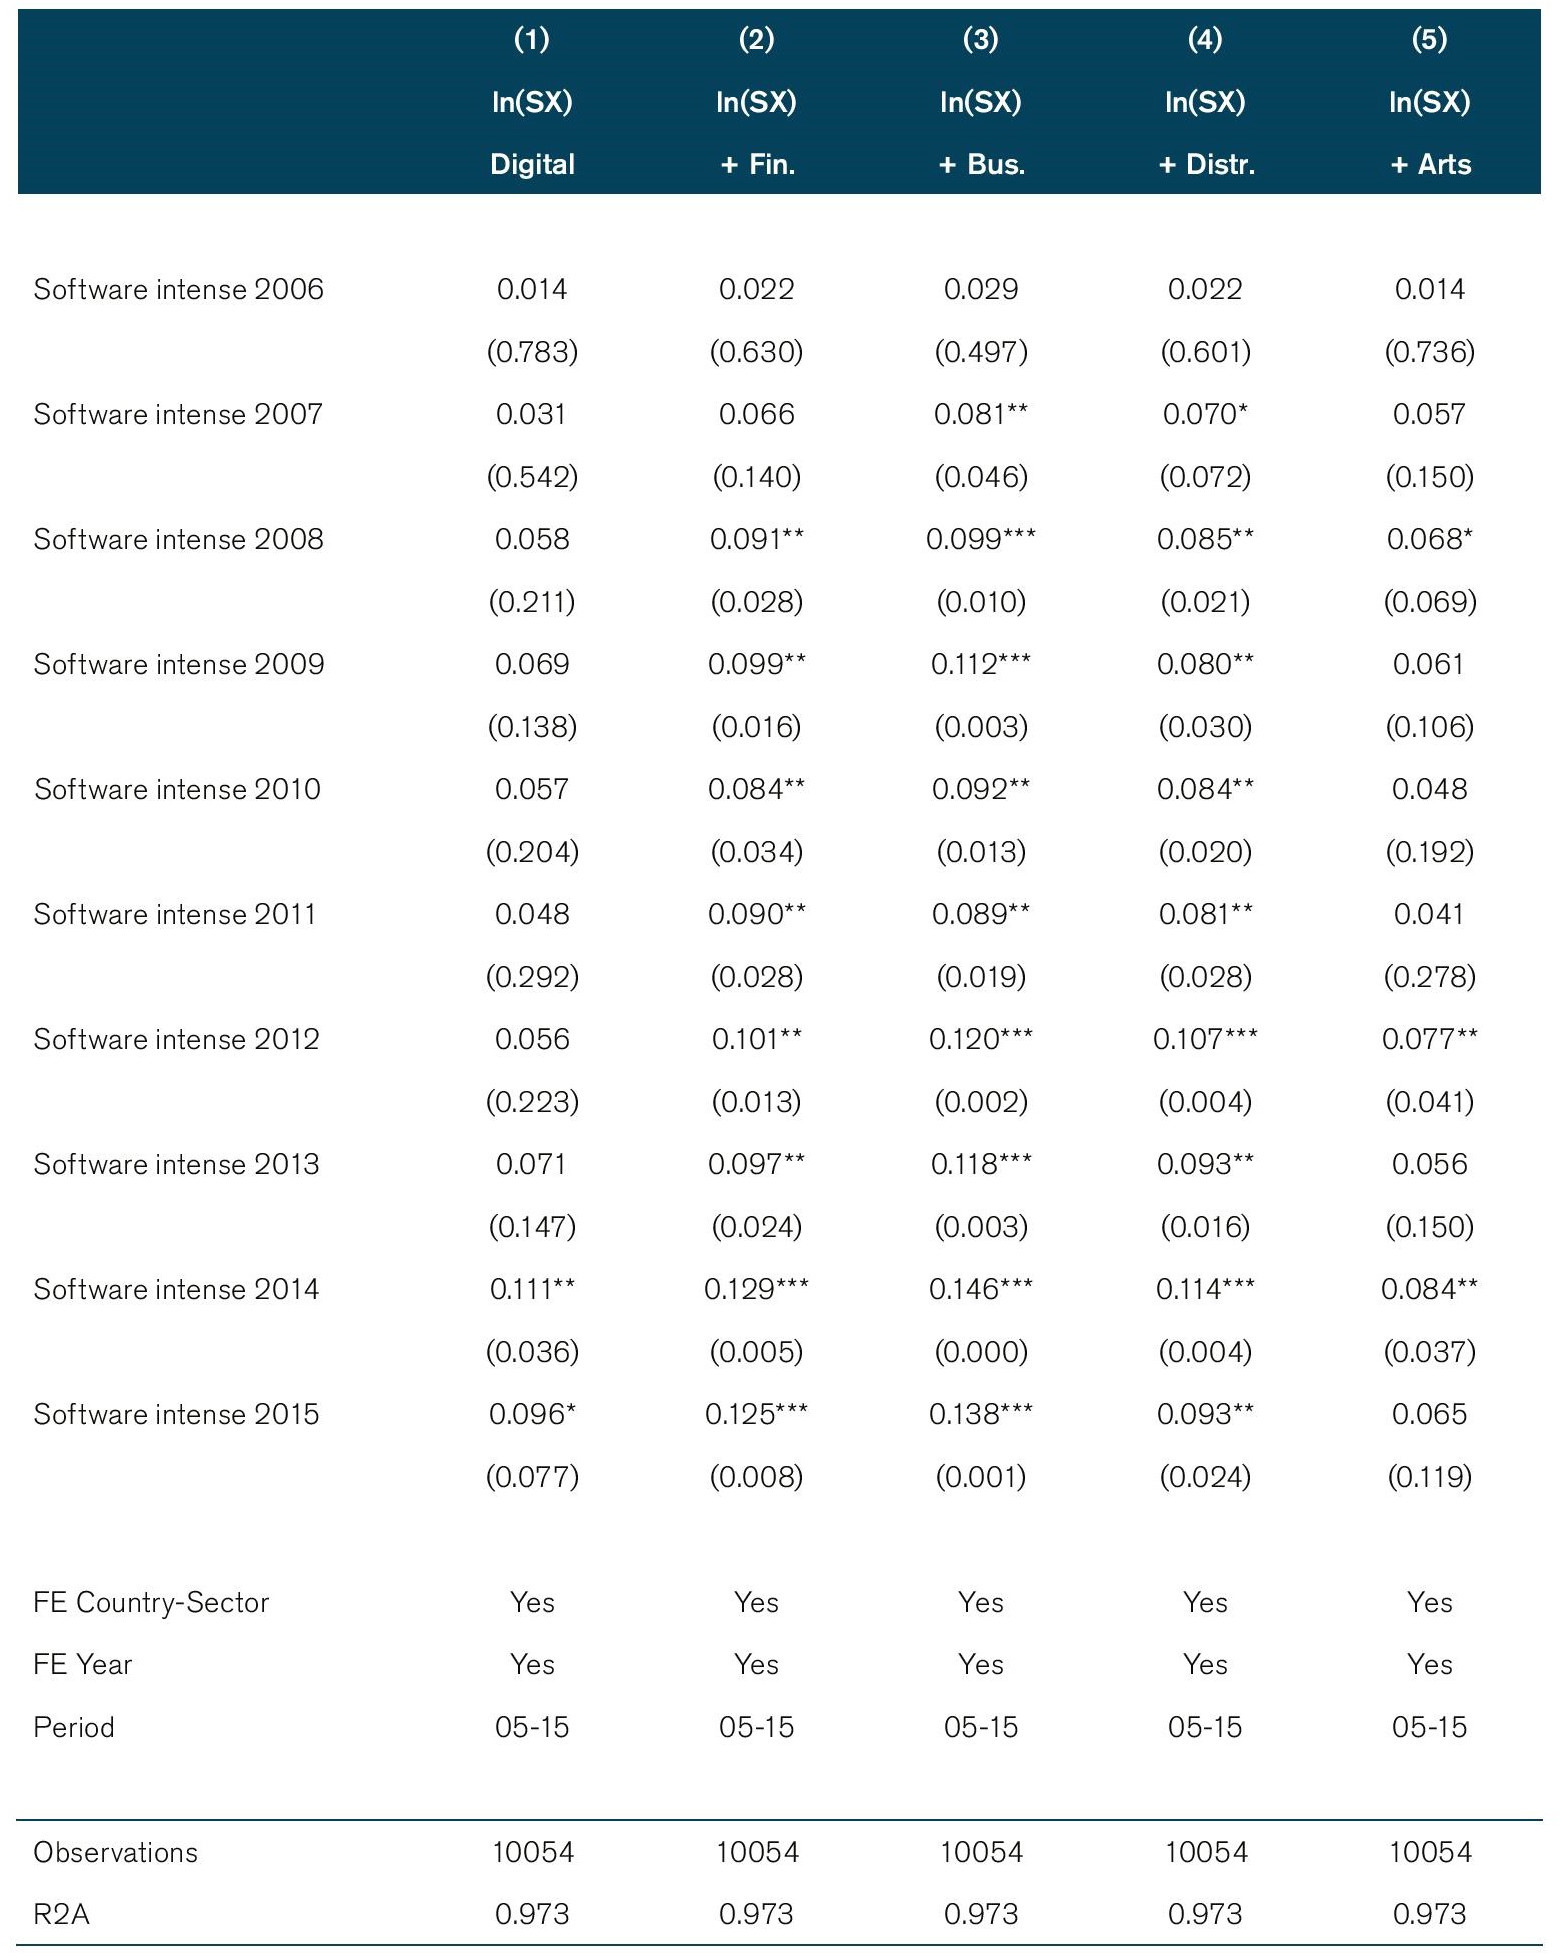
Note: * p<0.10; ** p<0.05; *** p<0.01. P-values are given in parenthesis. The dependent variable the log of services exports ln(SX) using data from the OECD TiVA database. Fixed effects are applied at the country-sector and year level. Period of regressions is 2005-2015. Regressions are estimated with robust standard error clustered by country-sector-year. Column titles correspond to the sector specification as presented in Table 2.
Figure 4: Trade difference using TiVA dataset by year
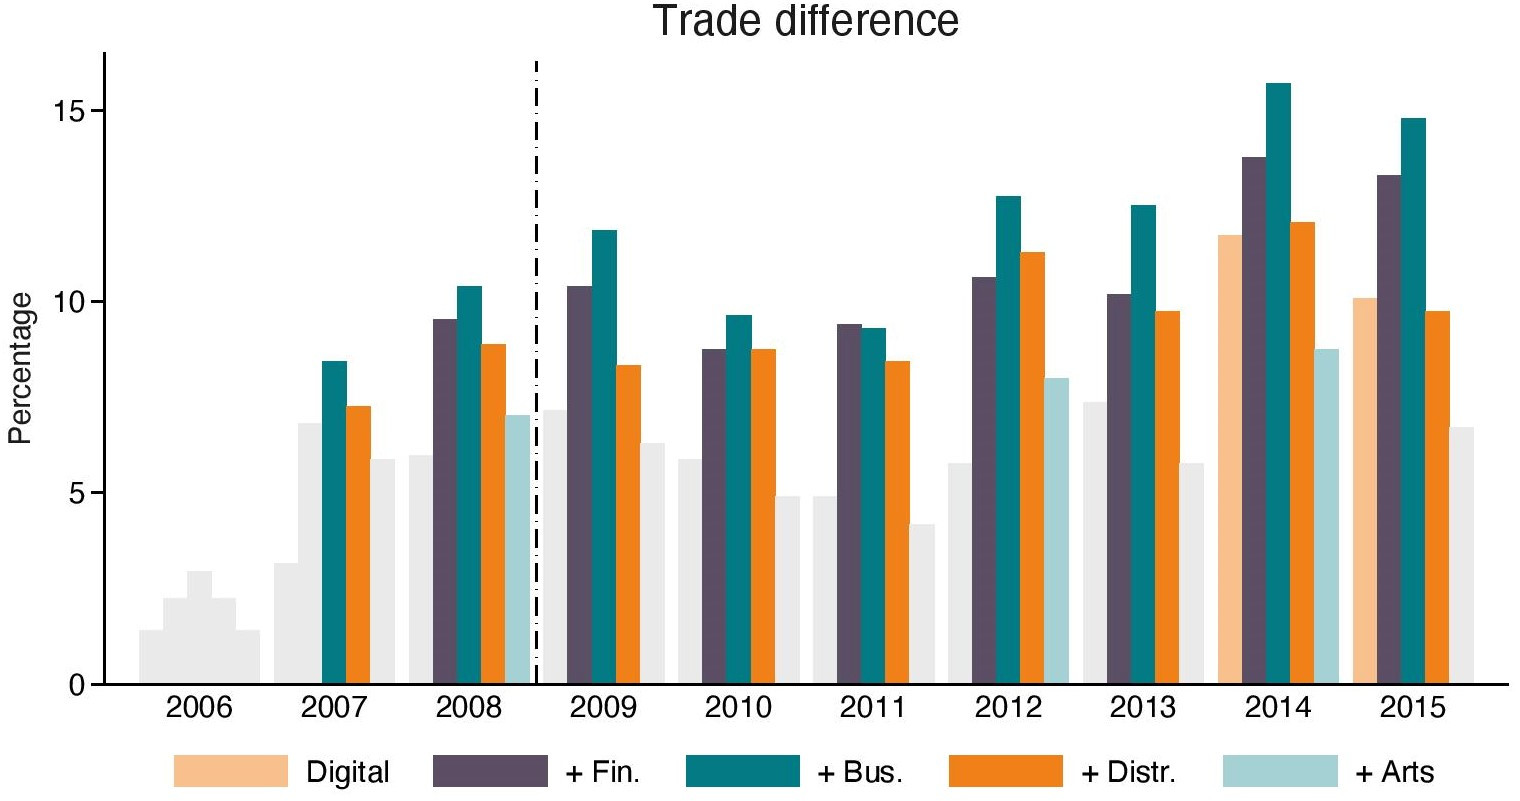
Note: Results correspond to the coefficient estimates reported in Table 6.
Figure 5: Synthetic Control Method (SCM) results for digital services and its synthetic control
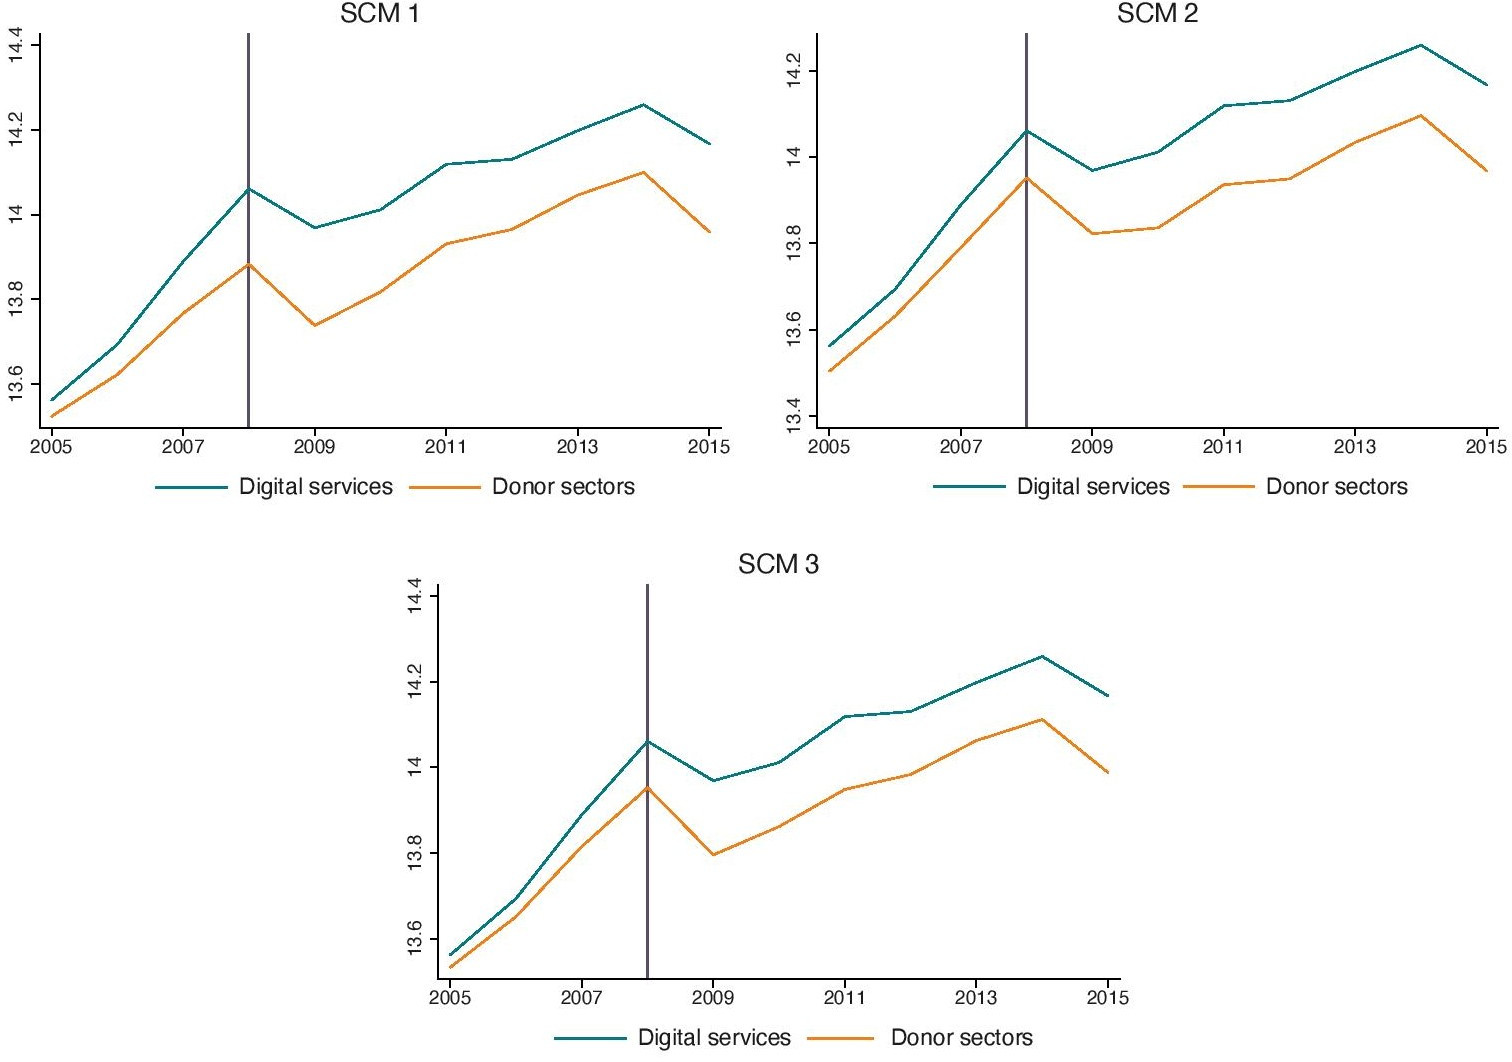
Note: results are obtained from the synth_runner package as developed by Quistorff and Galiani (2018). Digital sectors correspond ot the list of digital sectors under column “Digital + Bus.” in Table 2 as the treatment sectors.
Table 7: Post-treatment results from Synthetic Control Method (SCM): effects, p-values, and standardized p-values
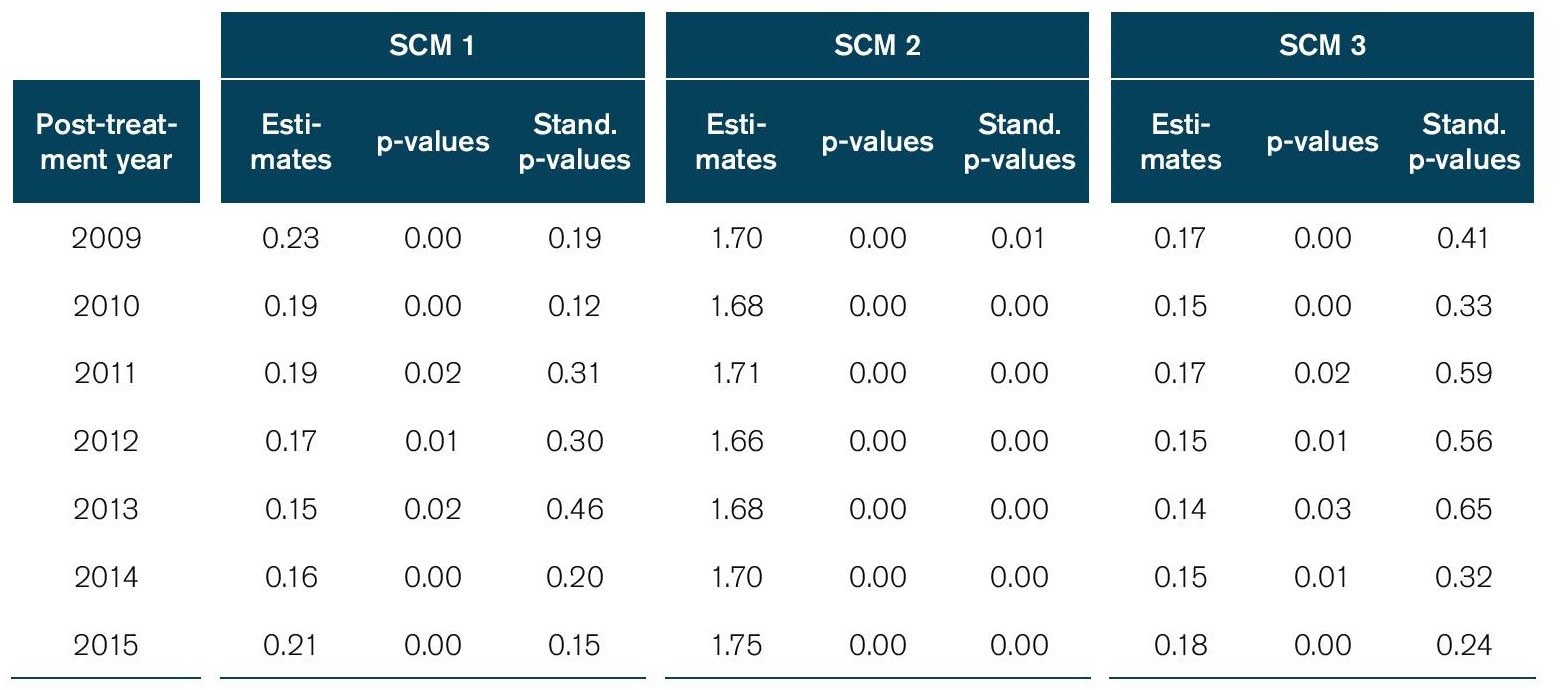
Note: Estimates correspond to the treatment effects plotted in Figure 5 for each panel (SCM1, SCM 2, and SCM 3)., after the year 2008. P-values represents statistical significance which is determined by placebo tests. Standardized p-values are the studentized p-values.
Table 8: Extended baseline regression by income group
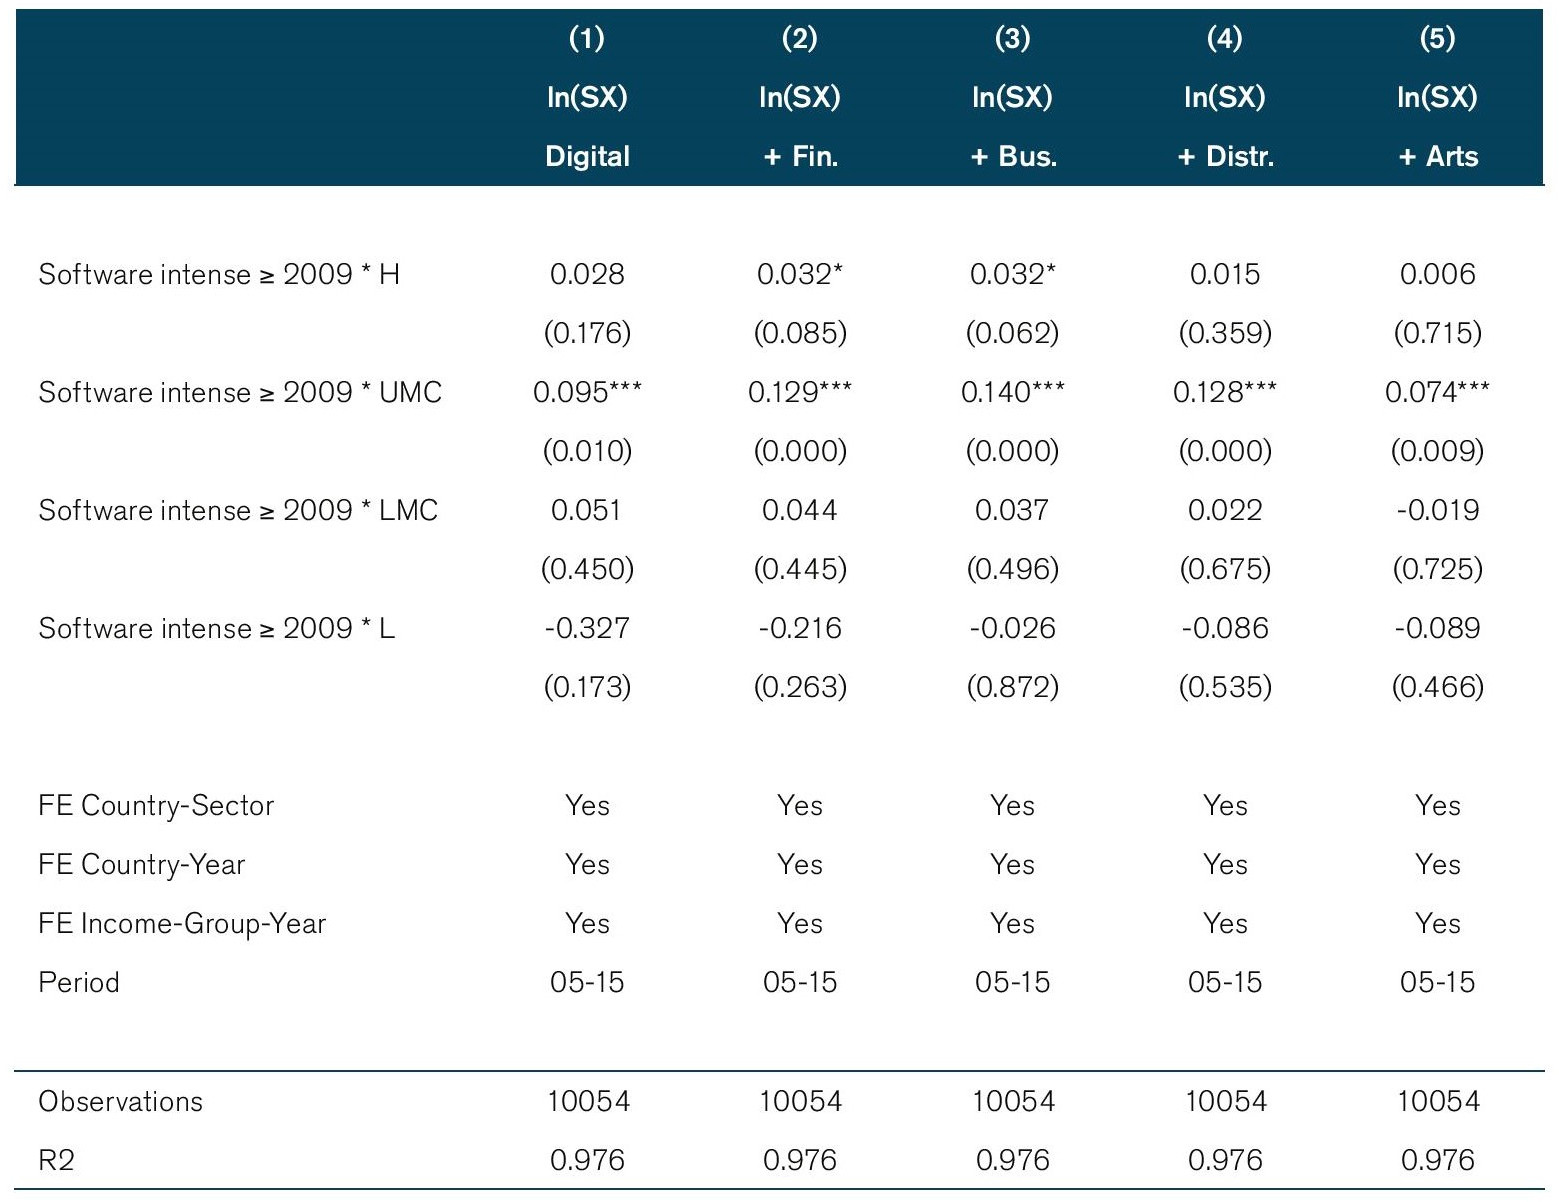
Note: * p<0.10; ** p<0.05; *** p<0.01. P-values are given in parenthesis. The dependent variable the log of services exports ln(SX) using data from the OECD TiVA database. Fixed effects are applied at the country-sector, country-year and income-group-year level. Period of regressions is 2005-2015. Regressions are estimated with robust standard error clustered by country-sector-year. Column titles correspond to the sector specification as presented in Table 2.
Figure 6: Trade impact from extended baseline regression by income group
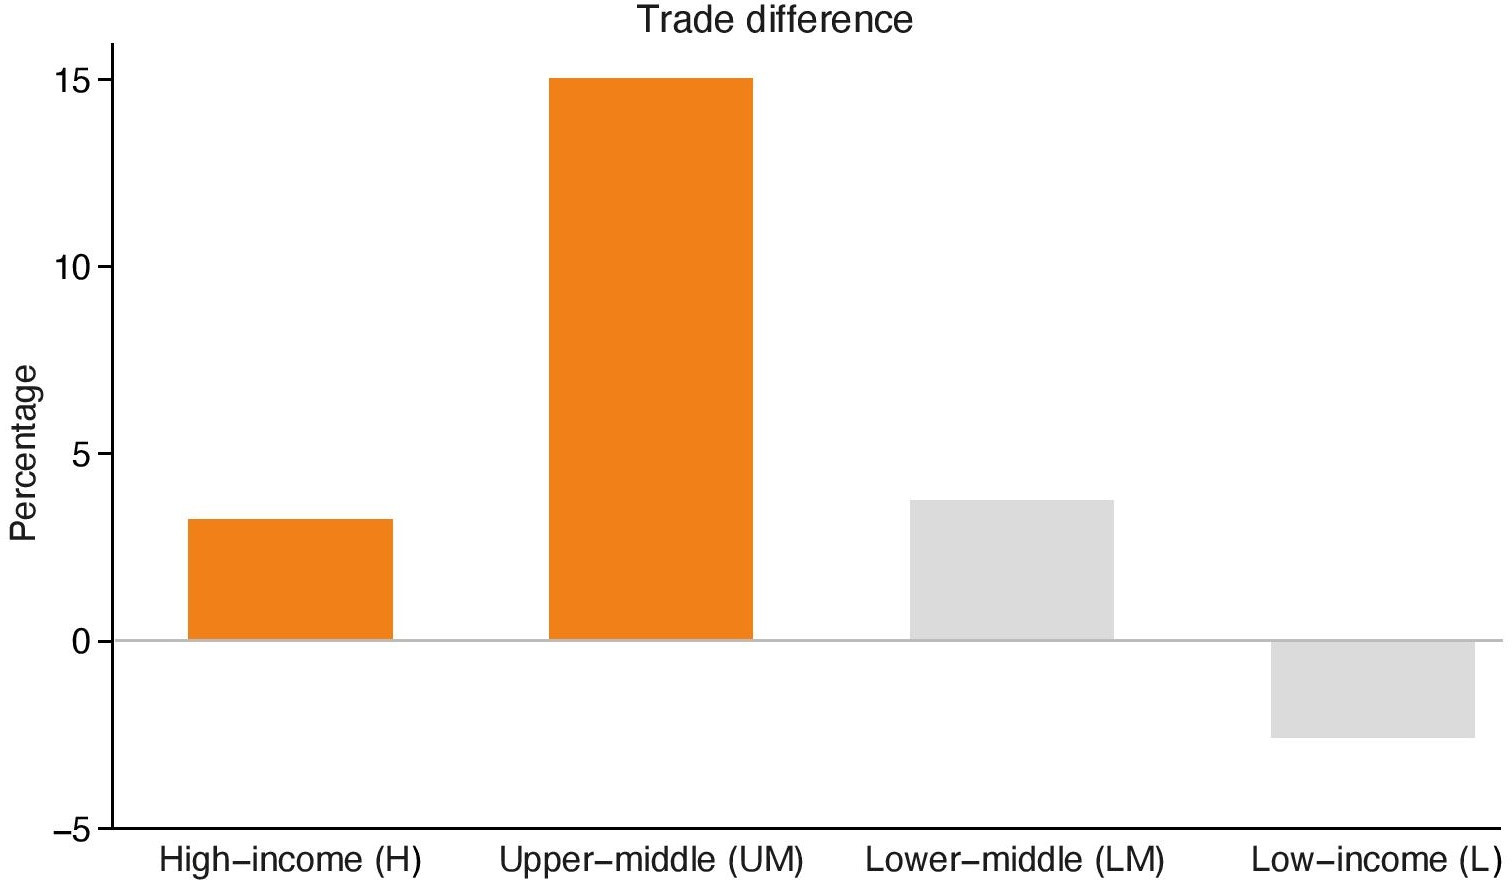
Note: Results correspond to the coefficient estimates reported in Table 8.
Table 9: Extended baseline regression by RCA
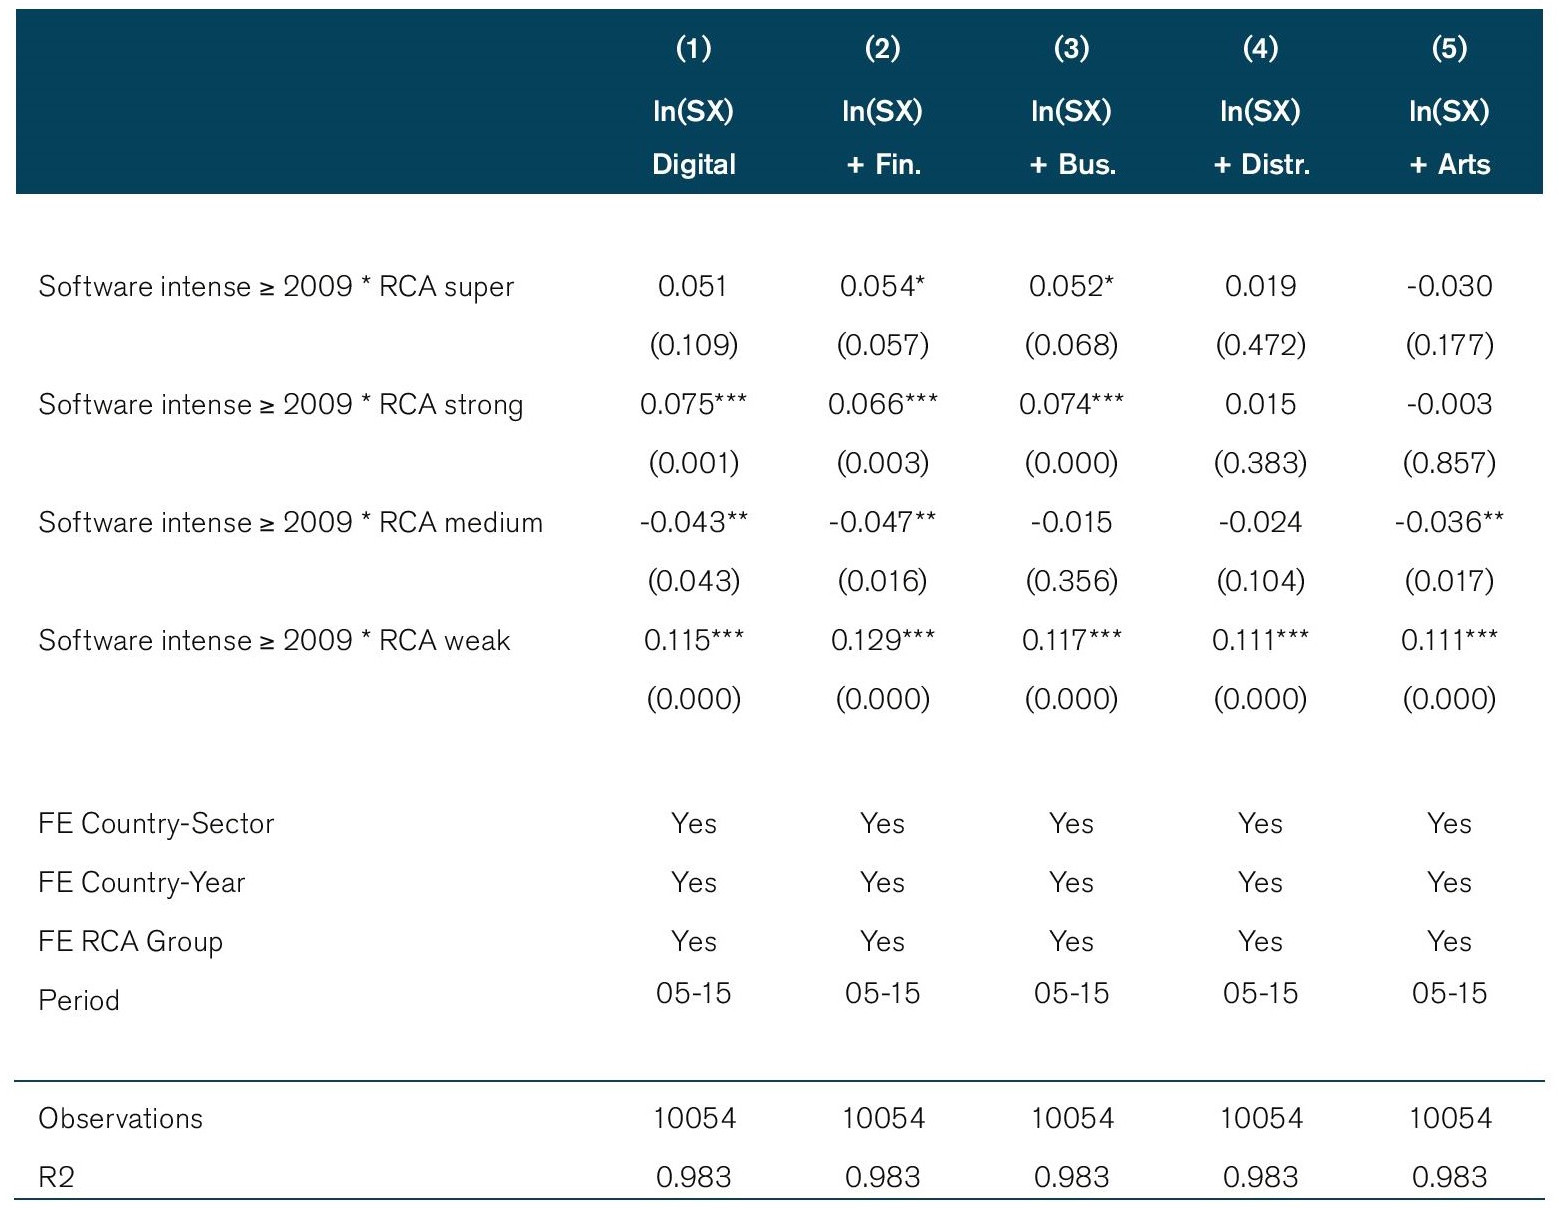
Note: * p<0.10; ** p<0.05; *** p<0.01. P-values are given in parenthesis. The dependent variable the log of services exports ln(SX) using data from the OECD TiVA database. Fixed effects are applied at the country-sector, country-year and RCA-group level. Period of regressions is 2005-2015. Regressions are estimated with robust standard error clustered by country-sector-year. Column titles correspond to the sector specification as presented in Table 2.
Figure 7: Trade impact from extended baseline regression by RCA group
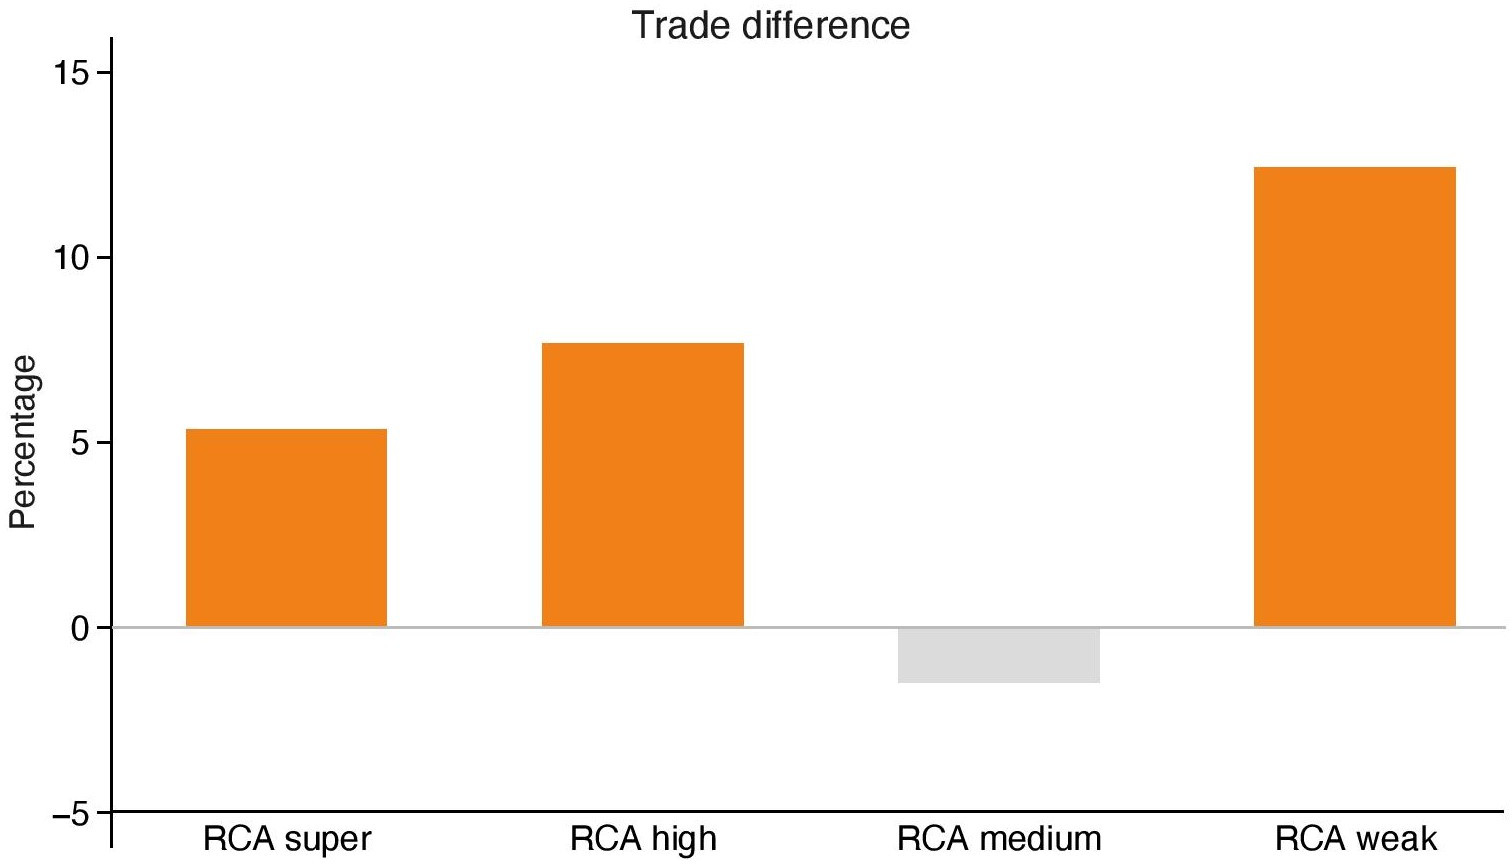
Note: Results correspond to the coefficient estimates reported in Table 9.
Table 10: Extended baseline regression by Internet usage
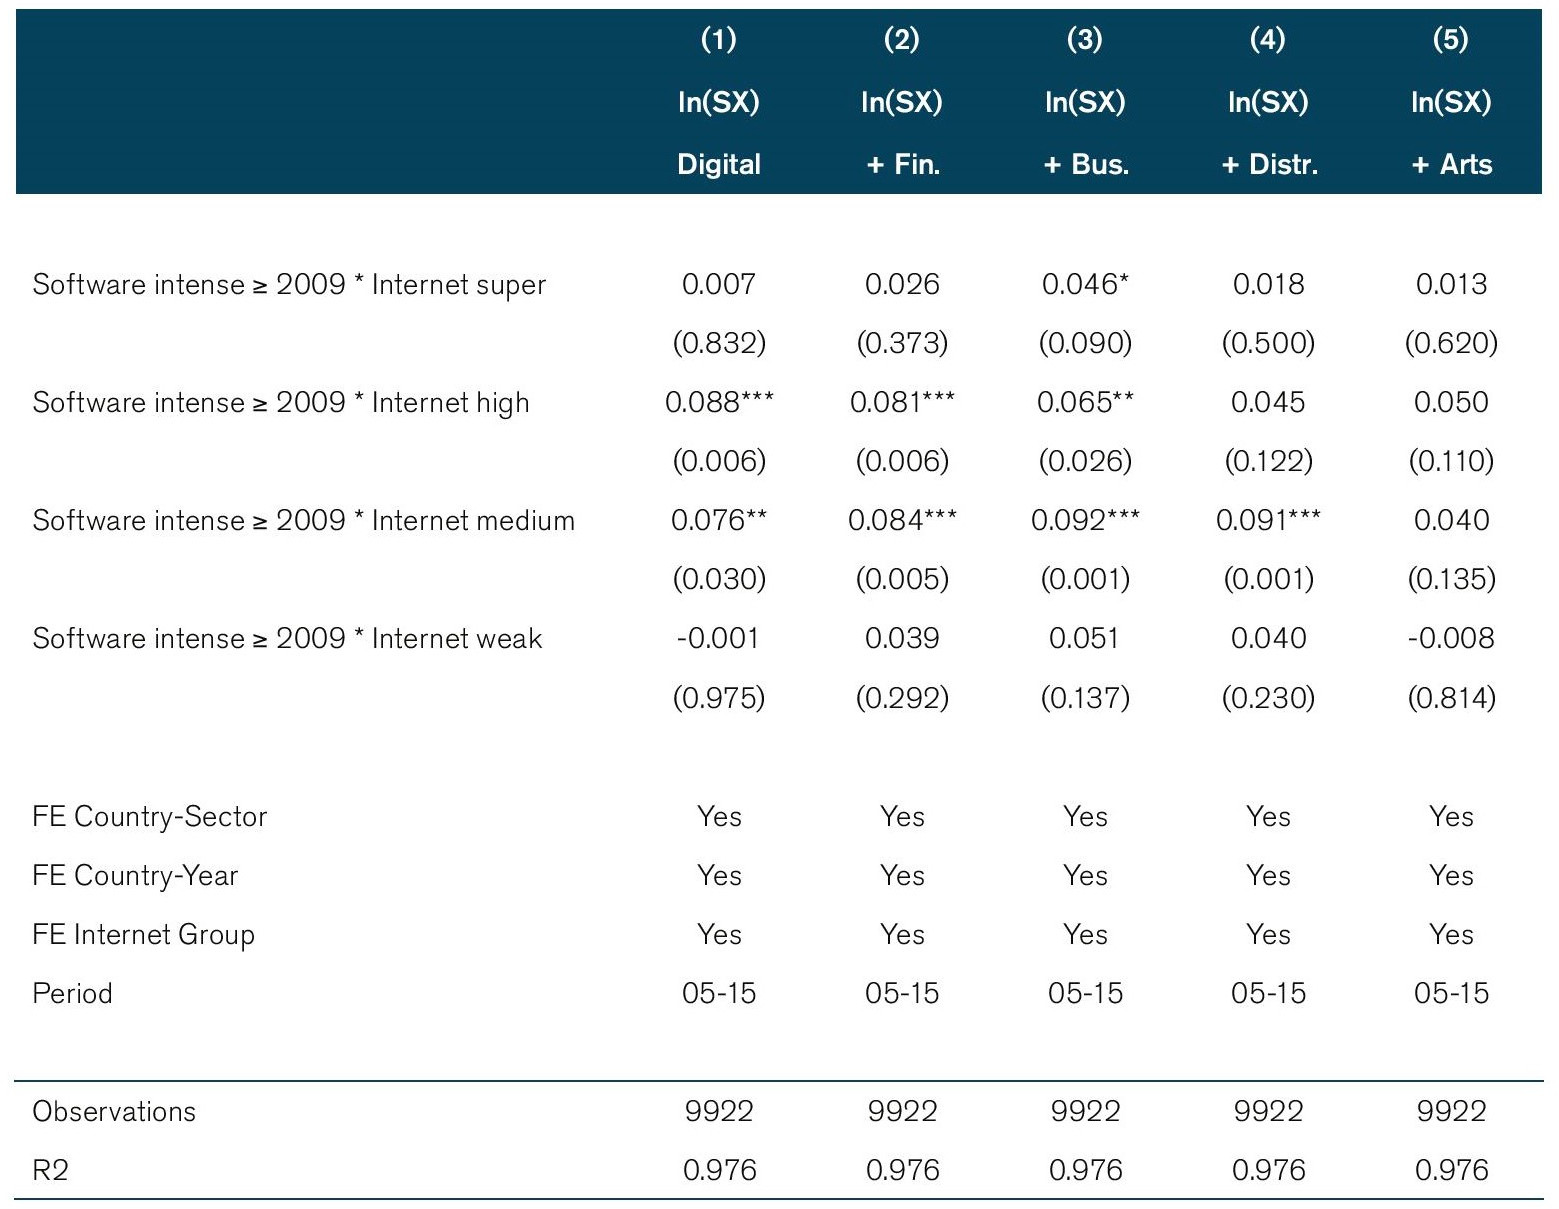
Note: * p<0.10; ** p<0.05; *** p<0.01. P-values are given in parenthesis. The dependent variable the log of services exports ln(SX) using data from the OECD TiVA database. Fixed effects are applied at the country-sector, country-year and internet-group level. Period of regressions is 2005-2015. Regressions are estimated with robust standard error clustered by country-sector-year. Column titles correspond to the sector specification as presented in Table 2.
Figure 8: Trade impact from extended baseline regression by Internet group
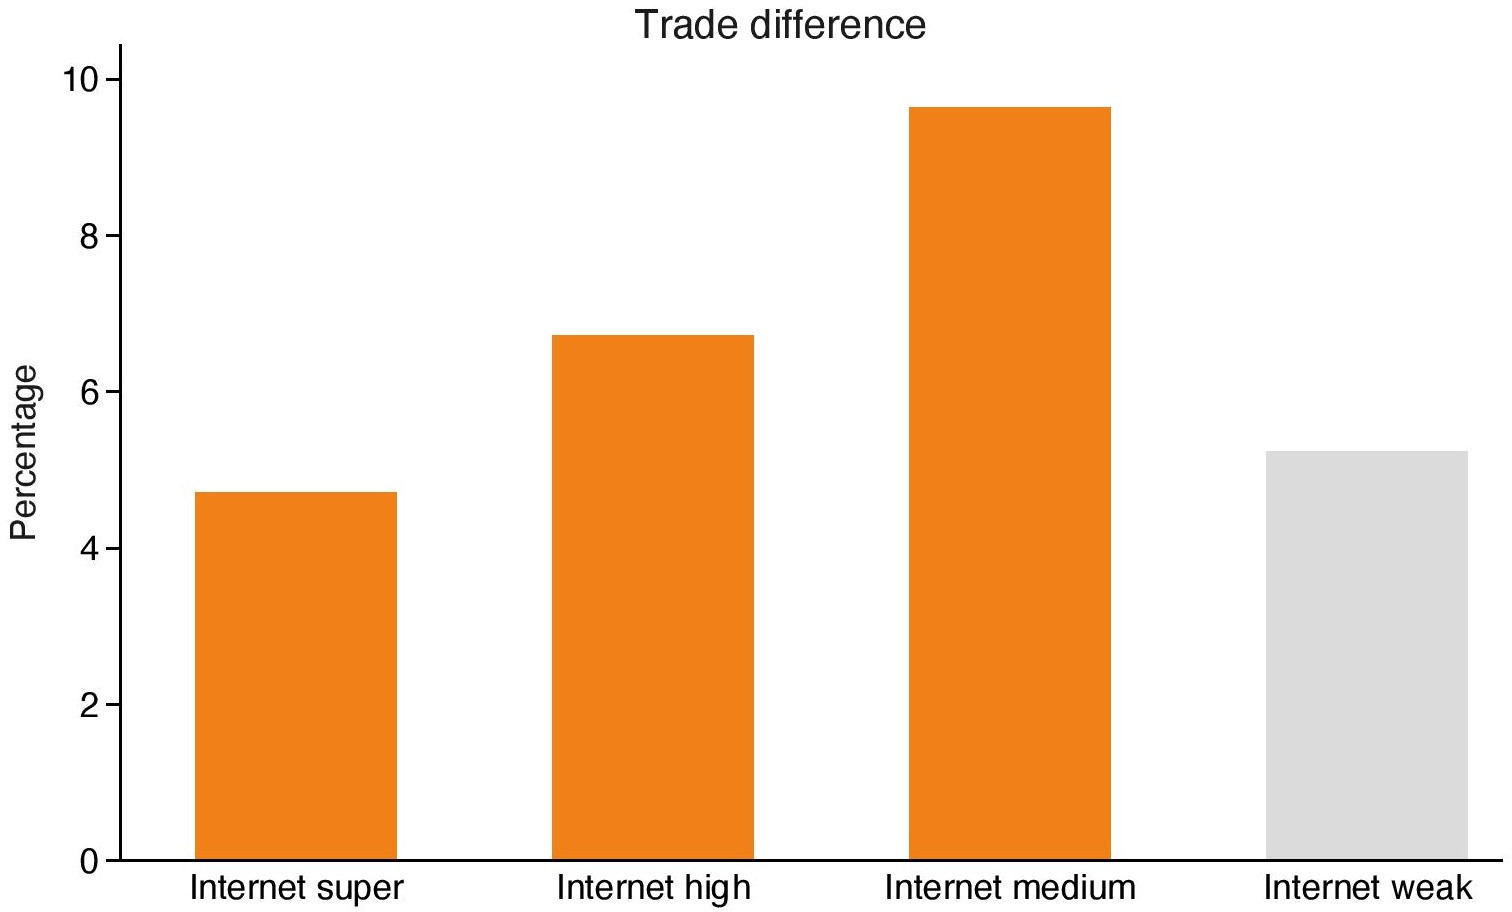
Note: Results correspond to the coefficient estimates reported in Table 10.
Table 11: Extended baseline regression by employment (services)
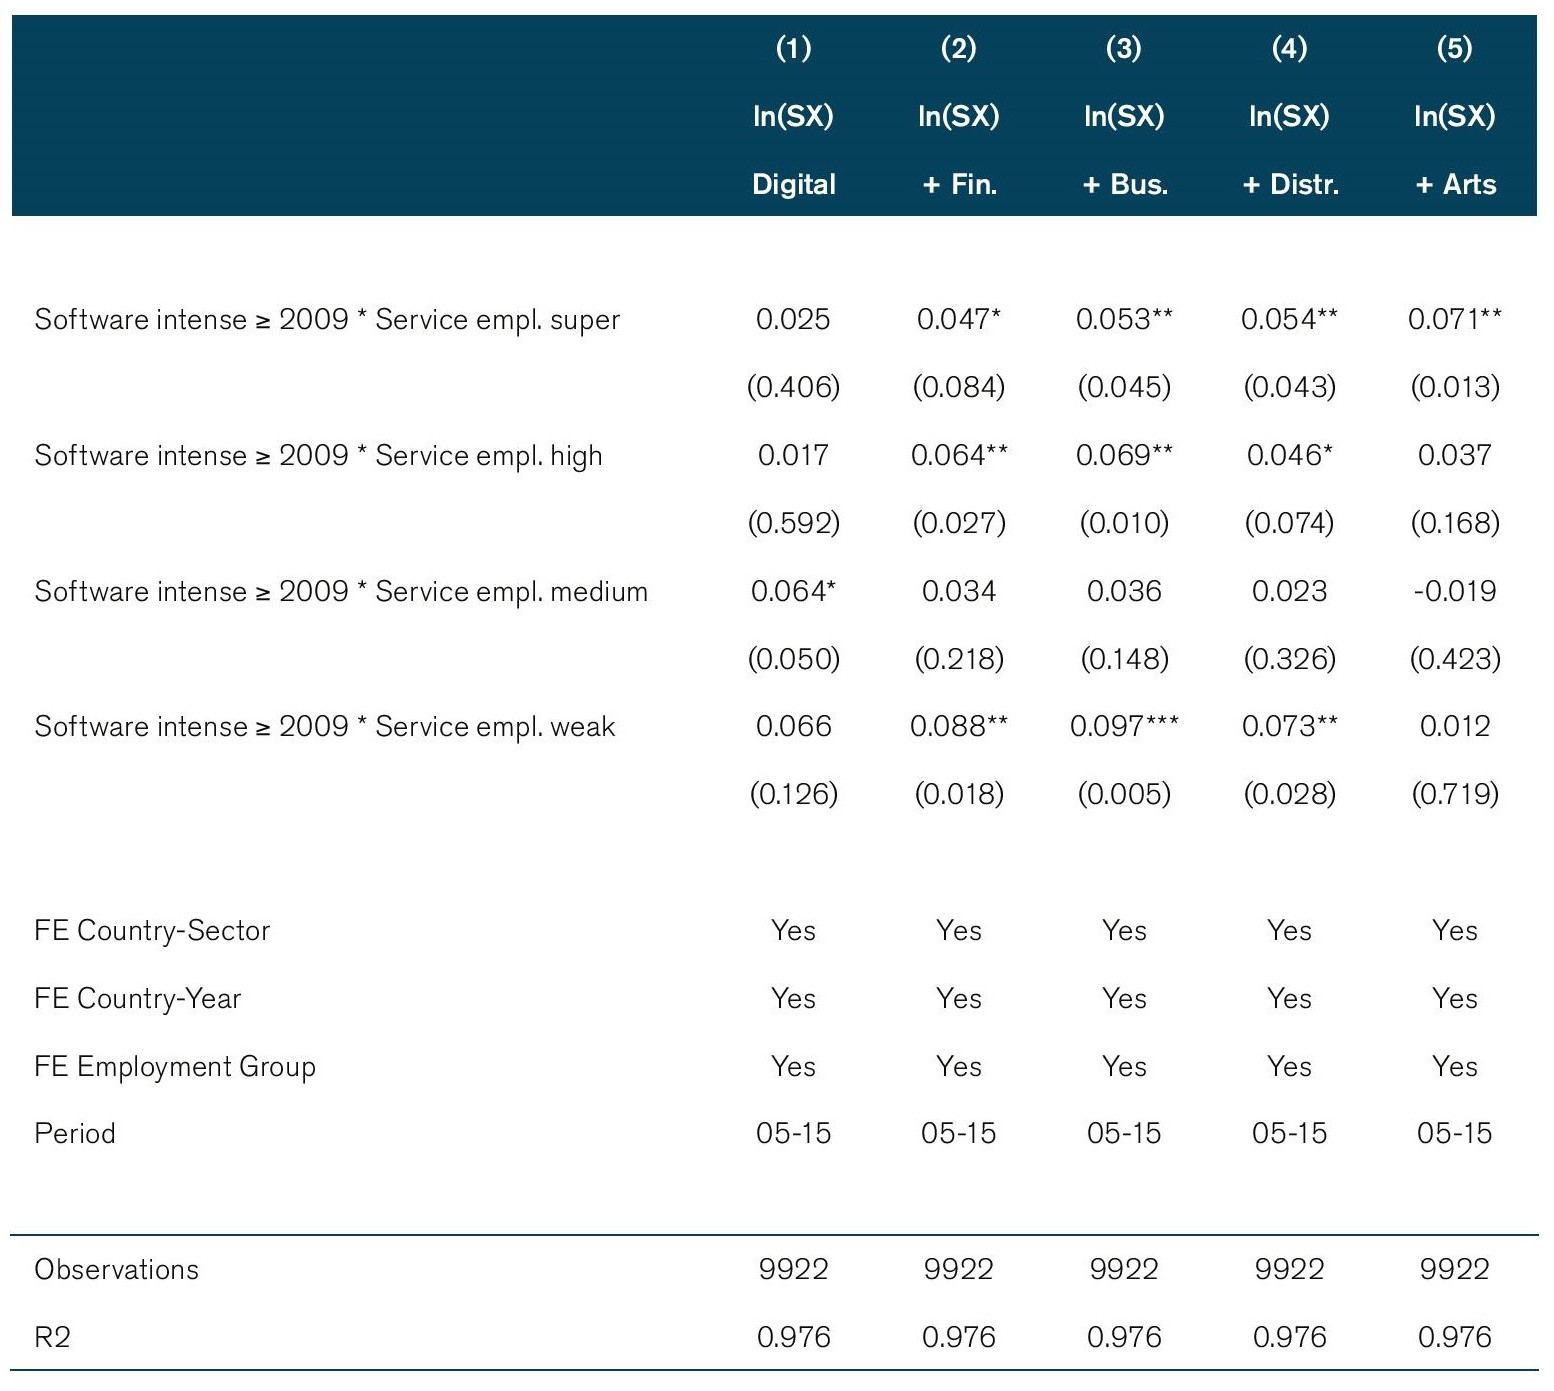
Note: * p<0.10; ** p<0.05; *** p<0.01. P-values are given in parenthesis. The dependent variable the log of services exports ln(SX) using data from the OECD TiVA database. Fixed effects are applied at the country-sector, country-year and employment-group level. Period of regressions is 2005-2015. Regressions are estimated with robust standard error clustered by country-sector-year. Column titles correspond to the sector specification as presented in Table 2.
Table 12: Extended baseline regression by employment (manufacturing)
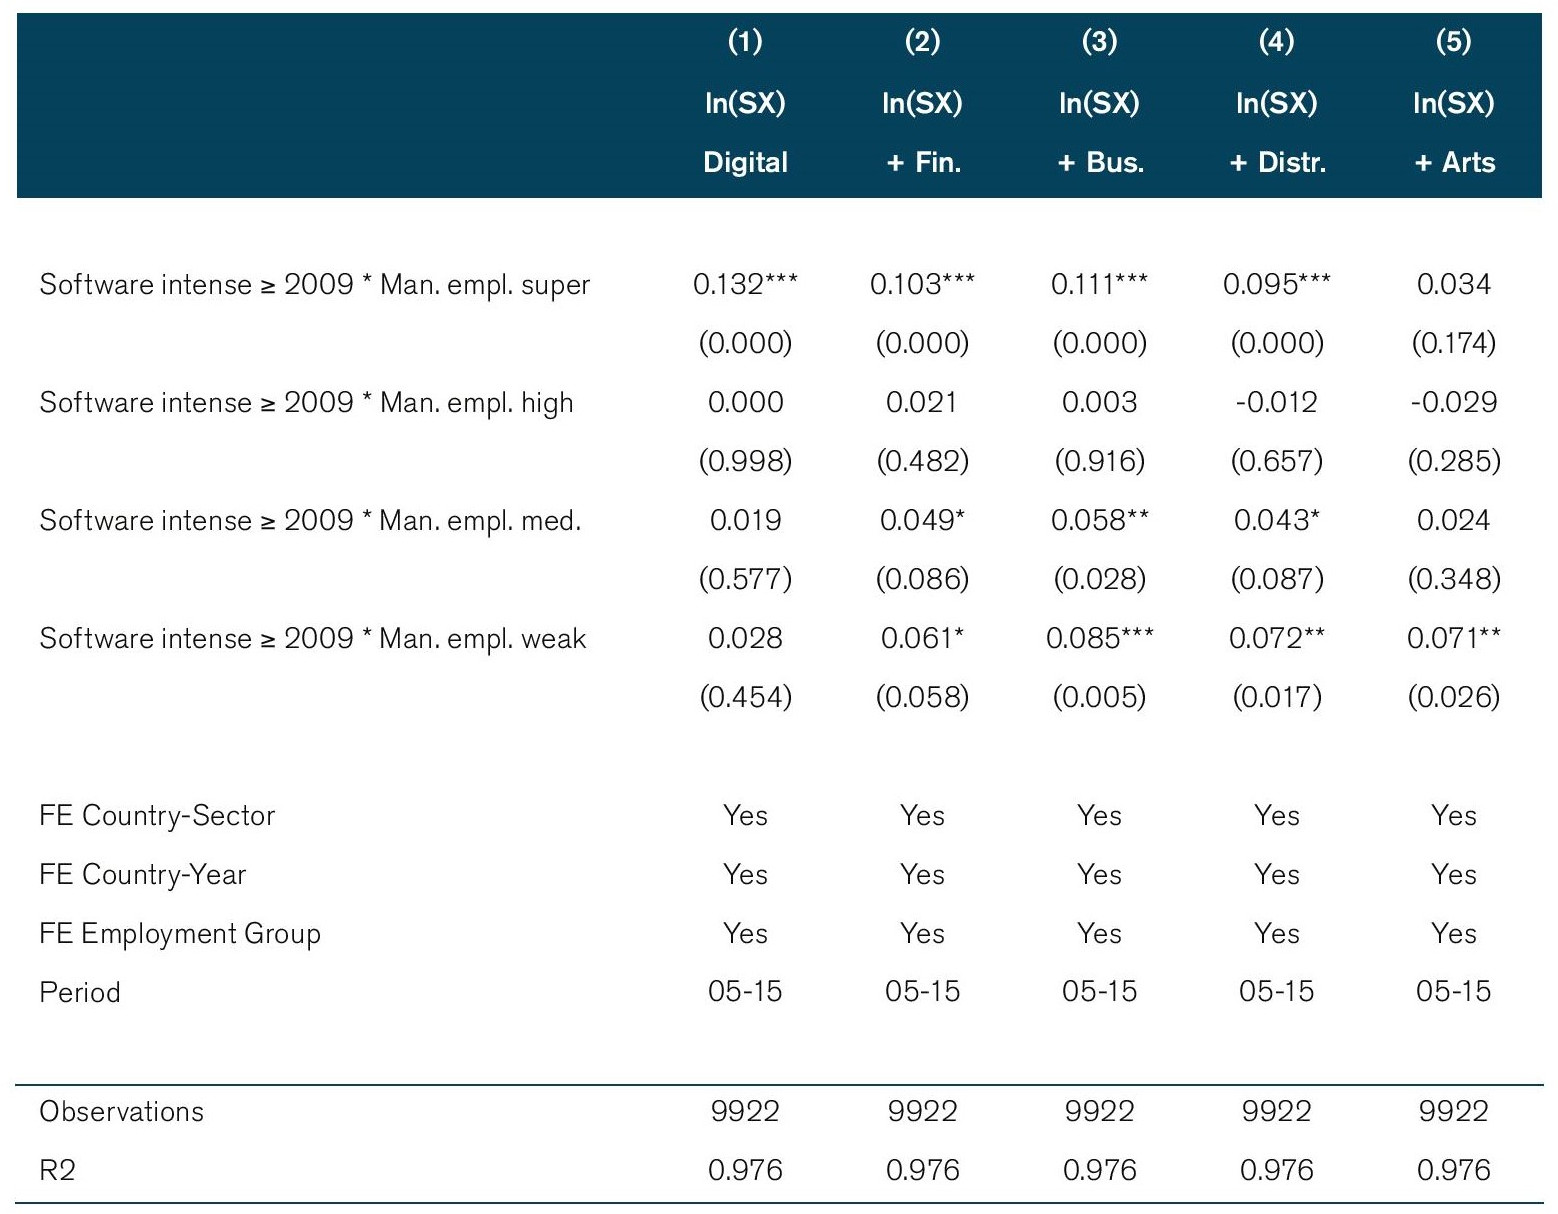
Note: * p<0.10; ** p<0.05; *** p<0.01. P-values are given in parenthesis. The dependent variable the log of services exports ln(SX) using data from the OECD TiVA database. Fixed effects are applied at the country-sector, country-year and income-group level. Period of regressions is 2005-2015. Regressions are estimated with robust standard error clustered by country-sector-year. Column titles correspond to the sector specification as presented in Table 2.
Figure 9: Trade impact from extended baseline regression by employment group
Note: Results correspond to the coefficient estimates reported in Table 11 and 12.
Table 13: Extended baseline regression by value-added (services)
Note: * p<0.10; ** p<0.05; *** p<0.01. P-values are given in parenthesis. The dependent variable the log of services exports ln(SX) using data from the OECD TiVA database. Fixed effects are applied at the country-sector, country-year and services-in-GDP-group level. Period of regressions is 2005-2015. Regressions are estimated with robust standard error clustered by country-sector-year. Column titles correspond to the sector specification as presented in Table 2.
Table 14: Extended baseline regression by value-added (manufacturing)
Note: * p<0.10; ** p<0.05; *** p<0.01. P-values are given in parenthesis. The dependent variable the log of services exports ln(SX) using data from the OECD TiVA database. Fixed effects are applied at the country-sector, country-year and manufacturing-in-GDP-group level. Period of regressions is 2005-2015. Regressions are estimated with robust standard error clustered by country-sector-year. Column titles correspond to the sector specification as presented in Table 2.
Figure 10: Trade impact from extended baseline regression by value-added group
Note: Results correspond to the coefficient estimates reported in Table 13 and 14.
Table 15: Baseline regression results using TiVA dataset for imports
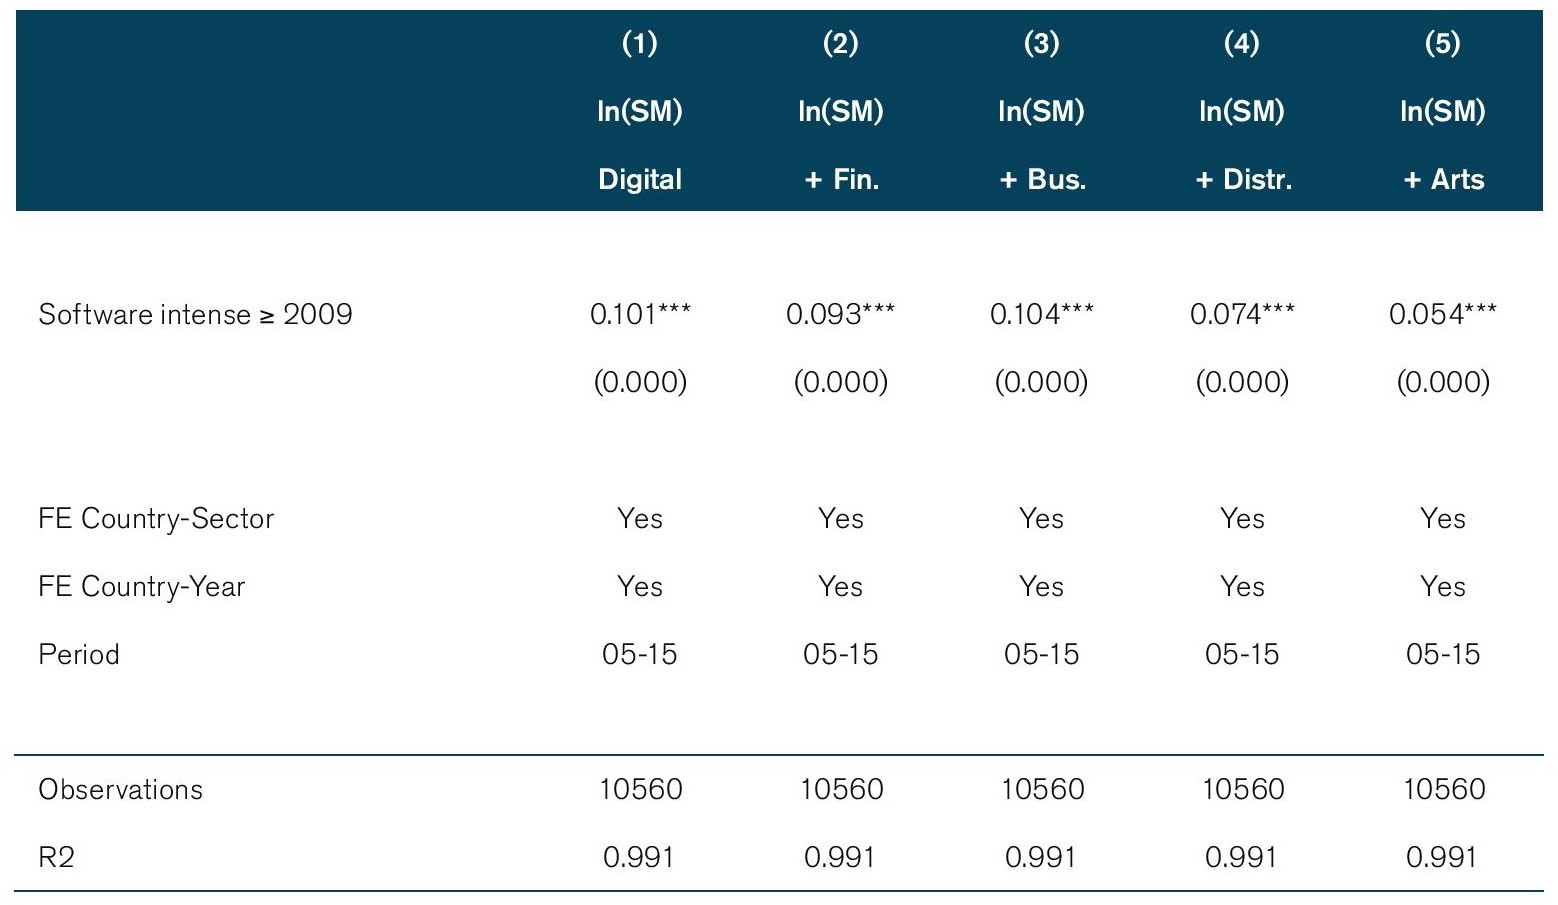
Note: * p<0.10; ** p<0.05; *** p<0.01. P-values are given in parenthesis. The dependent variable the log of services imports ln(SM) using data from the OECD TiVA database. Fixed effects are applied at the country-sector and country-year level. Period of regressions is 2005-2015. Regressions are estimated with robust standard error clustered by country-sector-year. Column titles correspond to the sector specification as presented in Table 2.
Table 16: Extended baseline regression using TivA dataset by income group for imports
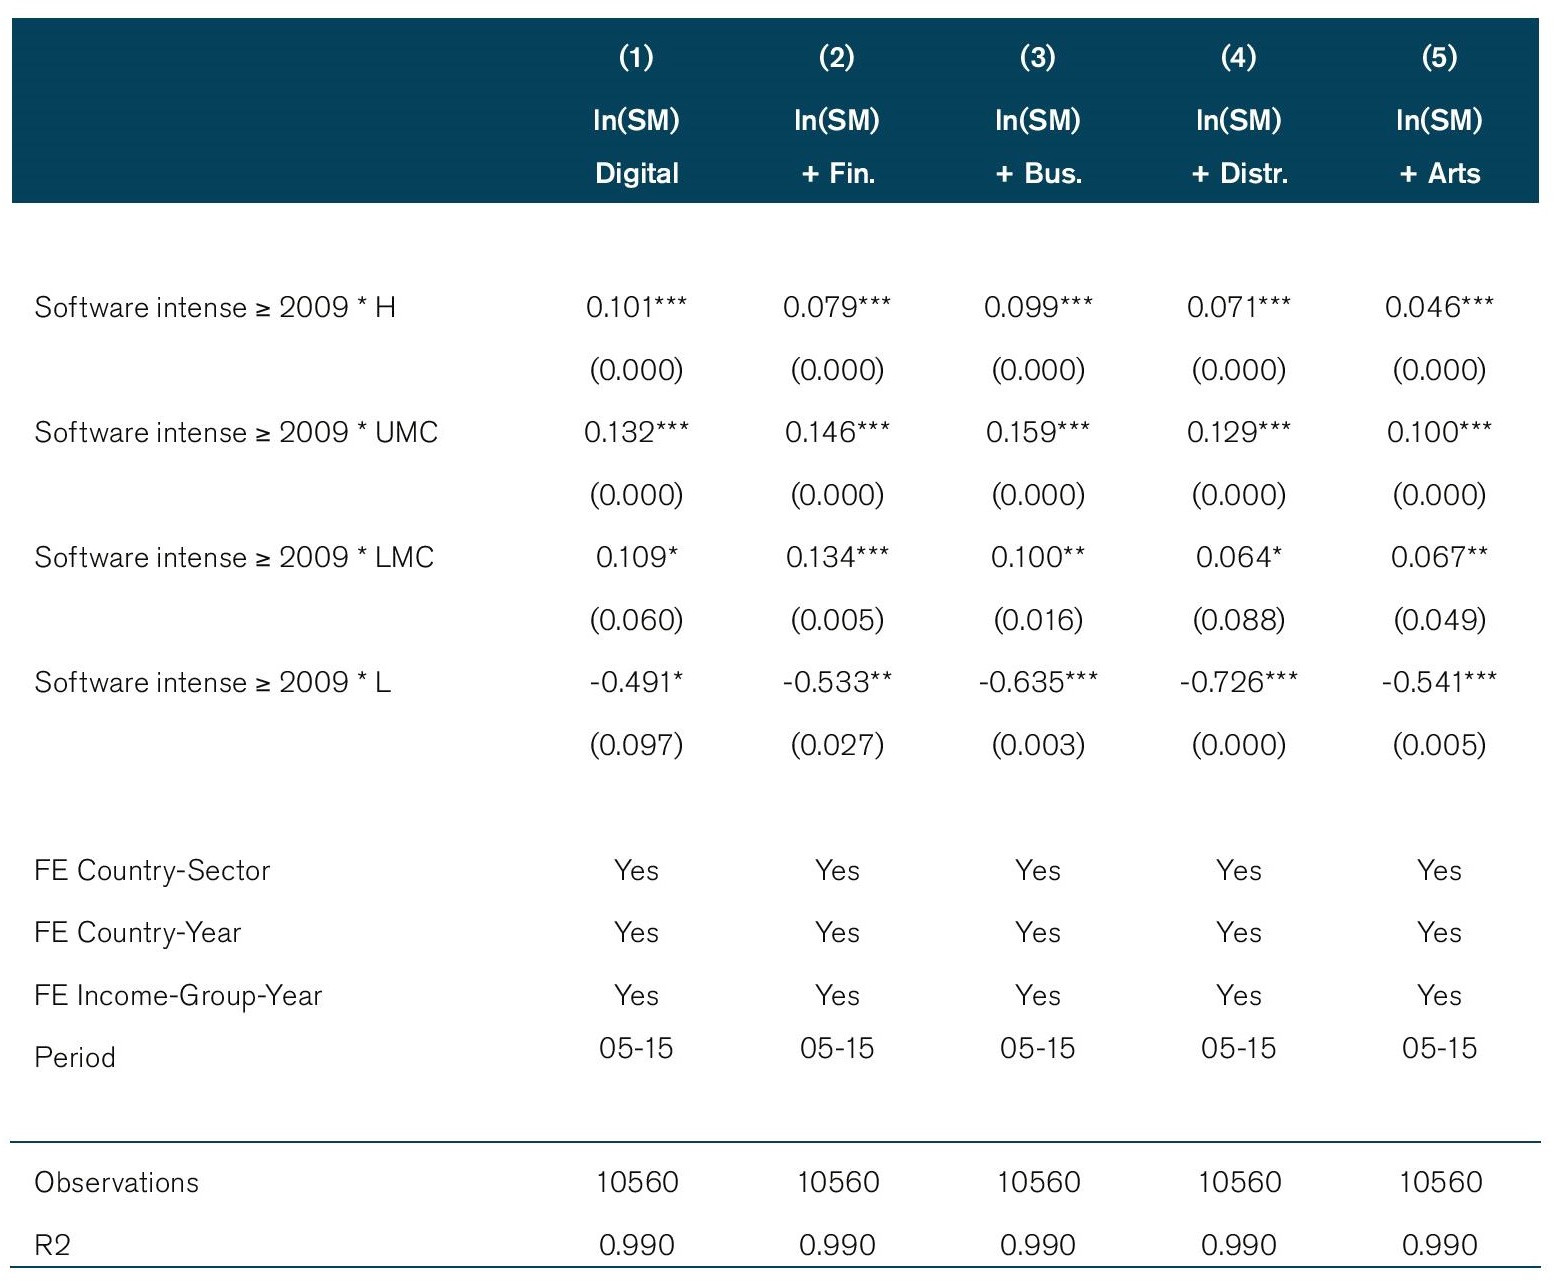
Note: * p<0.10; ** p<0.05; *** p<0.01. P-values are given in parenthesis. The dependent variable the log of services imports ln(SM) using data from the OECD TiVA database. Fixed effects are applied at the country-sector, country-year and income-group-year level. Period of regressions is 2005-2015. Regressions are estimated with robust standard error clustered by country-sector-year. Column titles correspond to the sectors presented in Table 2.
Figure 11: Trade impact from extended baseline regression using TiVA data by income group for imports
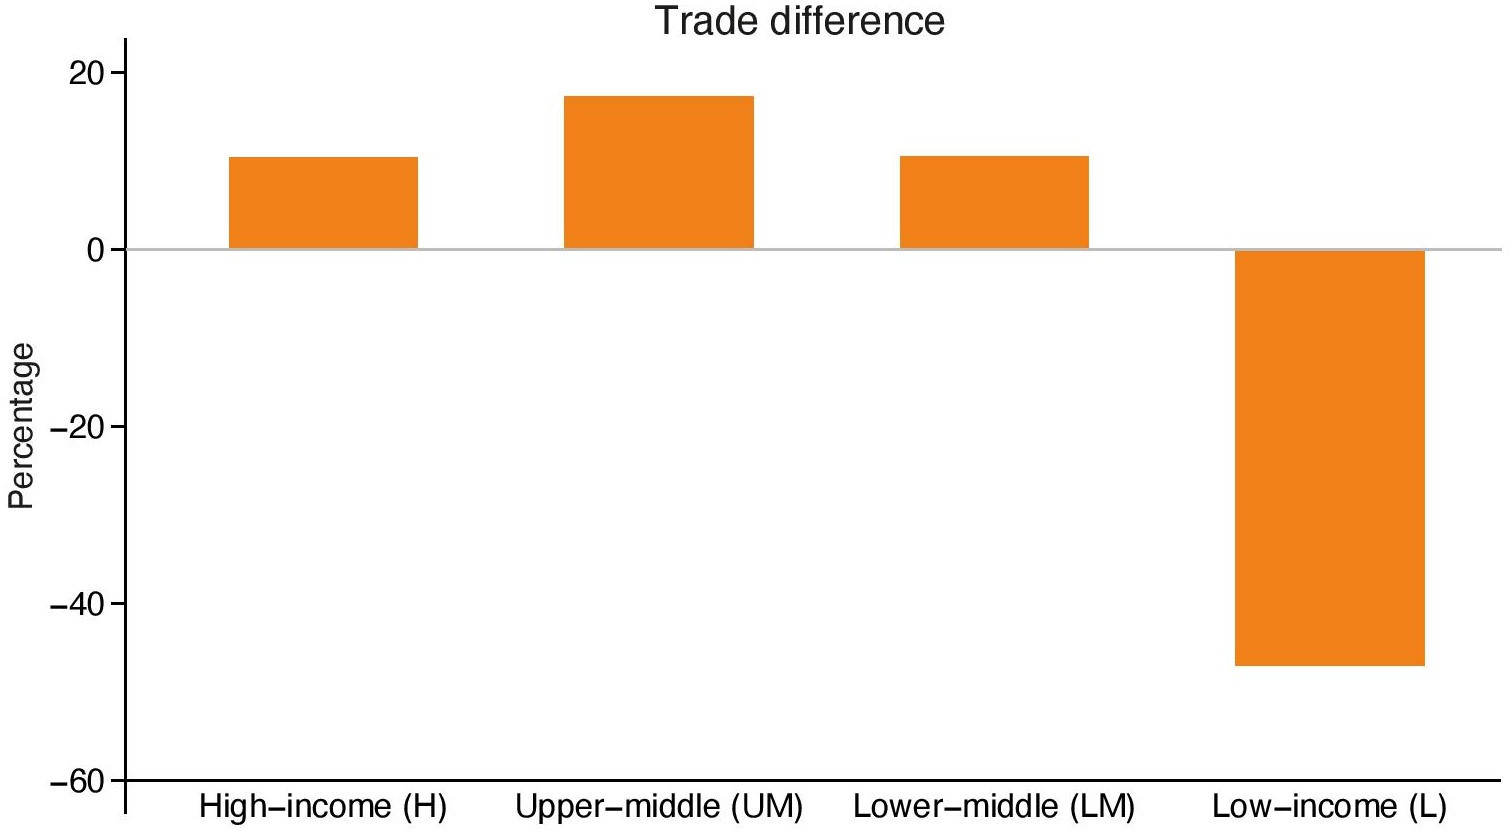
Note: Results correspond to the coefficient estimates reported in Table 16.
Figure 12: Map of countries exhibiting economic characteristics with internet usage
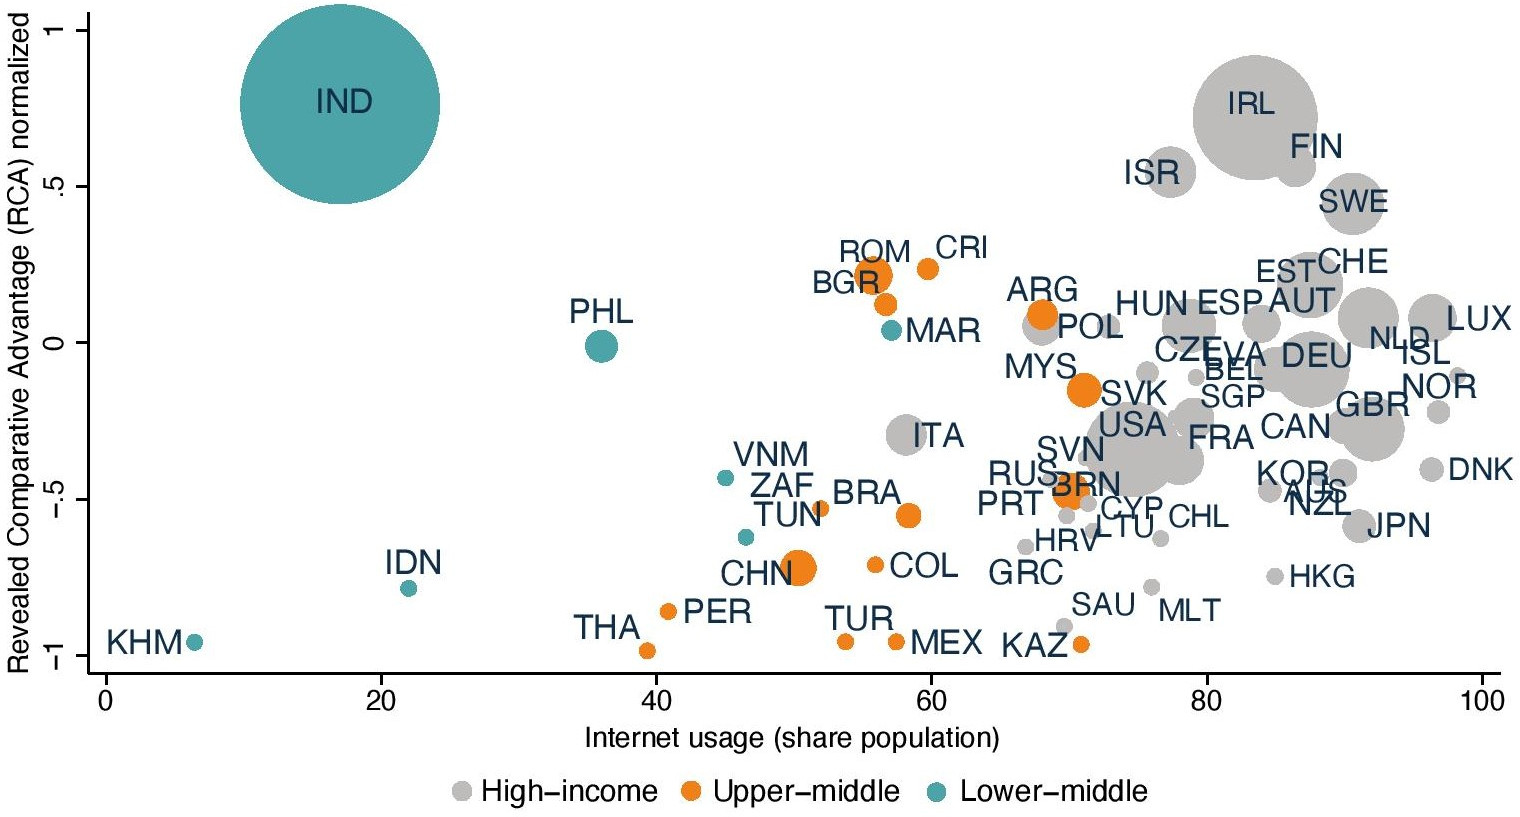
Note: Results correspond to the coefficient estimates reported in Table 1-16.
Figure 13: Map of countries exhibiting economic characteristics with services value-added in GDP
Note: Results correspond to the coefficient estimates reported in Table 1-16.
Figure 14: Map of countries exhibiting economic characteristics with manufacturing value-added in GDP
Note: Results correspond to the coefficient estimates reported in Table 1-16.
Annex A: The category of Royalties and licenses & Intellectual property
The category of Royalties and license and Intellectual property are two different names that refer to the same variable which are found in WTO-UNCTAD-ITC and OECD-WTO (BaTIS) trade in services databases. In the WTO-ITC-UNCTAD database, to which we refer as BPM6, this category is called Intellectual property whereas in the BaTIS database this category is denoted as Royalties and licenses.
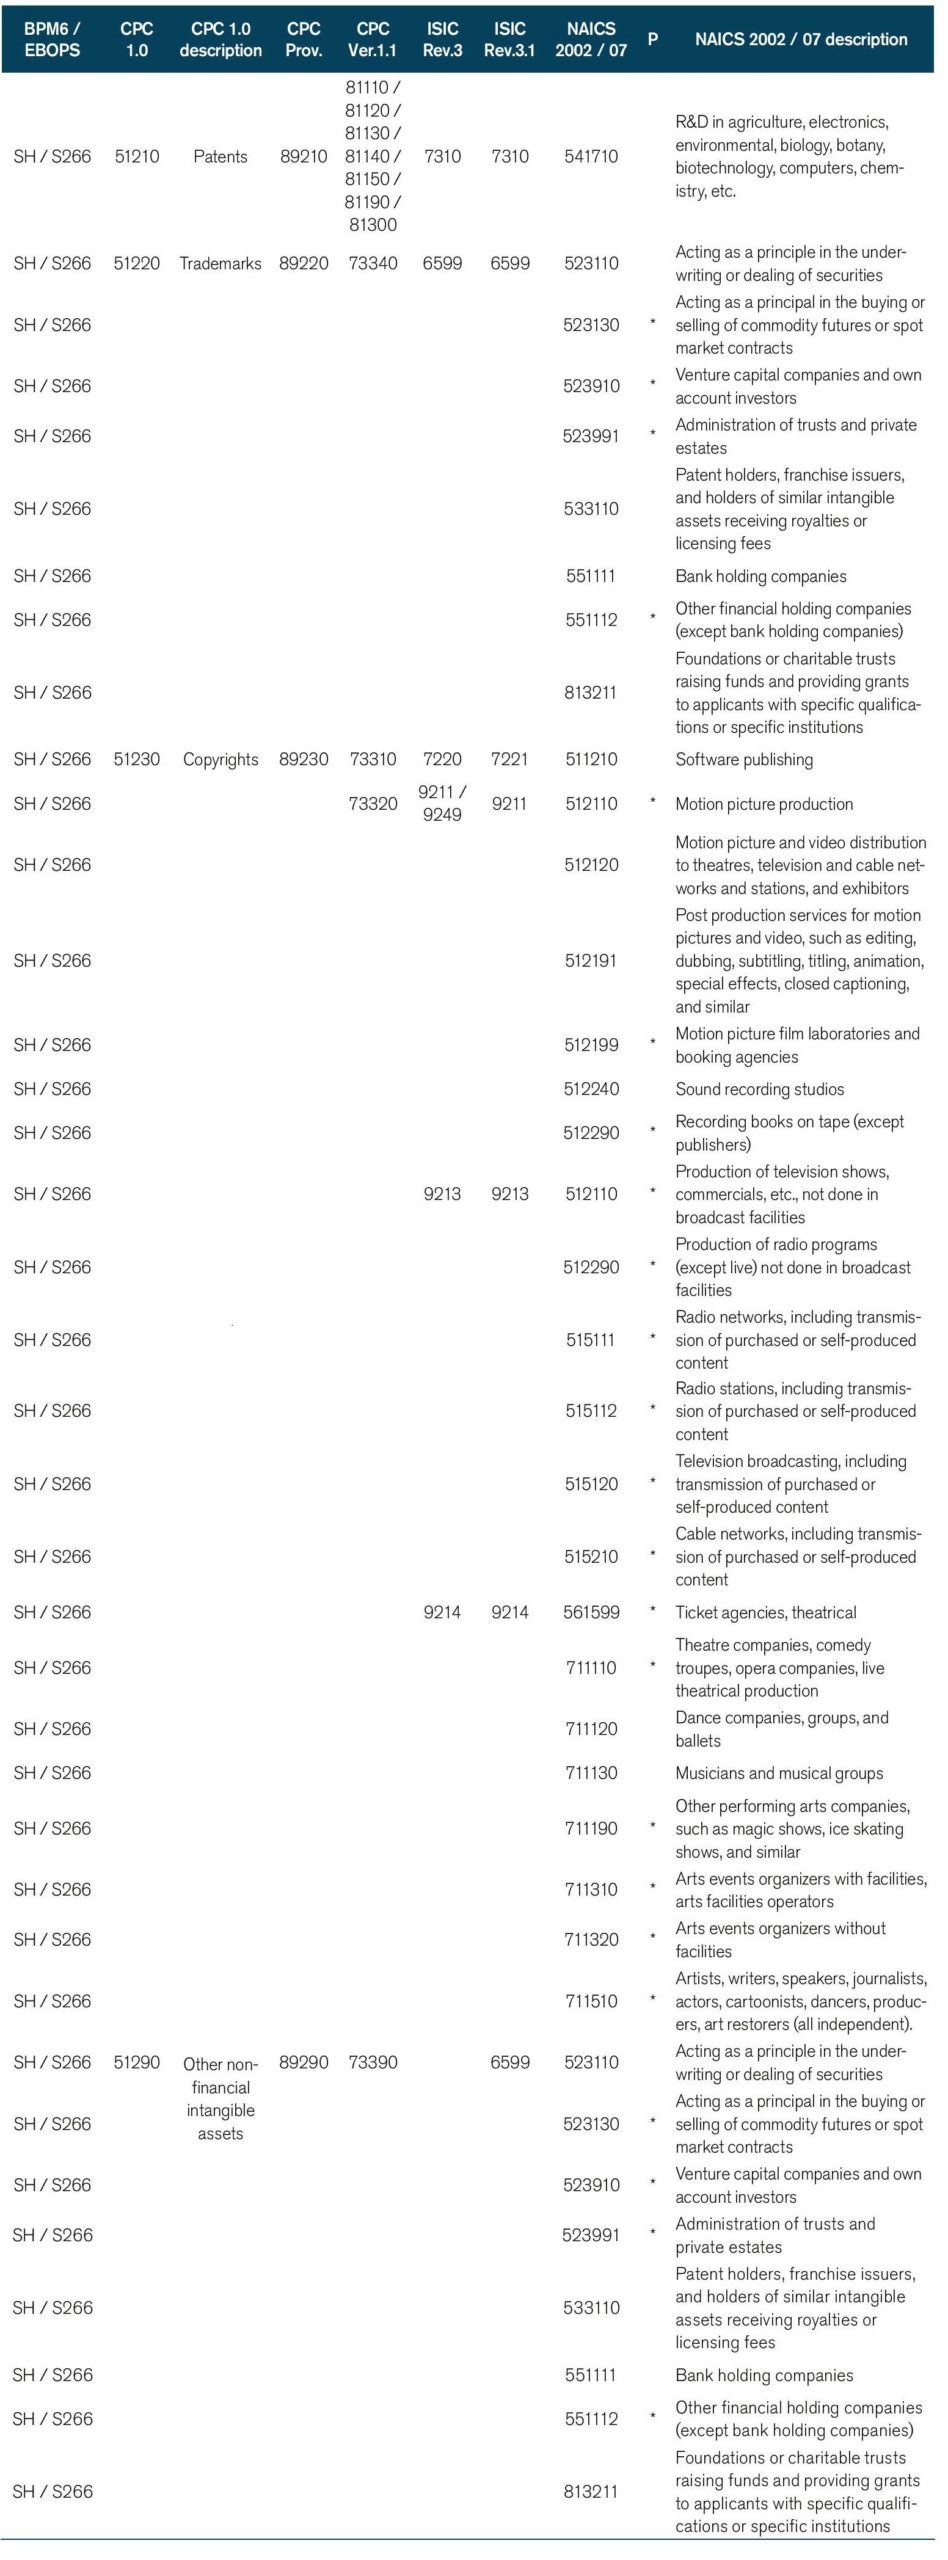
Unfortunately, no direct connection between the NAICS 2007 classification and the sectors Royalties and licenses nor Intellectual property can be made from where we have computed our data intensities, i.e. (D/L). Equally unfortunate is that no concordance table exists between NAICS and BPM6 and NAICS and EBOPS more generally. Therefore, we have constructed our own concordance tables and build them up from an extremely detailed 6-digit level. This is not too difficult when mapping each 6-digit NAICS code into a 2-digit BPM6 or EBOPS code. However, since no clear 6-digit NAICS code can be directly linked to the services category of Royalties and license or Intellectual property, we have extended our concordance scheme to include this sector. We have done so in an indirect way through other concordance systems. The result of this concordance process can be seen in Table A1.1 below.
The way to do so is not clear-cut and some assumptions need to be made. For starters, the WTO-UNCTAD-ITC trade in services database designates Intellectual Property as chapter “SH” following the 6th edition of the Balance of Payments (BPM6) while the OECD-WTO BaTIS denotes this category as S266 following EBOPS 2002. As said, both overlap and are therefore indicated as “SH / S266” in Table A1.1. To eventually arrive at the NAICS 2007 code, two sequential sources are needed. First, the Annex III of the MSITS 2002 EBOPS classification provides a concordance table between EBOPS and CPC 1.0, which is used as a first step. Four sectors are classified under 266 Royalties and license fees, namely Patents, Trademarks, Copyrights and Other non-financial intangible assets. With the help of the United Nations correspondence tables website (https://unstats.un.org/unsd/classifications), a concordance can be made between CPC 1.0 and finally NAICS 2007 through five successive steps as outlined in Table A1.1.
Many different NAICS 2007 codes fall into one of the four original CPC 1.0 codes and therefore not all of them are equally relevant for Royalties and licenses or Intellectual property services. For that reason, we are not taking all 6-digit NAICS 2007 which eventually trace back to the two BPM6 and EBOP 2002 sectors as given in Table A1.1. The reason is that not all NAICS 2007 sectors are fully covered by the two intangible sectors. We only identify those which are not partially covered. These sectors are given in bold in column “NAICS 2002 / 07” of Table A.11 and are not given an * under the column “P” (which stands for partial). The information on whether an item is covered partially or not also comes from the United Nations correspondence tables. To come up with 2-digit BPM6 and EBOPS 2002 sector intensities, we take the unweighted average of each data intensity of these designated non-partial NAICS 2007 sectors, which should give us eventually a good approximation of the level of data used in the two sectors of Royalties and license and Intellectual property.
As one can see, a mix of service sectors fall under the two sectors, namely R&D services, some financial services, as well as cultural services such as motion pictures and sound recording. Also trust funds are fully covered under this category of Royalties and license / Intellectual property. Of note, the NAICS sector 515120 is not included under EBOPS, but is covered under BPM6 following their respective manuals.
Table A1: Concordance for Intellectual property & Royalties and license fees
Source: United Nations, BPM6 and EBOPS 2002.