Patterns of Trade Restrictiveness in Online Platforms: A First Look
Published By: Martina F. Ferracane Erik van der Marel
Subjects: Digital Economy DTE Services
Summary
This paper develops a digital platform restrictiveness index for 64 countries based on ECIPE’s Digital Trade Estimates (DTE) database and the Digital Trade Restrictiveness Index (DTRI). We identify specific restrictions that affect online platforms with a focus on online search, e-commerce and social media. The results show that both OECD and non-OECD countries show high levels of trade restrictions on online platforms. Moreover, some of the most restricted countries are characterized by large markets, signifying that a substantial part of the global economy gravitates towards restricting online platforms. Based on the platform restrictiveness index, we perform an econometric analysis showing that trade restrictions for online platforms are significantly associated with lower contributions of the ICT sector to productivity growth in the entire economy. The results suggest that reducing restrictions on online platforms can increase the ICT’s contribution to overall productivity growth towards a level seen before the global financial crisis (GFC). Sectors that would benefit the most are those that make wider use of online platforms and the Internet, including information services, business services and financial services.
Corresponding author is Erik van der Marel, [email protected], Senior Economist at ECIPE & Université Libre de Bruxelles (ULB) and ECARES, Avenue des Arts, 40, 1040 Brussels; Martina Francesca Ferracane, [email protected], PhD candidate at Hamburg University, Research Associate at ECIPE & Policy Leaders Fellow at the European University Institute, Florence. We greatly thank Matthias Bauer, Senior Economist at ECIPE and Hosuk Lee-Makiyama, Director at ECIPE, for valuable input while developing this paper. We also thank Nicolas Botton, Valentin Moreau and Cristina Rujan for excellent research assistance.
1. Introduction
Internet and digital services are becoming ubiquitously spread across the world and an integral part of everyday life for most people. Almost half of the world’s population is connected to the Internet nowadays whilst trade in digital services is growing fast.
In this context, digital platforms become increasingly important to facilitate activities online, mainly by lowering transaction and information costs for businesses and consumers. Platforms exist in many areas such as software operating systems, portals, media, healthcare services and payment systems. Platforms create a so-called two-sided market, connecting two different end-user groups with each other by generating network benefits. This means that the value of the platforms and their related services depend on the number of users using the services of the platform (Rochet and Tirole, 2004). Platforms help facilitate the exchange of not only goods and services, but also social exchanges and exchanges of all sorts of information, which would not be easily matched (or traded) in the first place without the use of platforms.
Digital platforms bring along clear benefits for the economy. By creating an efficient network system, platforms can reduce transaction costs for businesses as they often have a collected pool of suppliers to buy services and goods as final goods or intermediate inputs. In addition, platforms also lower search costs for firms and consumers alike by reducing the amount spent on finding a match in taste and quality for goods and services. In turn, platforms also reduce so-called opportunity costs for businesses and consumers as the Internet provides transparent information on the next best alternative products or services available. More generally, platforms contribute to solving a long-standing economic problem by reducing information asymmetries between the buyer and seller using feedback mechanisms. The quality of the product becomes easier to assess by consumers. This is an especially welcome aspect for services in particular, as many have suffered from information asymmetries.
However, platforms face increasing levels of regulation, which in certain cases can affect their potential to grow and therefore the likely economic benefits deriving from network effects. In this paper, we look specifically at the regulatory trade restrictions that digital platforms encounter when entering or operating in a foreign market. In particular, we investigate the level of restrictiveness for 64 countries with respect to their regulatory trade policies applied to search engines, e-commerce and social media platforms. Regulatory restrictions on online platforms include, among others, data policies that restrict the domestic use of data and the movement of data across borders, restrictive measures related to intermediary liability, and policy restrictions on online sales and transactions such as on online payments (see Table A1). These policies belong to a recent wave of measures directly targeting the digital economy (see Ferracane et al. 2018a).
The policy measures we look at are those that restrict online platforms from operating in a foreign market by increasing the costs of doing business. We collect these measures and summarize them in an index that we call “Digital Platform Restrictiveness Index” (DPRI). This composite indicator measures the level of restrictiveness for online platforms across the 64 countries selected, which cover both developed, emerging and developing countries. The DPRI therefore assesses the trade cost position regarding digital platform policies for each country by taking into account the restrictiveness of each policy measure applied by a country.
We then investigate empirically the link between the DPRI and the country’s economic performance in order to analyse whether stricter restrictions on online platforms is associated with the ability of ICT to be a contributor to overall productivity growth of services that rely on digital platforms. The analysis is limited to a set of European countries for which data is available. We find that stricter levels of regulations on digital platforms are significantly correlated with lower levels of contribution of ICT to productivity growth. In particular, publishing services and other business services appear to suffer the most from higher levels of platform restrictions. We also find that if the level of restrictive digital platform regulations were to be decreased to a lower level, the level of contributions of ICT to the growth of labour productivity would increase towards the level found before the global financial crisis (GFC). This would substantially increase the overall growth performance.
This paper is organized as follows. The next section presents the DPRI and the results for 64 countries. It also discusses which categories of digital platform restrictions are more common in the countries that are found to be the most restrictive. Section 3 explores patterns of platform restrictiveness using the DPRI and relates it to several meaningful economic variables. Section 4 assesses empirically the extent to which restrictions on digital platforms are associated with lower levels of ICT contributions to productivity growth in services. The last section concludes.
2. Digital Platform Restrictiveness Index
This section presents the results of our DPRI, which we have developed for the purpose of this paper. The index collects all of the restrictions considered relevant for online platform activities, and does so across 64 countries, varying from high income to low-income countries. The index follows a commonly employed approach for creating an index (see Box 1) and builds on the information provided by ECIPE’s Digital Trade Estimates (DTE) database and the methodology developed to build the Digital Trade Restrictiveness Index (DTRI).[1] The DTRI and DTE database list all the categories of digital trade policy restrictions across a similar set of countries and therefore this list of restrictions is wider than the list of restrictions selected for the DPRI. To our knowledge, no previous work has assessed comprehensively policy restrictions on online platforms and compiled these into a restrictiveness index.
This section presents the level of platform restrictiveness for the countries covered by the DPRI. The next section discusses some patterns of the DPRI before moving into analysing whether digital platform restrictiveness is significantly associated with various economic variables, which is done in Section 4.
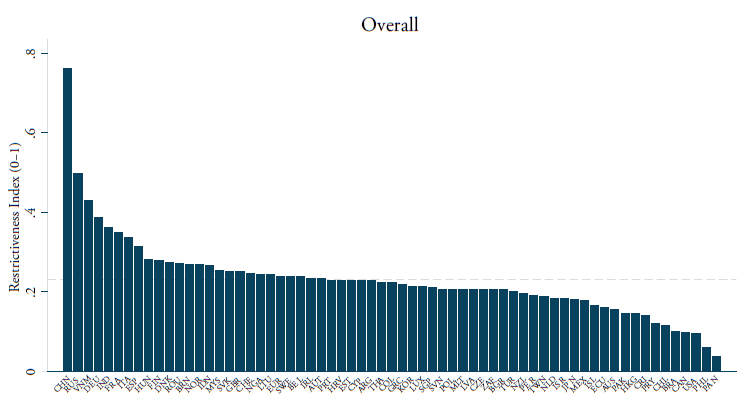
Figure 2.1 ranks the DPRI score for the 64 countries analysed. The index ranges between 0 (regulatory regime completely open for online platforms) and 1 (regulatory regime virtually closed for online platforms) with increasing values representing higher levels of online platform restrictiveness. China is the most restricted country in our ranking in terms of costs for foreign online platforms. The country has a restrictiveness score of 0.76 and therefore shows that it is not far from being an entirely closed market for foreign online platforms willing to access and operate in the Chinese market. China applies high restrictions in all policy categories as defined in Box 1. After China, the country with the highest score is Russia with a score of 0.50. The country shows high levels of restrictions, especially relating to investment and data flows. The average score of the DPRI for the 64 countries is 0.23, as indicated by the dashed line in Figure 2.1.
Figure 2.1: Digital Platform Restrictiveness Index (2018)
Source: ECIPE
After China and Russia, there is a diverse group of countries with a score higher than 0.30, signifying that they still have some major restrictions in place. This group includes a number of European countries as well as emerging economies. Germany is the fourth most restricted country with a score of 0.39 and is placed just after Vietnam with a slightly higher score of 0.43, which therefore ranks it third. The next two countries, ranked fifth and sixth, are India and France with respective scores of 0.36 and 0.35. After that, the only other countries with a score above 0.30 are Italy and Spain with respective scores of 0.33 and 0.32. As such, the Top 8 most restricted countries with a score higher than 0.30 is comprised half of European countries and half of countries with emerging economy.
Other countries with a score higher than the average score of 0.23 are similarly a mixed basket and also include several European countries. Hungary, Finland, Denmark, Romania, Norway, the UK, Slovakia, Switzerland, Lithuania, Belgium, Sweden, Austria and Ireland all show above-average positions together with Brunei, Indonesia, Malaysia and Nigeria. The latter three countries, together with China, India and Russia all have a significantly lower level of development than most European countries that are ranked above the average score of one platform restrictiveness.
The least restricted country in our ranking is Panama with a score of 0.04. In general, the group of least restricted countries regarding digital platforms are economically very diverse. The 10 least restricted countries, after Panama, include, on the one hand, a group of developing economies such as the Philippines (0.06), Brazil, (0.10), Paraguay (0.12), Costa Rica (0.14) and Pakistan (0.15), and, on the other hand, a group of developed economies such as the US (0.10), Canada (0.10), Chile (0.12) and Hong Kong (0.15). Other countries that have a lower than average score are Czech Republic, Thailand, Bulgaria, Turkey, Argentina, Israel, Korea and Japan. Similarly, in this case the group of countries is also very diverse. For instance, Korea and Japan are manufacturing powerhouses, whereas Argentina has a large agricultural sector.
The difference in scores between the most and the least restricted countries is substantial. This gap can be measured by the “distance” between the regulatory framework of each country and the “regulatory frontier”, that is the regulatory framework adopted by a group of countries that apply the most business-friendly policies for online platforms. In Figure 2.2 the horizontal dashed line shows the regulatory frontier. Certain countries, such as Canada and the USA, are very close to this frontier. The location of each country along the downward sloping line in the figure indicates the distance between the country regulatory framework and the frontier. Not surprisingly, China is furthest away from the frontier and is placed far behind all other countries. The big distance for China shows that the country’s regulatory gap is extremely large. Russia comes next, also with a significant distance from the frontier. Other countries like Japan and Sweden are much closer to the frontier, indicating that they have created a regulatory environment similar to the best performers.
The magnitude of the country circles in Figure 2.2 represents the size of the market. It shows that, besides the varying levels of economic development, both groups of the most and the least restricted countries also differ in market size. The USA, Brazil and Pakistan are populous countries that find themselves relatively close to the regulatory frontier. Yet some of the world’s other largest markets can be found among the countries that are the most restricted. India is in the middle, but the country comes fourth in the overall ranking and is very big. When looking at the European Union, the most restricted countries are also fairly large. Even though some restricted European countries are much smaller in market size, especially when compared with countries such as China and India, within Europe the four most restricted countries will also be Europe’s largest economies after Brexit.
Figure 2.2: Distance to the regulatory frontier for platform restrictions (overall)

Source: ECIPE
Figure 2.3 covers the composition of the DPRI for the eight most restricted countries in the overall DPRI ranking. As outlined in Box 1, we identify eight different categories of restrictions relevant to online platforms. In most countries, restrictive measures related to data represent on average the greatest portion of their DPRI, accounting for almost 30 per cent of the overall level of restrictiveness. Content access restrictions are also quite pervasive, as well as measures related to online sales and intermediary liability. On the other hand, restrictions on investment and standards have a lower fraction of restrictiveness. That however conceals the fact that for a country like Vietnam or China, restrictions related to content access represent a greater share of restrictiveness compared to European countries. Regarding restrictions on data, all Top 8 countries have equally burdensome restrictions, except India where this fraction only represents a minor part of India’s index. India’s pattern may be explained by its long tradition of producing digital services.[2]
Figure 2.3: Top 8 countries with highest DPRI, restrictions by category (2018)

Source: ECIPE
Restrictions on investment and standards, on the other hand, are much less frequent among the Top 8 most restricted countries. For instance, India and China are the only countries that hold restrictive standards for online platforms. Countries that hold at least one restriction in the area of investment that affects online platforms are Australia, Bulgaria, Canada, China, France, Germany, Greece, India, Indonesia, Ireland, Korea, Mexico, New Zealand, Norway, the Philippines, Russia, South Africa, Taiwan, Thailand and the UK.
Restrictions related to content access, online sales and transactions, intermediate liability as well as IPR measures make up an intermediate share in Figure 2.3. Vietnam has the biggest component of restrictions related to content access followed by China. Vietnam also has the highest share of restrictions related to intermediate liability compared to the other Top 8 countries. Two European countries show relatively higher levels of restrictiveness in the area of IPR compared to the other Top 8 countries, namely Spain and Germany. France shows that besides its data-related component, a relatively high share of restrictiveness is related to online sales and transactions as this policy area also comprises a substantial part of its overall restrictiveness level.
[1] The database is available at the link www.ecipe.org/dte/database. The DTRI methodology is available in Ferracane et al. (2018a).
[2] It should be noted, however, that in India a new law affecting the use and transfer of data is currently under discussion. This proposed law is more restrictive than the current regime.
3. Patterns of digital platform restrictiveness
Besides showing platform restrictiveness broken down by category of restrictions, restrictions can also target different types of platform. Following Siwek (2017) and our explanations in Box 1, we identify three categories of platforms, namely (a) search engines, (b) e-commerce platforms, and finally (c) social media platforms. These three types of platforms together account for 88 per cent of total revenue related to Internet activity and 87 per cent of most Internet-related employment in the US when looking at the 20 largest Internet companies in the US. Focusing on these three types of platforms therefore reflects a sufficient representative picture of the majority of today’s online platform activities across countries.[1] We isolate the specific restrictions that target each of these three types of platforms separately for the 64 countries. Annex Table A1 shows the weights applied to construct the three indexes.
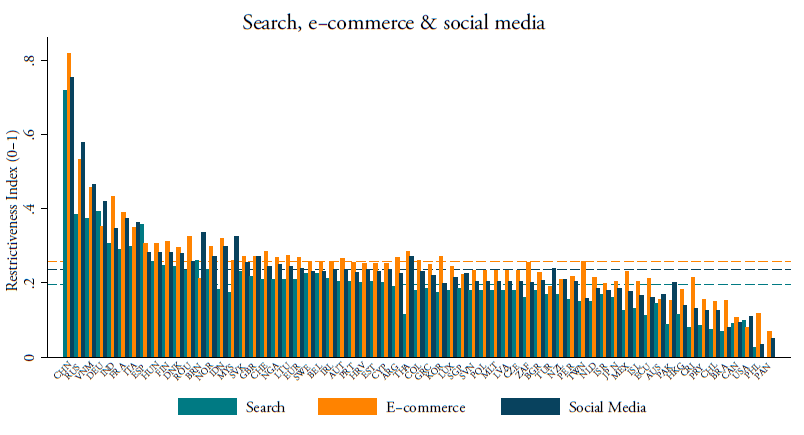
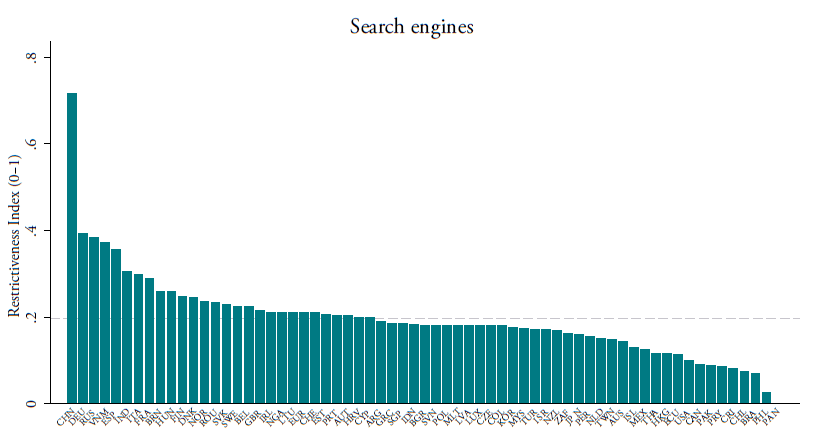
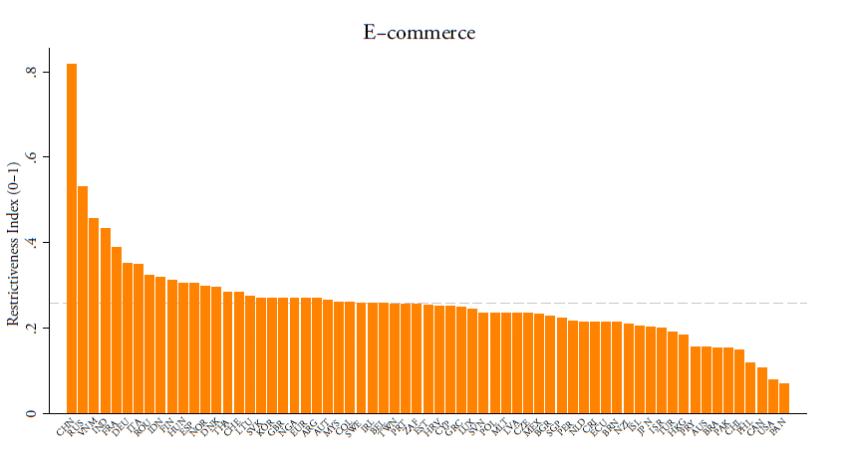
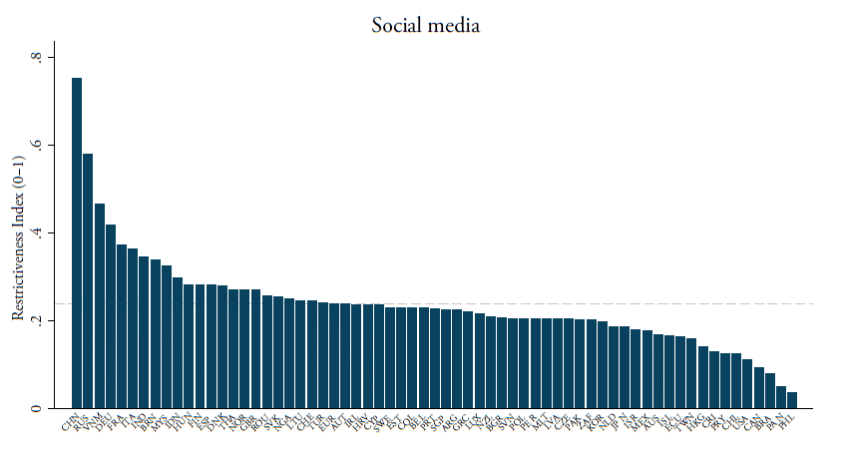
Figure 3.1 shows the level of trade restrictiveness for the 64 countries when looking separately at the three types of online platforms. Similar to the overall DPRI, the three indexes vary between 0 (completely open) and 1 (virtually closed). Annex Figures A1, A2 and A3 show the index rankings of the platform restrictiveness in search engines, e-commerce and social media in respective order separately. Again, increasing values represent higher levels of online platform restrictiveness. The dashed lines show the three corresponding average levels of restrictiveness respectively. Overall, e-commerce platforms show the highest level of restrictiveness, with an average score of 0.26. The average level of restrictions for search engines is the lowest with a score of 0.20. The average level of social media restrictions stands at 0.24.
The level of restrictions across the three types of platforms differs from country to country. On the one hand, China, Russia and Vietnam hold the highest levels of restrictions when it comes to social media and e-commerce platforms, while China, Germany and Russia are the most restricted countries regarding search engines. Indonesia also appears to be fairly restricted for e-commerce platforms with a score of 0.32. In addition, France holds relatively high restrictions related to e-commerce but does so as well for social media platforms. In fact, the index levels of the two latter types of platforms are almost equally high in France. In Spain, restrictions for search engines are the highest, whilst in Hungary, the highest level of restriction is seen in e-commerce and social media. Overall, there is a wide variation across Europe, despite several measures apply equally to all EU Member States.
Another observation is that many countries in Latin America and Asia have relatively higher levels of restrictions on e-commerce platforms compared to search engines and social media. In some countries, such as in Taiwan, Mexico and Costa Rica, the levels of e-commerce restrictions are actually much higher compared to the other two types of platforms. For Thailand, Taiwan and Korea, their levels of e-commerce platform restrictiveness that are also above the group average. In Brunei, Malaysia and Turkey, instead, the restrictions on social media appear to be stricter than for the other two types of platforms.
The remainder of this section lays out some relationships between the overall DPRI, as well as the three sub-indexes, and various economic variables. The variables chosen are representative of the economic environment of countries in which digital platforms operate. Connecting them to our DPRI can contribute towards identifying other meaningful patterns of online platform restrictiveness across countries.
Figure 3.1: Search, e-commerce and social media platforms restrictiveness index (2018)
Source: ECIPE
3.1 Additional patterns of digital platform restrictiveness
Digital platforms are part of the wider intangible economy, as explained in Haskel and Westlake (2017). The intangible economy invests and builds up relatively more intangible assets, like design, branding, R&D and software, than tangible assets, like machinery, buildings and computers. Platforms favour the production and trade of intangible services and, as a result, support the growth of the intangible economy by contributing in building up intangible assets.
When relating the DPRI with a country’s accumulated stock of intangible assets, a striking pattern appears, as shown in Figure 3.2. Countries that apply higher levels of restrictions on online platforms show lower shares of accumulated intangible investment in the economy (left-hand panel). Unfortunately, data on the stock of intangible investments are only available for a limited number of countries, all of them European. However, the pattern is clear. For example, Italy and Spain both exhibit relatively high levels of restrictions on platforms whilst showing lower shares of intangible capital stock in GDP. Other countries, such as Sweden, the US or UK, show the opposite pattern in which intangible investments are a much more important whilst having a low level of online platform restrictions.
Interestingly, when looking at the per capita intangible capital stock, the pattern between intangible investments and online platform restrictions remains stable (right-hand panel). Certainly, the two panels tell us nothing yet about any causal effects: countries already starting with a low share of intangible stock may indeed also be the ones that apply higher levels of online platform restrictions. However, in Figure 3.2, the data used in the two panels for intangible investments are from 2010, whereas those for platform restrictions are from 2018, which were in both cases the latest years available. This may lead to the conclusion that countries with already low intangible activities have in fact, post-2010, have applied a high level of online platform restrictions.
Figure 3.2: Overall DPRI and the intangible economy
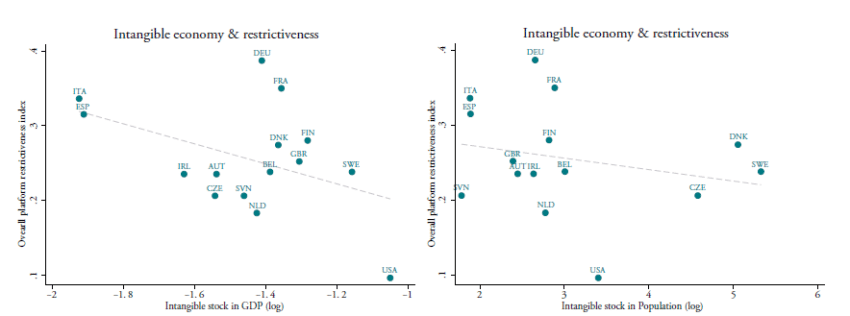
Source: ECIPE and Intan-invest. Note: Data from Intan-invest refers to 2010, the latest year available.
The patterns for e-commerce restrictions also provide us with interesting insights. Generally, not all countries are equally prepared to capitalize on e-commerce activities. Emerging or developing countries are often in an environment in which the general infrastructure for e-commerce is weak. E-commerce services require, for instance, a good Internet coverage, a clear zip-code system or a smooth functioning of the online payments system to execute transactions, which may not always be present in developing countries. Together with other factors, the United Nations Conference on Trade and Development (UNCTAD) looks at these enabling factors to measure a country’s “e-commerce readiness” in its e-commerce index (UNCATD, 2017; 2015).[2]
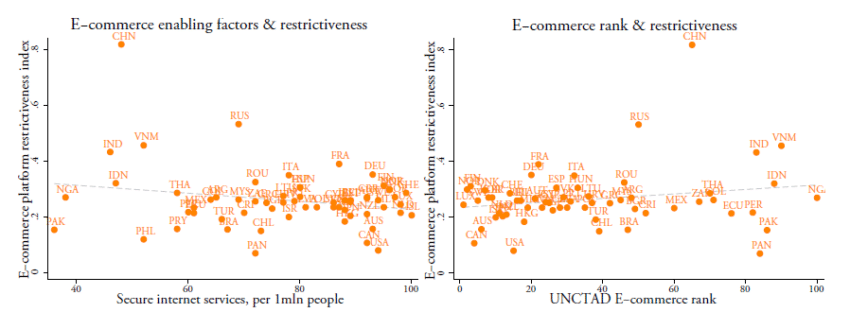
The left-hand panel of Figure 3.3 shows that countries equipped with a better enabling environment regarding, for instance, the provision of secure Internet connections and services (a component of the UNCATD’s e-commerce index), have fewer restrictions on e-commerce platforms. Less restricted countries in e-commerce therefore have a better “readiness” for e-commerce activities than countries with a weaker enabling environment for e-commerce, as shown by the downward sloping line. The right-hand panel of Figure 3.3 supports this pattern. This panel replaces the horizontal axis with the UNCTAD e-commerce country ranking regarding all factors that determine the overall e-commerce environment. A higher rank position means a better e-commerce enabling environment. The panel shows a positive relation, which confirms that countries with lower restrictions on e-commerce also tend to have a better enabling environment for e-commerce activities. It illustrates that, in addressing restrictiveness, e-commerce policies are not a sufficient condition for increasing competitiveness: enabling factors play a complementary role besides lowering restrictions.
Figure 3.3: DPRI sub-index for e-commerce and UNCTAD e-commerce-enabling environment
Source: ECIPE and UNCTAD.
Interestingly, some countries are better prepared for e-commerce activities than others, based on what one would expect when looking at their enabling environment. The right-hand panel shows that some countries, especially China and Russia, and to some extent Vietnam, India and France, have an enabling environment that allows for substantially lowering restrictions on e-commerce platforms. In other words, compared to all other countries, these countries would be expected to have a lower level of e-commerce restrictions. This can be seen by their positions as outliers above the dashed line denoting fitted values. Their position as outliers in both panels of Figure 3.3 indicates that they are far more restrictive than the overall relationship predicts. Indeed, other countries with a similar level of enabling environment for e-commerce are much less restrictive. China and Russia in particular have the scope for lowering their restrictive policies while increasing their competitiveness in e-commerce.
An equally interesting pattern arises with respect to social media platforms. Social media platforms are often put in connection with free speech and freedom of expression. There are many instances where countries apply online censorship or filtering activities to platforms because of non-economic motivations. In fact, examples show that some governments actively police platform members’ speech, which inevitably leads to the issue of legitimate voices being silenced online. Other countries instead let the social media platforms decide how to regulate their content.
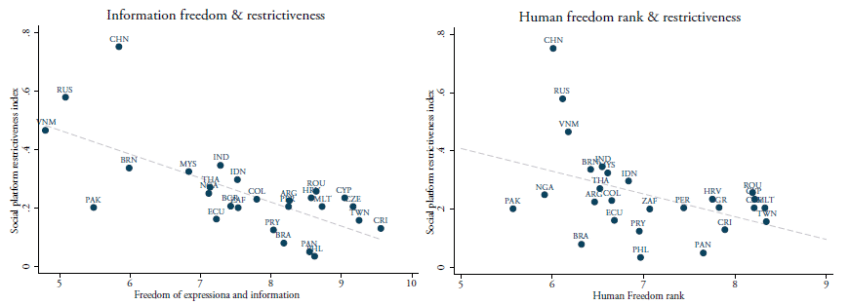
The Fraser Institute measures the extent to which countries allow for free expression and information as part of their Human Freedom Index (Vásquez and Porčnik, 2017). This indicator specifically covers state control over Internet access that forms an increasingly important component in the index, because as the report states: “the use of the Internet spreads and government efforts to control it become more and more sophisticated and frequent”.[3] Several countries have imposed increasing levels of regulations on social media platforms and, in certain cases, blocked some of these platforms for reasons that are usually associated with public order.
Figure 3.4: DPRI sub-index on Social Media and Human Freedom Index
Source: ECIPE and Fraser Institute.
The left-hand panel in Figure 3.4 shows the relation between the DPRI sub-index on social media and Fraser’s indicator of Freedom of expression and information. The panel shows that countries with higher restrictions on social media tend to have less freedom of expression; i.e. among non-OECD countries in Figure 3.4, a lower score on Fraser’s Freedom of expression indicator is associated with higher levels of social platform restrictiveness.[4] Countries such as Russia, China and Vietnam, in particular, show high restrictions for social media platforms, as well as some of the worst climate for freedom of expression and information. On the other hand, countries such as Taiwan, Costa Rica or the Czech Republic score high on the freedom of expression whilst having lower levels of restrictions on social media platforms.
[1] The other types of platforms defined in Siwek (2017) are travel, web portal, cloud computing and online services. Note, however, that most of the restrictions covered by the DPRI also apply to these platforms, but not always. For instance, the index does not list measures that directly affect certain travel platforms or other online services such as news portals.
[2] Generally, a good enabling environment provides a substitute for restrictive regulations as competition allows for a good operation of the market, provided a country has strong infrastructure governance in place.
[3] Fraser’s indicator also covers for human freedom of personal expression, the press and use of the Internet, such as journalists killed or jailed in a country, the political pressure over news and editorial content and the generally measured “vibrancy” of the media, and access to foreign media, as well as violence used against journalists, in addition to the state control over Internet access as explained above.
[4] Figure 3.4 only selects non-OECD countries as freedom of expression concerns are greater in these countries, and because OECD countries generally have a very high score on this index with little variation.
4. Digital platform restrictions and their impact on the economy
Previous research looking at the economic benefits of platforms finds that the economic impact of platforms can be substantial. Most of these works have a focus on e-commerce platforms. For instance, Falk and Hagsten (2017) investigate the impact of e-commerce activities on labour productivity growth and find that they are positively related. Moreover, they also find that services as well as smaller firms both experience a larger impact from using e-commerce facilities (or e-sales) than industries. Cardona et al. (2015) indirectly assess how reduced trade costs in e-commerce have an impact on the economy using a computable general equilibrium (CGE) model. These authors also look at the implied cost of perceived regulatory barriers in e-commerce but do not assess countries’ policies themselves as we do in Section 2. They nonetheless find that e-commerce across borders reduces trade costs compared to trading the same goods offline.
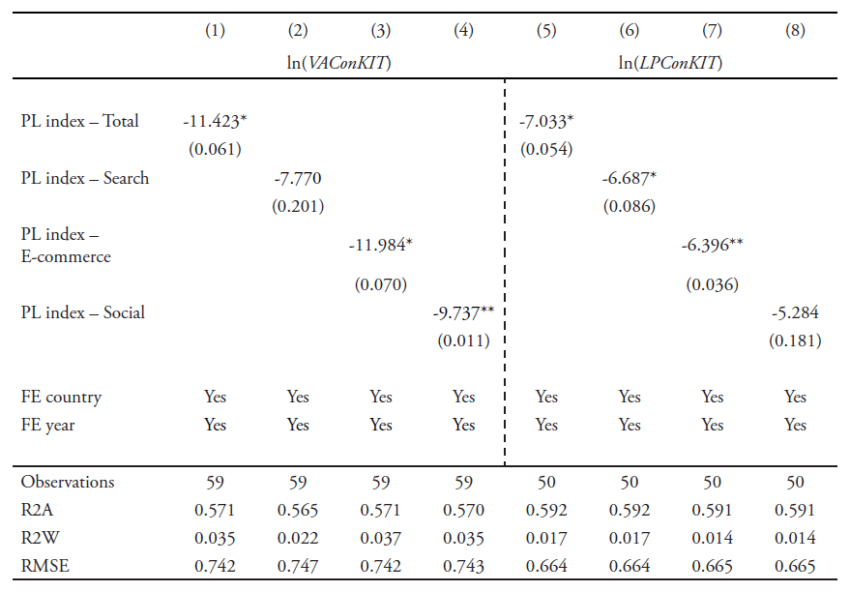
We find that trade restrictions on online platforms are negatively associated with the contribution of ICT capital services to value added (VAConKIT) and productivity growth (LPConKIT) in countries. Although the results are based on cross-section regressions as correlations, and therefore one cannot make any causal inferences, they nonetheless provide interesting insights.
We perform this analysis by starting from the methodology developed by Ferracane et al. (2018b; 2018c), but this time specifically adjusted for online platforms. According to this methodology, each of the three sub-indexes presented above is “weighted” by an indicator that measures platform intensity for search, ecommerce and social media, i.e. how much each sector in the economy uses platforms. In this way, we aim to have a more valid way of measuring the impact of the restrictions on each of these types of platforms in various downstream sectors in the economy.[1] We assume that sectors that use platforms more intensively are also those more affected by higher levels of restrictiveness on online platforms. Annex 2 provides a full explanation of this methodology, including the regression estimations and further descriptions of the data used. Overall, this weighted approach is called the Platform Linkage (PL) in our analysis in Tables 4.1 and 4.2.
Table 4.1 shows the results of the regressions following equations (1) and (2) in Annex 2.[2] The overall PL index in which we use the overall DPRI, which is weighted by an overall measure of platform intensity, shows a negative and significant coefficient result. This result indicates that countries with higher levels of online platform restrictiveness exhibit lower levels of contributions of ICT capital services to value added growth (column 1) in the economy – although the coefficient result is statistically weak. When breaking down this overall index into the three different sub-indexes of search engines, e-commerce and social media platforms, the results show that the significant and negative outcome also holds for restrictions on e-commerce platforms as well as social media platforms (columns 3-4). In the latter case, the outcome is now significant at the 5 per cent level, which is therefore stronger than for the overall platform restrictiveness. The results obtained for search engines are not significant.
In Table 4.1, columns 5-8 repeat the regressions results but this time the platform indexes are regressed on the contributions of ICT capital services to productivity growth, i.e. on value added per hour worked, instead of the sheer value added growth. The difference is that the value added growth as such does not yet account for how efficiently value added is created in an economy. The results in the right-hand half of Table 4.1 show that online platform restrictions are as a whole also negatively associated with lower levels of productivity growth, resulting from contributions by ICT services. Again, results bear little significance to the overall platform restrictiveness index. Negative and significant results are now also found for search engines in addition to e-commerce platforms, which have a somewhat greater statistical significance. In contrast, platform restrictions on social media platforms provide no significant result, contrary to the results found in column 4.
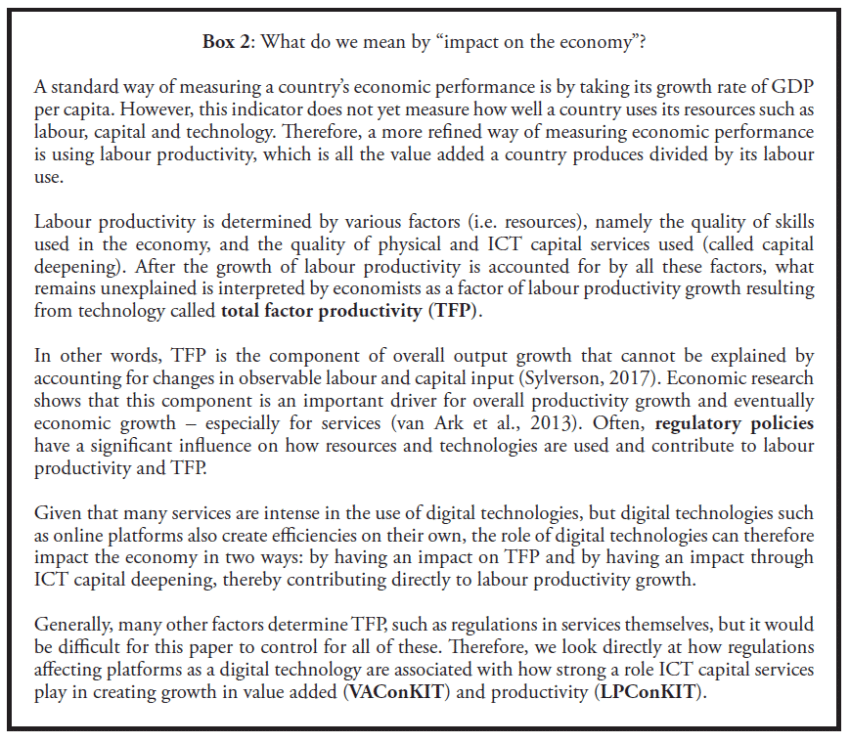
These outcomes appear to indicate that higher levels of restrictions on online platforms are associated with a limited impact of the role that ICT technologies can play in the economy. Put differently, where countries apply high restrictions on online platforms, ICT services and related technologies are likely to contribute less to value added and productivity growth in the wider economy than countries with low restrictions on online platforms. As such, restricting online platforms slows down the diffusion of ICT services and other Internet technologies in the overall non-digital (as well as digital) economy, which Van Ark (2018) described as a strong determinant for overall value added and productivity growth in countries (see also Box 2.)
As a robustness check, we repeat these regressions with sectoral intensities of Internet technologies following the ones developed by Ferracane et al. (2018b; 2018c).[3] All columns in Table 4.2 replace the entries as presented in Table 4.1. The results in columns 1-4 substantiate the previous findings: all coefficient outcomes are negative and significant, including for search platforms. The results confirm that greater levels of restrictiveness on online platforms are associated with lower levels of ICT capital services playing a role as a contributor to value added growth across sectors in the countries analysed. When accounting for ICT contributions to overall productivity growth, however, the results are not significant (columns 5-8), albeit negative. Taken together, the two tables show a consistent pattern of the relationship between restrictions on online platforms and a country’s overall performance of ICT in sectors as a contributor to value added and productivity growth.[4]
Table 4.1: Regression results of platform regulations on economic performance
Source: ECIPE, WORLDKLEMS & Eurostat. Note: * p<0.10; ** p<0.05; *** p<0.01. Robust standard errors clustered at the sector level. See Annex Table A3 for sector classification. The variables VAConKIT and LPConKIT stand for the contribution of ICT capital services to value added growth and the contribution of ICT capital services to value added per hour worked. Both variables are in logs (ln). FE denotes fixed effects.
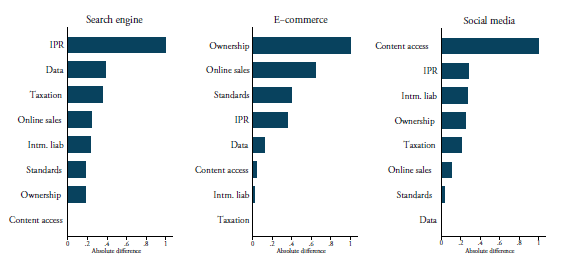
For the purpose of this paper, as explained in Annex 3, we computed the extent to which a certain category of online platform restrictions is in large part likely to be responsible for the overall variation in level of restrictiveness of a type of platform, and therefore may drive most of the significant results found in Table 4.1 and Table 4.2. Our calculations reveal that, for search engines, the restrictions related to IPR and data tend to be the largest factors in explaining the significant outcome. These two categories of restrictive measures on IPR and data have the highest variation in terms of levels of restrictiveness found across countries and are therefore likely to drive the significant results. Similarly, restrictions on ownership and online sales are likely to affect the significant result found for e-commerce platforms, while restrictions on content access are likely to drive the significant results found for social media platforms, as shown in Figure A6 of Annex 3.
Table 4.2: Regression results of platform regulations on economic performance (cont’d)
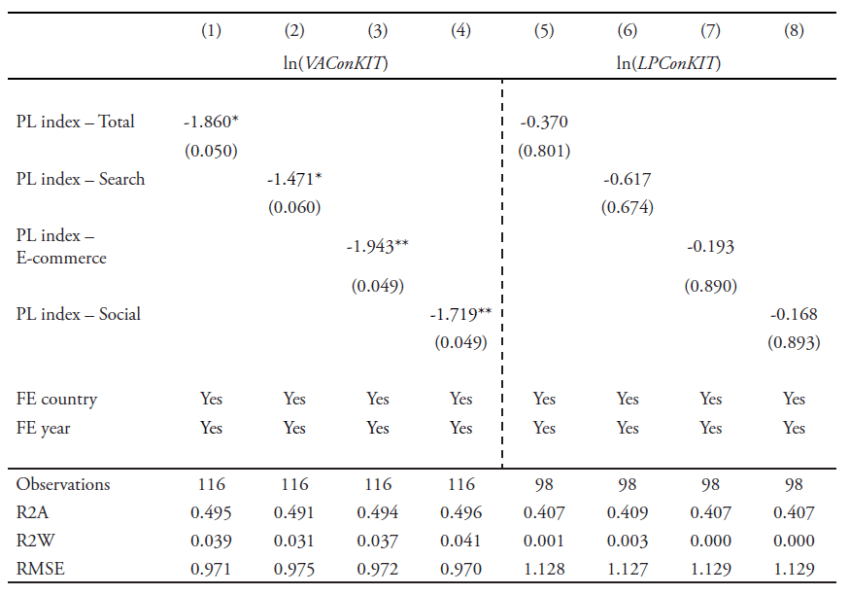
Source: ECIPE, WORLDKLEMS & BEA. Note: * p<0.10; ** p<0.05; *** p<0.01. Robust standard errors clustered at the sector level. See Annex Table A3 for sector classification. The variables VAConKIT and LPConKIT stand for the contribution of ICT capital services to value added growth and the contribution of ICT capital services to value added per person employed. Both variables are in logs (ln). FE denotes fixed effects.
Moreover, further analysis based on the results in Table 4.1 and Table 4.2 shows that if countries reduce their level of online platform restrictiveness, there would be a substantial increase in value added stemming from ICT. In particular, if countries lowered their restrictions on platforms to a level similar to Canada, the US and the Netherlands, which are the countries closest to the regulatory frontier, on average they would experience a boost in the contribution of ICT capital services to value added growth of around 20.41 per cent across all market services (excluding health and education). This would mean that the contribution of ICT capital to value added growth for market services in the EU-12 countries of 0.2, as found in van Ark and Jäger (2017), would potentially increase to approximately 0.24 percentage points, as shown in Figure 4.1. This increase may seem small, but this potential outcome scenario would be such that the contributing level that ICT capital has on the economy would be one step closer to the level it had before the global financial crisis (2002-2007) when it stood at 0.4. Moreover, this estimate must be seen as a lower boundary for the reasons explained above, and because it excludes dynamic effects resulting from the use of platforms.
Figure 4.1: Percentage point change in market services resulting from removing platform restrictions
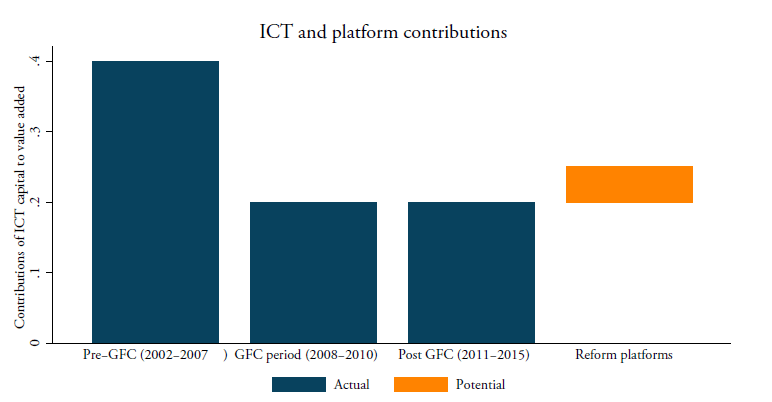
Source: ECIPE, WORLDKLEMS & BEA; authors’ calculations. Note: results are based on regression outcomes as presented in Table 4.2 using marginal effects. The numbers for the three different periods for which ICT capital services contributed to value added are from van Ark and Jäger (2017).
However, large differences arise across sectors when it comes to the impact of platform regulations, as shown in Figure 4.2. The services that would gain the most from eliminating certain restrictions are IT and information services, as well as the publishing sector. This is an unsurprising result considering that several online platforms are listed in this sector. Sectors such as distribution, business services and financial services would also profit substantially from a reduction in the restrictions on online platforms. Utilities, which include gas, water and electricity, also appear to benefit from a reduction in online platform restrictions. These are the services that use platforms more intensively. Other sectors, such as construction transport and storage, are less affected by reductions in trade restrictions for online platforms as they use fewer platforms and digital services.
Figure 4.2: Percentage point change as a result of removing platform restrictions, by sector
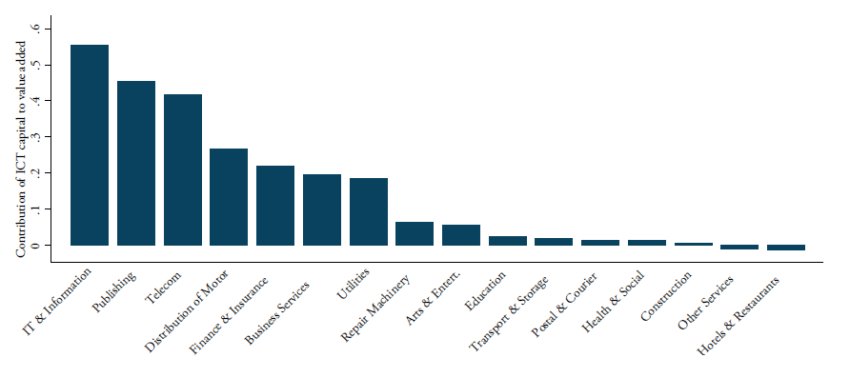
Source: ECIPE, WORLDKLEMS & BEA; authors’ calculations. Note: results are based on regression outcomes as presented in Table 4.1 using marginal effects for each sector.
The fact that the outcomes show that some digital services appear to profit more from lowering restrictions related to digital platforms merits further discussion. In large part, as said, this result is because much of the platform activities are valuable inputs for the services sector (Figure A4 and Figure A5 in the Annex). Similarly, the relatively high outcomes for distribution, finance and other business services are also most likely driven by changes in restrictions of all three types of platforms in combination with their large use of digital services. All these sectors are known for their large amount of information processing.
[1] See Annex Figure A4 for a ranking of the three online platform intensities by sector. The intensities are constructed using the Eurostat enterprise survey found in the Digital Economy and Society Database. Annex 2 provides a full explanation of how we compute each of the three intensities.
[2] Note that the results only take account of digital trade barriers to online platforms. The non-digital barriers that can also affect platform are outside the scope of this paper (see also Box 1).
[3] These Internet intensities are more broadly defined and not specifically target platform intensities of each sector. See Annex Figure A5 for a ranking of the intensities by sector.
[4] Note that although in Table 4.1 columns 5-8 show a positive coefficient sign, replacing LP1ConKit with LP2ConKit, which represents the contribution of ICT capital services to value added per person employed, gives a negative coefficient sign, albeit also insignificant.
5. Conclusion
This paper presents the Digital Platform Restrictiveness Index (DPRI) for 64 economies. The results show that the group of countries that impose strict regulations on online platforms are comprised of a mix of developed and emerging economies. We also created three sub-indexes for three major categories of platforms: search engines, e-commerce platforms and social media.
The fact that countries with very different income levels are among the ones that are most restricted in online platforms shows that a country’s level of development is a poor predictor for explaining the restrictiveness of countries regarding online platforms. Instead, when relating our index and sub-indexes to various other economic outcome indicators, striking results appear. For instance, online platform restrictiveness is negatively associated with (1) a country’s economic activities in the intangible economy, (2) a country’s readiness to participate in e-commerce activities, and (3) a country’s level of freedom of speech. Furthermore, this paper shows that countries with high restrictions on online platforms tend to show a lower performance from the ICT sector as a contributor to the overall productivity growth, particularly in services.
This means that online platforms can in fact act as a real contributor to the overall productivity and eventually the economic growth of a country, especially through the services sector. Interestingly, services are often thought of as lagging behind in terms of productivity growth, which ultimately weighs down on the rest of the economy (Baumol, 1967). In addition, because services are generally perceived as less receptive to technological changes that would substitute inefficient labour, these sectors are usually perceived as doomed to be at the tail end of contributing to overall productivity performance and eventually economic growth. However, that notion seems increasingly out of date as more research shows that the introduction of ICT can to a large extent “cure” this costs disease in personal services (see Triplett and Bosworth, 2003).
This paper indicates that regulatory policies impacting the ICT sector and digital platforms could affect how services can contribute to increasing productivity in the overall economy. Lowering restrictions on online platforms could benefit a wide range of services, from hotels and restaurants to financial services and distribution. In an age when network economies are increasingly more important to support productivity, strict regimes on online platform are likely to reduce the opportunities that should be derived from countries implementing ICT solutions. However, more empirical research is still needed to investigate this relationship as online platforms are also often associated with disruptions in the economy. Further research is also needed to assess how platforms impact more generally on small enterprises and the job market.
References
Baumol, W.J. (1967), “Macroeconomics of Unbalanced Growth: The Anatomy of Urban Crises”. American Economic Review, Vol. 57, No. 3, pages 415-426.
Cardona, M, N. Duch-Brown, J. Francois, B. Martens and F. Yang (2015), “The Macro-economic Impact of E-commerce in the EU Digital Single Market”, Institute for Prospective Technological Studies Working Paper 2015/09, JRC Technical Reports, European Commission Joint Research Centre.
Falk, M. and E. Hagsten (2015), “E-commerce Trends and Impacts Across Europe”, International Journal of Production Economics, Vol. 170, Issue Part A, pages 357-369.
Ferracane, M.F. (2017), “Restrictions on Cross-Border Data Flows: A Taxonomy”, ECIPE Working Paper No. 1/2018, European Centre for International Political Economy, Brussels: ECIPE.
Ferracane, M.F., H. Lee-Makiyama and E. van der Marel (2018a), “Digital Trade Restrictiveness Index”, European Centre for International Political Economy, Brussels: ECIPE.
Ferracane, M.F., J. Kren and E. van der Marel (2018b), “Do Data Policy Restrictions Impact the Productivity Performance of Firms and Industries?”, ECIPE DTE Working Paper Series No. 1, Brussels: ECIPE.
Ferracane, M.F. and E. van der Marel (2018c), “Do Data Flows Restrictions Inhibit Trade in Services?”, ECIPE DTE Working Paper Series No. 2, Brussels: ECIPE.
Haskel, J. and S. Westlake (2017), “Capitalism without Capital: The Rise of the Intangible Economy”, Princeton University Press.
Vásquez, I. and T. Porčnik (2017), “Human Freedom Index: A Global Measurement of Personal, Civil and Economic Freedom”, Vancouver: Fraser Institute.
Rochet, J.C. and J. Tirole (2004), “Two-sided Markets: An Overview”, MIT Publication: http://web.mit.edu/14.271/www/rochet_tirole.pdf
Siwek, S.E. (2017), “Measuring the US Internet Sector”, Internet Association, Washington DC: IA.
Triplett. J.E. and B.P. Bosworth (2003), “Productivity Measurement Issues in Services Industries: Baumol’s Disease Has Been Cured”, Economic Policy Review, Vol. 9, No. 3, pages 23-33.
UNCTAD (2015), “Information Economy Report 2015: Unlocking the Potential of E-commerce for Developing Countries”, Geneva: UNCTAD.
UNCATD (2017), “UNCTAD B2C E‐commerce Index 2017”, Technical Note No. 9, Geneva: UNCTAD.
van Ark, B. (2018), “The Productivity Paradox of the New Digital Economy”, International Productivity Monitor, Centre for the Study of Living Standards, Vol. 31, pages 3-18.
van Ark, B. and K. Jäger (2017), “Recent Trends in Europe’s Output and Productivity Growth Performance at the Sector Level, 2002-2015”, International Productivity Monitor, Number 33, Fall 2017.
Annex 1: Additional tables and figures
Table A1: Restrictions covering platform restrictiveness index and weights
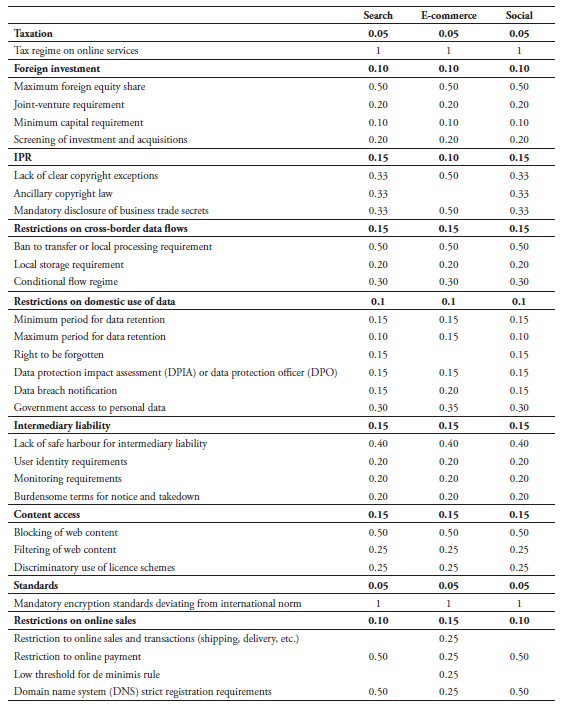
Figure A1: DPRI sub-index for search engines (2018)
Source: ECIPE
Figure A2: DPRI sub-index for e-commerce platforms (2018)
Source: ECIPE
Figure A3: DPRI sub-index for social media platforms (2018)
Source: ECIPE
Annex 2: Methodology for regressions as correlations
Estimation strategy and data
To date no work has specifically assessed how the regulatory trade restrictions applied to digital platforms have an impact on the economy. With the help of our digital platform restrictiveness index (DPRI) for a wide set of countries, we are able to estimate in a credible way the extent to which these restrictions across countries are associated with a lower economic performance from sectors using these platforms intensively. As such, with this index we are the first to estimate the economic impact of platform restrictions in a sophisticated way. In order to do so, we use the same methodology as developed in Ferracane et al. (2018b), in which economic performance is measured by productivity (Prod) namely:

In equation (1), productivity is proxied by labour productivity (LP) in addition to Total Factor Productivity (TFP) and computed using industry-level information from EUKLEMS database and put in logs. The PL term refers to the Platform Linkage (PL) index in which the platform restrictiveness index as presented in Figure 2.1 is multiplied with a proxy that measures how much each sector uses platform services, following the ranking provided in Annex Figure A4. We do this because not all sectors are equal in their use of digital platforms. Ultimately, platform restrictions will have a greater knock-on effect on sectors that use platforms more intensively, which justifies our “weighted” index approach as pioneered by Arnold et al. (2015; 2011), and applied by Ferracane et al. (2018b; 2018c) and various other papers assessing the impact on regulatory barriers on productivity and trade. Hence, this PL term is defined as:

in which each of the country-specific index of platform restrictiveness is multiplied with a measure of platform services’ intensity for country c for each downstream services sector j that uses platforms services d. This proxy for platform services’ usage is denoted by φjd. Information on platform services’ usage comes from the Eurostat Comprehensive Database on Digital Economy and Society. There are two databases that record the usage of digital services, namely one for households and one for enterprises. We take the latter one and use numbers for the year 2017 for the whole EU-27 economy as a whole.[1]
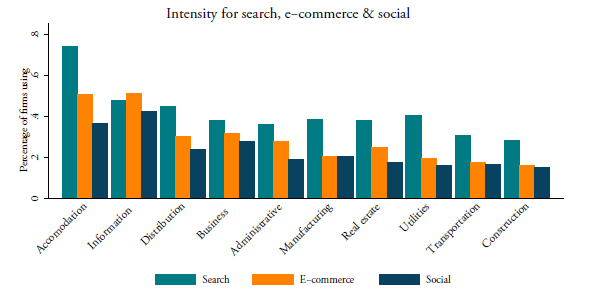
The Eurostat database records survey questions to firms on the usage of information and communication technologies, including platforms. The database is immensely big and is provided in MS-Access format with many variables recorded, but also provides pre-defined templates of a cluster of survey questions (i.e. variables) that are related to a specific part of the digital economy. Conveniently, for our three types of platforms there are three sets of clusters with specific survey questions on the usage of each of the three platforms by enterprises. See Annex Table A4 for the specific survey questions and associated variable codes sorted by online platforms. We only select variables that are recorded by sector (ISIC Rev. 2 industry and services) and provide information on the percentage of firms using platform technologies as given in Table A4. We compute the simple average by sector for each of the clusters then compute the intensity of the three types of platforms. We also compute an overall average of the three platforms that proxies for the overall platform usage.
Figure A4 in the Annex provides an overview of the three platform intensities based on the data from the Eurostat survey questions. Generally, enterprises in various service sectors show a much higher level of online platform usage compared to enterprises in the manufacturing sector. This is specifically true for accommodation, information services, distribution and business services. Overall, across all sectors, search platforms are most commonly used, followed by e-commerce platforms, except for Information services where e-commerce platforms are mostly used by firms.
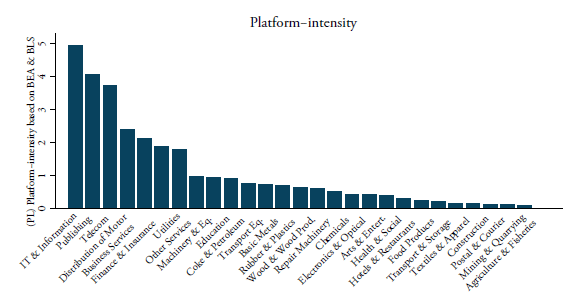
We also use alternative intensities as developed by Ferracane et al. (2018b; 2018c), which is the Internet services’ usage over labour and is defined in equation (2). These intensities are based on a number of ICT producing sectors that provide their inputs into each downstream industry, i.e. φjd , which is computed using the US BEA Input Output Use Tables for the year 2012 for each NAICS 6-digit level. To determine the ICT-producing service sectors we rely on Bauer et al. (2016), which is in line with Jorgenson et al. (2011) regarding their IT-producing industries. Table A6 lists the sectors that we define as ICT producers. They include, inter alia, the telecommunications sector; data processing, hosting and related services; Internet service providers and web search portals; software publishers; computer system design services; and other computer-related services.
We then calculate the ratio between this input value of ICT services’ usage over labour employed for each downstream services sector at the 6-digit level. Labour is sourced from the US BLS and given in the NAICS (North American Industry Classification System) for the same year then matched with the US BEA input-output matrix, which fits neatly. All intensities are re-concorded into ISIC Rev 2 at 2-digit level using our self-developed concordance table.[2] As shown in Annex Figure A5, telecom services, intellectual property, computer and financial services are again the most data-intense service sectors. In the regressions below, we apply the log of this intensity when performing our estimations.
The expected results are that countries with greater levels of online platform restrictions are also the ones in which sectors that rely heavily on platforms experience lower levels of ICT contributions to value-added and productivity. Conversely, countries with lower levels of restrictions on platforms are expected to show higher productivity developments in sectors that are more platform-driven. In both cases, the PL linkage index would show a negative sign in equation (1). In addition, in equation (1) the terms and refer to the fixed effects by country and sector respectively, which takes care of all other factors that may influence productivity within a country and sector and which are unobservable. Sector fixed effects are applied at 1-digit or 2-digit ISIC Rev. 2 level following the classifications as given in Annex Tables A3 and A4 respectively.[3]
Of note, although we consider both the industrial and services sectors, we expect the impact to be mainly visible in services. The reason being that most of the intangibles, and software services in particular, in which platforms play an important role, are spent on the services sector. For instance, across European countries, only about 17 per cent of total software expenditure is dedicated to the manufacturing sector. Hence, the share of software expenditures in service sectors is much higher, something that was also pointed out in Ferracane et al. (2018c). Software expenditures in Europe are particularly high in the business services sector (including transport and entertainment) where European countries spend a share of about 46 per cent. In addition, platforms are used across many new intangible investments that firms undertake, such as R&D and advertisement and training. Even when taking all these expenditures into account, most of it is spent in services.
Table A3: Sector classification using Eurostat intensities
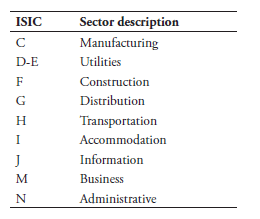
Table A4: Sector classification using BEA intensities
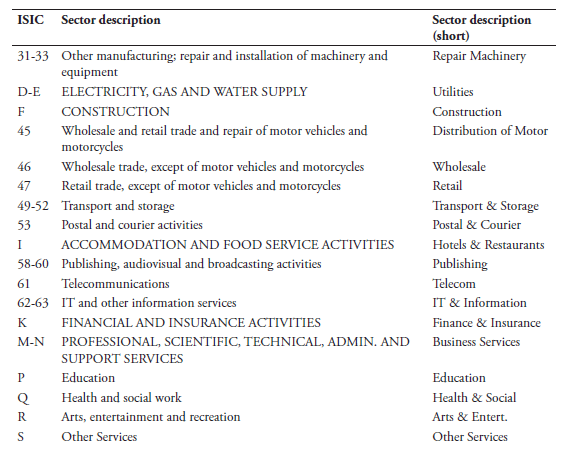
Table A5: Eurostat clusters of survey questions for each type of platforms
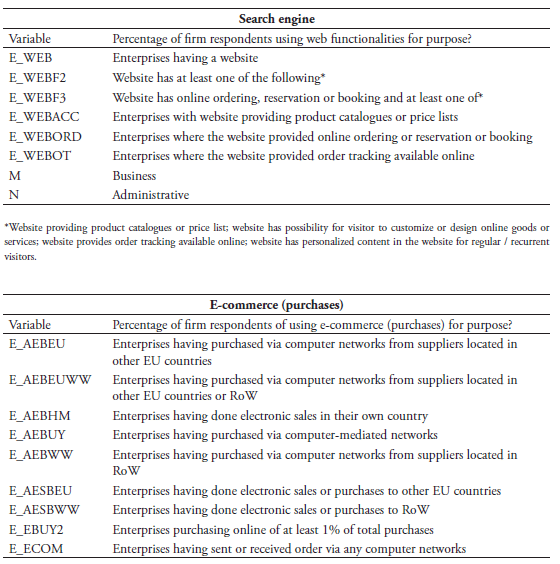
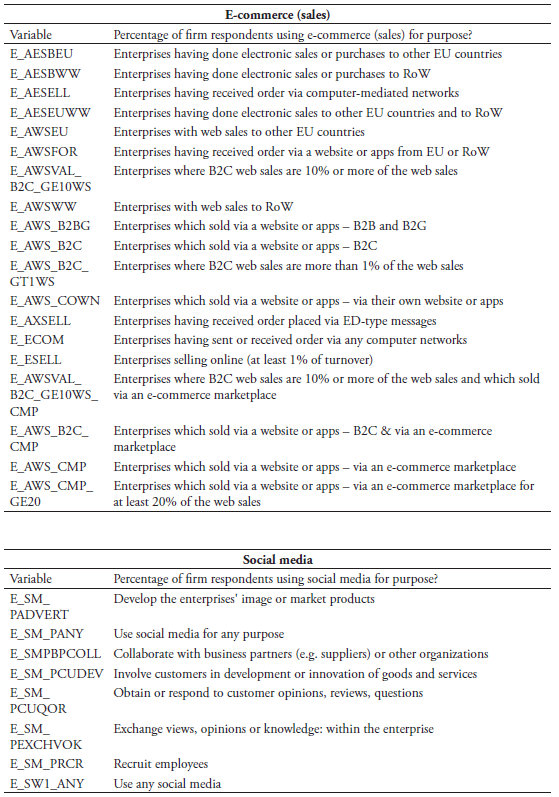
Table A6: NAICS 6-digit sectors as Internet producers
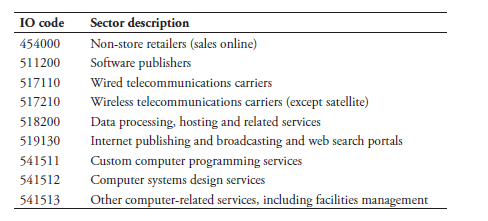
Source: BEA 2012 IO Use Table. IO codes follow NAICS 6-digit codes.
Figure A4: Platform intensities based on Eurostat database (percentage of firms using platforms)
Source: Eurostat
Figure A5: Platform intensities based on BEA Input-Output Use Table and US BLS database
Source: US BEA and US BLS
[1] Although more countries are covered by the online platform restrictiveness index, the scope of countries in the regressions will be substantially reduced due to the lack of information on economic performance variables for many countries. Since we are using the WORLDKLEMS for computing economic performance, this should not be a problem. Moreover, alternative intensities such as the one in Ferracane et al. (2018b; 2018c) also use data on intensities from one country, namely the US (see footnote below).
[2] An additional convenient motivation for using US tables is that the US is often used as a benchmark country in similar cross-country studies using sector intensities, which makes our input coefficients on data usage exogenous. This argument is similar in the case of taking EU-wide intensities as outlined in equation (2). However, there is a debate in the economic literature about whether one should use the assumption of equal industry (or sector) technologies across countries or not. Equal technology coefficients seem reasonable if one assumes that the countries selected in the sample are reasonably similar in their economic structures and technology endowments.
[3] For the sake of brevity only a succinct explanation of the estimation strategy is provided. For more information on the methodology, identification strategy and estimation strategy and results, see Ferracane et al. (2018a).
Annex 3: Policy variations in platform restrictions
The regression analysis in Table 4.1 and Table 4.2 shows the outcome using the overall DPRI, which takes the three types of platforms together. However, this overall platform restrictiveness index is built up from different categories of policy restrictions as outlined in Box 1, namely taxation, IPR restriction, data restrictions, intermediate liability, standards, online sales and transaction restrictions, content access, and investment restrictions in platforms. One could potentially think of using each category separately in an interaction term as defined in equation (2) as part of the Platform Linkage (PL), but this would provide too little variation for a credible result in the regression analysis. Many countries for instance do not have, or have a few, policy restrictions in some areas and therefore have a zero recorded. If used in the regression, all we would pick up are the intensity measures.
An alternative approach is to analyse the level of absolute variation of standard deviations of the categories of policy restrictions across all countries in our analysis. Doing so requires only data on policy restrictions and no data on any intensities. We compute this variation of policy restriction as the standard deviation of each category of policy restrictions as described above for each type of platform (i.e. search engines, e-commerce and social media). The greater the standard deviation within a category of policy restriction, the more countries differ in their level of restriction. However, to arrive at a neutral measure that accounts for the policy variation for each type of platform, we also compute the standard deviation of the overall DPRI and simply subtract the standard deviation of search engines, e-commerce and social media from the standard deviation of the DPRI for each category. Simply put:

where c refers to the one of the three platforms’ restrictiveness indexes for search engines, e-commerce and social media and overall refers to the overall DPRI, i refers to the category of platform restrictiveness, and refers to the standard deviation. Put another way, equation (A1) measures the variation of the categories of restrictions for search engines, e-commerce and social media platforms compared to the overall platform restrictiveness index. If a category of platform restrictions, say data restrictions, for search engines is more restrictive compared to the category of data restrictions applied in the overall index of platform restrictions, this measure provides a crude way of explaining the most important variation of applied restrictions across different countries that have implemented different levels of data restrictions for search engines platforms compared to other categories of restrictions.
The outcomes of this exercise for each of the three types of platforms are presented in Figure A6. The first panel of the figure shows that for search engines platforms specifically, restrictions related to IPR and data restrictions (plus restrictions related to taxation) explain most of the variation in restrictions and may therefore drive the significant correlation results found in this paper. In other words, data restrictions for search engines platforms vary more across countries compared to what’s observed generally for all types of platforms. In a similar manner, for e-commerce platforms, variations are greatest for investment restrictions and restrictions related to online sales. Lastly, for social media platforms, content access restrictions show the greatest policy variation from the overall index. Since this indicator measures the level of variability across countries, it seems likely therefore that the significant outcomes in Table 4.1 and Table 4.2 are driven by these measures.
Figure A6: Level of policy variation in platform restrictions, by category
Source: Authors’ calculations