Keeping Up with the US: Why Europe’s Productivity Is Falling Behind
Published By: Fredrik Erixon Oscar Guinea Oscar du Roy
Subjects: European Union North-America
Summary
The European Union stands at a crossroads. For decades, the EU’s productivity growth has consistently lagged the United States, leading to slower growth in living standards and decline in global economic power. While short-term factors like the strong US fiscal expansion have widened the gap in nominal GDP growth in recent years, the fact is that Europe has trailed the US economic development for several decades and the root of the problem lies in deeper structural issues within the European economy.
Four major forces fuel this productivity divide. Firstly, the EU’s investment in research and development (R&D) pales in comparison to the U.S., leading to fewer patents and a slower pace of technology-fuelled innovation. Secondly, Europe trails America in the stock and growth of intangible capital investments, which are crucial for adopting and diffusing new technologies that drive productivity. Thirdly, the EU market exhibits slower business creation and destruction compared to the US. This rigidity hinders the flow of resources towards the most productive firms. Lastly, despite boasting higher levels of trade openness, the EU attracts less Foreign Direct Investment (FDI) than the US, curbing its access to cutting-edge global technologies and expertise.
To close the gap, European policymakers should implement a comprehensive strategy for faster productivity growth. The first step is turning up the dial on R&D spending, targeting 4-5 percent of GDP by 2040. Next, Europe should prioritise investments in intangible assets and lay down the digital infrastructure that will underpin future growth. Revitalising the single market is also crucial: reducing internal and external market barriers for services, the primary vehicle for trading intangible assets. Moreover, the EU should foster a market environment that encourages entrepreneurship and facilitate the entry and exit of firms so resources cascade towards the most productive sectors.
By harnessing the strengths of the single market and implementing these recommendations, European policymakers can propel the EU towards a more competitive and prosperous future.
1. Introduction
Europe is yet again confronted with concerns over its economic performance. EU economic growth in the past years have been poor – weighed down by the pandemic and Russia’s war on Ukraine – and significantly trailed the expansion in the US economy. While different factors make growth comparisons for individual years less meaningful, the reality is that real economic growth in the EU has been low for a long time and that GDP per capita in especially Western and Southern Europe has been climbing disappointingly slowly – in some cases not at all.
Two former Italian premiers, Enrico Letta and Mario Draghi, have been separately tasked to come up with recommendations for economic reforms and improved competitiveness – leading to faster economic growth. The Letta report, published in mid-April 2024, identified a lack of integration within the EU’s single market as a key obstacle to European growth. A report on the EU’s competitiveness by Draghi is expected during the summer of 2024.
Competitiveness can be a fuzzy term, especially when it comes packaged together with calls for a lot of new industrial policy support. The French President, Emmanuel Macron, has recently called for giant increases in EU subsidies and warned that the continent is about to collapse economically. Enrico Letta has also urged an increase in EU industrial policy spending, and Mario Draghi is expected to repeat the message in his report. Yet EU governments are already spending record levels of state aid to companies and there is little evidence presented suggesting that additional resources would make the EU grow faster. In fact, the result may be the opposite. The IMF has estimated that a European version of the US Inflation Reduction Act would reduce EU GDP by 0.6 percent.[1]
At the heart of Europe’s economic challenge is productivity – and its need to raise the rates of productivity growth. Europe’s economic challenge is not about working longer hours or taking shorter holidays but improving the amount of value-added generated by the inputs to the economy. Arguably, enhancing competitiveness essentially means boosting economic productivity: higher productivity means that business can draw on more efficient production and better compete globally. Therefore, any discussion on charting a corrective course on EU’s declining competitiveness requires a focus on productivity.
Europe’s productivity performance can be better understood by comparing its productivity growth over time. Yet, the selection of the starting and ending points for such a comparison can produce widely different results. Additionally, benchmarking against a country with a similar size, economic development level, and institutional framework can provide valuable insights.
Crucially, a long-term perspective is necessary for both types of comparisons. While policymakers frequently compare productivity growth (or similar metrics like GDP per capita) between countries in a single year, the long-term trend is what truly matters. An economy that sustains 3 percent annual growth will double in size within 24 years, whereas an economy growing at 1 percent per year will take 48 years to achieve the same results. This is how relative prosperity develops over time. Countries do not get richer or poorer than others in an instant: it happens over time.
This point is particularly relevant when analysing the relative economic performance of the EU and the US. In recent years, the US’s economic performance has enjoyed a boost from significant fiscal stimulus, lower energy prices, and a strengthened US dollar. However, a long-term analysis reveals that, while these factors have recently exacerbated the divergence in EU-US growth rates, the widening prosperity gap between the two regions reflects a longer-term trend.
There are some bright spots in EU’s economic performance. Central and Eastern European (CEE) countries have consistently exhibited higher productivity growth rates compared to Western and Southern EU countries. However, the economic weight of the latter regions hinders the EU’s overall performance. As a result, the prosperity gap between the EU and the US has expanded. If the EU was a state in the US, it would be third poorest state – trailed only by Idaho and Mississippi.
This Policy Brief begins by examining the productivity gap between the EU and the US. The analysis includes the levels and growth rates of labour productivity and Total Factor Productivity (TFP) in each region. The subsequent chapter delves into the reasons behind this divergence by exploring EU and US performance in four key drivers of long-term productivity growth: the innovation process; the diffusion of intangible capital; market dynamism; and market openness to international trade and foreign direct investment. Finally, the concluding chapter urges European policymakers to take decisive actions to reverse the EU’s productivity decline. Based on our analysis, the chapter outlines a number of policy recommendations that would contribute to achieving this objective.
[1] IMF. (2024). Regional economic outlook: Europe. International Monetary Fund. https://www.imf.org/en/Publications/REO/EU/Issues/2024/04/05/regional-economic-outlook-europe-april-2024
2. Europe’s Lagging Productivity Performance
Productivity is the key driver of long-run economic growth and prosperity. It relates the volume of output produced to the inputs used in the economy. For example, labour productivity, a key metric of productivity, reflects the amount of output generated per worker or hour worked. Figure 1 presents the level of labour productivity, measured as GDP per hour worked after adjusting for inflation and differences in living standards in the EU and the US. In 1990, labour productivity in both regions was very similar, with each worker’s annual output averaging close to US$ 53 per hour. However, a gap has since emerged and widened over time, with US labour productivity now nearly US$ 15 higher than the EU.
Figure 1: EU and US GDP per hour worked (2022 international dollars, PPP)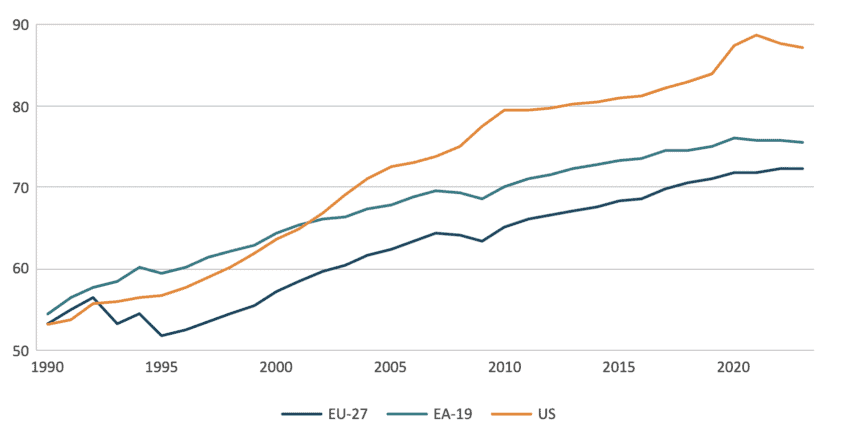 Source: The Conference Board, Total Economy Database. Note: EA-19 countries include: Belgium, Germany, Ireland, Spain, France, Italy, Luxembourg, the Netherlands, Austria, Portugal, Finland, Greece, Slovenia, Cyprus, Malta, Slovakia, Estonia, Latvia and Lithuania.
To fully understand this widening gap, the analysis should go beyond a comparison of levels to assess the changes in the growth rates of labour productivity. Figure 2 shows the declining rates of labour productivity growth in 12 Euro area countries (EA-12) [1] and the US. Labour productivity growth has been on average 1.27 percentage points lower in the EA-12 than in the US, which explains the flattening of European productivity levels shown in Figure 1.
Labour productivity growth can be decomposed into three components: capital deepening, labour composition, and TFP. Capital deepening, which measures the contribution of tangible and intangible assets per worker has been relatively constant over time, but played a more significant role in the US than in EA-12. Labour composition measures the changes affecting the labour input, or how human capital evolves over time. In the US, labour composition has been relatively stable. In the EU, labour composition experienced a sudden increase in the period 2008-2013 probably due to skilled workers keeping their jobs after the Great Financial Crisis. Finally, Total Factor Productivity (TFP) measures the growth in labour productivity that cannot be attributed to change in physical and human capital. It reflects how efficiently labour is used and combined in the production of goods and services. TFP made a significant contribution to labour productivity growth in both regions, but much more so in the US than in the EU.
Figure 2: Labour productivity growth decomposition in EA-12 and the US (percentage points)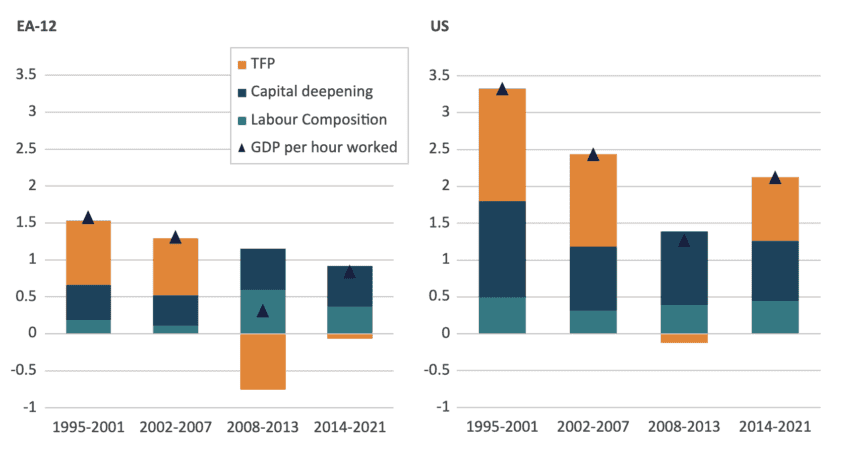 Source: Authors’ calculations based on EU KLEMS – INTANProd. Data pertains to the aggregate market economy, excluding sectors such as public administration, education, and healthcare services.
The importance of TFP cannot be understated. As mentioned, TFP is a crucial measure of productivity because it reflects advancements in technology and innovation. Figure 3 illustrates the development of TFP growth in the EU, EA-12, and the US. Since 1965, both the EU and the US experienced a substantial decline in TFP growth, falling from 3 percent in the US and 4 percent in the EA-12 to around 0.5 percent today. However, compared to the US, the EU’s TFP growth took a deeper dive during the Great Financial Crisis and the subsequent sovereign debt crisis in the early 2010s. However, the EU’s TFP slowdown began well before these events, suggesting the presence of deeper structural factors[2].
Figure 3: Total Factor Productivity (TFP) growth (percent, 5-year moving average)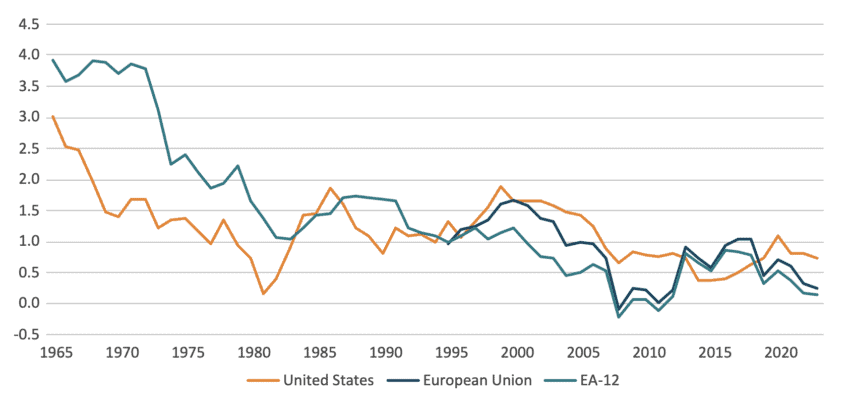 Source: Authors’ calculation based on AMECO data
[1] EA-12 countries include: Austria, Belgium, Finland, France, Germany, Greece, Ireland, Italy, Luxembourg, Netherlands, Portugal, and Spain.
[2] Fernald, J., & Inklaar, R. (2020). Does Disappointing European Productivity Growth Reflect a Slowing Trend? Weighing the Evidence and Assessing the Future. International Productivity Monitor, 38, 104–135.
3. Explaining the EU-US Productivity Divergence
The previous chapter highlighted a deceleration in productivity growth within both the EU and the US. However, this slowdown has been more pronounced in Europe, resulting in a widening productivity gap between the two regions. This chapter delves into this divergence by examining four key drivers of long-term productivity growth: the innovation process; the diffusion of intangible capital; market dynamism; and market openness to international trade and foreign direct investment.
3.1 The Process of Innovation
Technological change and innovations are associated with production efficiency, lower production costs, and more output. It is common practice to assess countries’ relative successes of innovation through the lens of innovation inputs, in the form of Research and development (R&D) expenditure and the number of people performing research activities, and innovation outputs, in the form of the number of technological patents.
The EU has been performing poorly in comparison with the US in terms R&D expenditure. Figure 4 shows domestic expenditure on R&D, expressed in constant PPP dollars. In 1991, US R&D expenditure was almost 40 percent larger than the EU. This gap slowly widened over time until 2011 when the rate of growth of US expenditure in R&D clearly outpaced the EU’s. Between 2014 and 2021, the average year-on-year growth rate in R&D expenditure in the US was almost twice that of the EU, at 5.6 percent against 2.7 percent. As a result, US R&D expenditure in 2021 was 77 percent larger than the EU.
Figure 4: Gross domestic expenditure on R&D (GERD), in billion dollars, constant 2015 prices (PPP)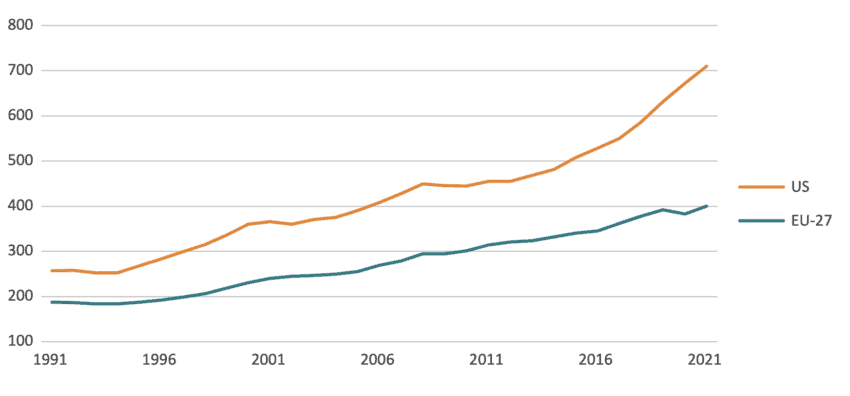 Source: OECD-MSTI. Note: 1991 is the first year for which we have data for the selected countries.
In terms of human capital dedicated to R&D activities, the EU has shown progress in catching up with the US. Figure 5 presents the number of researchers per thousand labour force participants between 1990 and 2021. This metric includes those directly employed in the R&D sector and those involved in fundamental research, such as academia. The data reveals an increase in the EU’s research workforce: the ratio of researchers per 1,000 economically active individuals rose from above 4 in 1995 to more than 9 in 2021. The US also experienced growth, with the number of researchers relative to its labour force increasing from close to 6 to above 9. Since 2015, the US rate of researchers accelerated, matching the trend experienced in the EU.
Figure 5: Total researchers per thousand labour force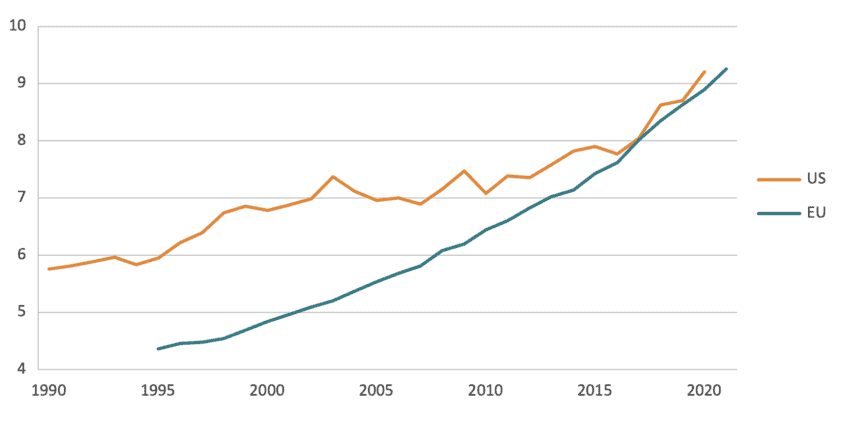 Source: OECD-MSTI.
Figure 6 shows the number of patents filed in technological fields by the EU and the US and their share in global technological patent applications. The number of technological patent applications for both the EU and the US increased over time reaching a peak around 2006. Since then, the number of EU technology patents has remained relatively flat – averaging around 45,000 per year – while in the US the number of technology patents has grown from over 43,000 in 2010 to nearly 56,000 in 2020.
Figure 6: Number of technology patents and share of total technology patents in the EU-27 and the US, 1990-2021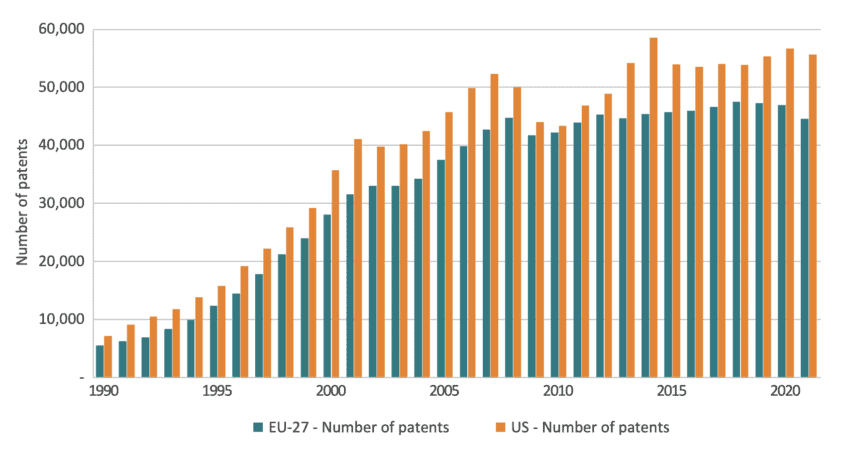 Source: Authors’ calculations based on OECD-REGPAT. Note: Full count of IPC patent application by inventors’ address.
While patent quantity is a metric, it is important to acknowledge that not all patents hold equal weight in terms of innovation. A more granular analysis of patent applications in key complex and critical technologies reveals that the EU also lags behind the US. The European Commission examined the total number of patent applications across six technological fields: computer technology, digital communications, audiovisual technology, optics, telecommunication, and semiconductors[1]. Figure 7 shows that the EU has fallen behind the US in these technologies. Moreover, the gap between the two regions has widened over time. In 2021, the US boasted 86 percent more patent applications in complex technologies compared to the EU, a stark contrast to the 30 percent difference observed in 2000. This divergence can be attributed to the robust growth in US patents for computer technology, digital communication, and, to a lesser extent, semiconductors.
Figure 7: Total number of patent applications by technology complexity in the EU-27 and the US, 2000 and 2021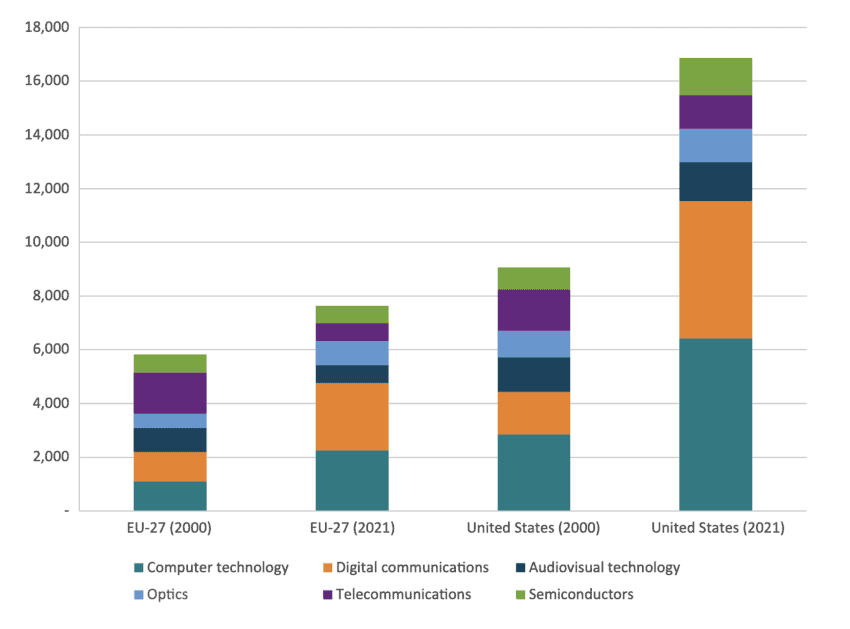 Source: OECD-REGPAT and (Di Girolamo et al., 2023)
3.2. Intangible Capital
In today’s knowledge-driven economy, intangible capital has become a critical driver of productivity growth. Investments in intangible capital, such as industrial design, Artificial Intelligence (AI), datasets, organisational structures, or employee training programs, are essential vehicles to diffuse new technologies across the economy[2] [3].
Studies estimate that one-fifth of intangible capital growth translates into gains in TFP[4]. This effect works through two channels: first, at the firm level, intangible capital contributes to more efficient production. Second, at the macro level, since intangible capital is easily scalable and non-rival, knowledge diffusion across the economy becomes much easier. The next figure shows the positive relationship between investment in intangible capital and TFP across EU member states’ sectors. Sectors that have a higher ratio of intangible capital relative to tangible assets tend to show, on average, higher TFP levels.
Figure 8: Intangible capital intensity and TFP across EU member states and sectors (2016)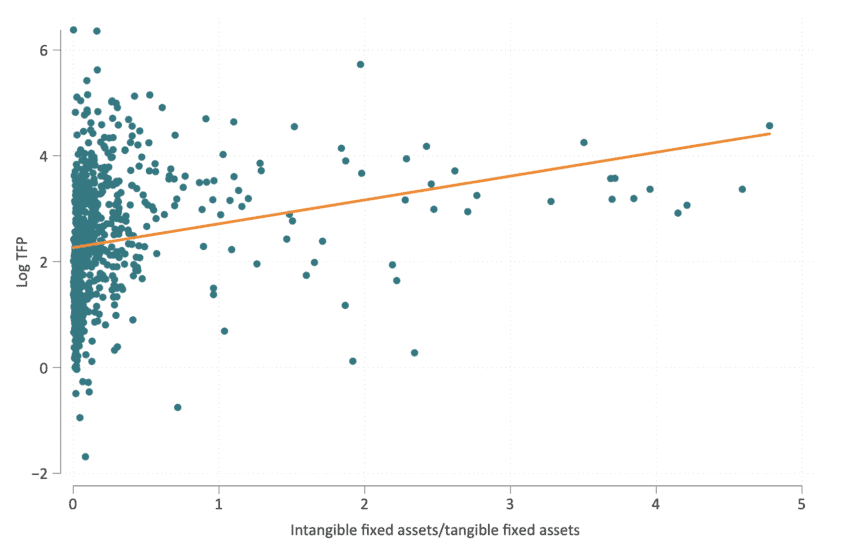 Source: CompNet. Note: The figure presents 2016 data because of data availability and completeness. EU countries include: Belgium, Croatia, Czech Republic, Denmark, Finland, France, Germany, Hungary, Italy, Lithuania, Netherlands, Poland, Portugal, Romania, Slovakia, Slovenia, Spain, Sweden.
The importance of intangible capital in nine Euro area countries and the US is illustrated in the next figure. While investment in tangible assets has kept pace with economic growth, investment in intangible assets has grown significantly faster. As a result, investments in intangibles were larger than in tangible assets in both regions. However, while this trend has been apparent in the US for some time, it was not until the late 2000s that intangible investments in the EA-9[5] surpassed investments in tangible assets. As a percentage of the economy, investment in intangible capital was larger in the US (23 percent) than in the EA-9 (17 percent).
Figure 9: Shares of tangible and intangible capital investment in Gross Value Added (GVA)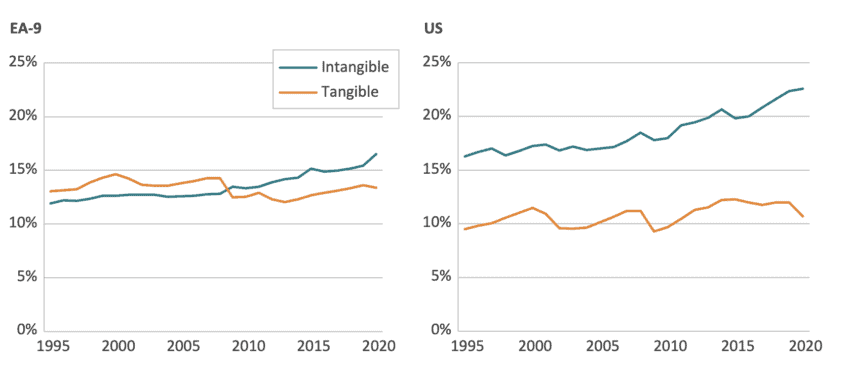 Source: EU KLEMS – INTANProd. Note: Capital investment, measured as Gross Fixed Capital Formation (GFCF), and GVA are deflated at 2015 price indices.
Investment in tangible and intangible capital are not substitutes. For instance, investments in digital infrastructure and in intangible capital complement each other. Physical assets such as computers, cables, and data storage facilities are necessary to support software and cloud computing services. At the same time organisational changes within firms are necessary ingredients for the adopting new ICT equipment[6].
Figure 10 shows that the US has been investing in ICT-related capital much more than Europe. This is particularly visible for services, which include digital intensive sectors such as ICT services but also finance and marketing sectors. During the 1995-1999 period both the EA-12 and the US invested between 4 and 5 percent of non-residential capital into ICT equipment. But by 2015-2020, this number increased by almost 16 percentage points in the US, while it went up by just 3 percentage points in Europe.
Figure 10: Investment in ICT equipment by sector, as a share of non-residential gross fixed capital formation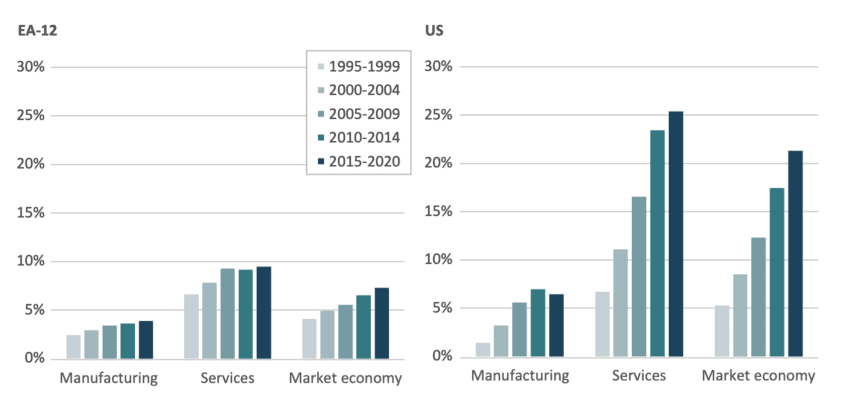 Source: Authors’ calculations based on EU KLEMS – INTANProd. Note: Manufacturing (NACE C); Services (NACE G-N); Market economy (All NACE codes excluding L, O, P, Q, T and U)
Europe’s lack of investment in digital infrastructure is problematic for two reasons. First, it dampens the productivity gain from the diffusion of ICT technologies. Second, it undermines future productivity growth in the EU that could come from the next generation of intangible-related innovations such as AI. Europe’s investment in AI, which is estimated to be US$ 2 billion in 2024, driven by a US $1 billion investment pledge by SAP[7], pales in the face of the forecast US$ 100 billion investment in AI in the US economy.
The result of Europe’s sluggish investment in digital infrastructure and intangible capital is that the ICT sector makes a more modest contribution to its value added growth than in the US economy. The next figure shows the contribution of ICT services to value added growth for EU-12[8] countries and the US. Though both regions follow a similar downward trend, US ICT services contribute on average six times more to value added growth than in EU-12 (omitting years of negative contribution). In 2019, ICT services contributed only 1.7 percentage point to value added growth in the EU-12 compared to 11 percentage points in the US.
Figure 11: Contribution of ICT services to value-added growth (percentage points, 2000-2019)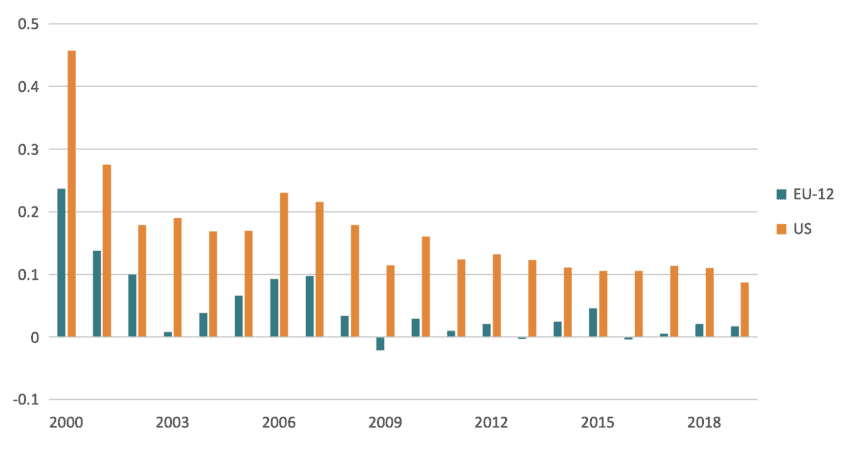 Source: EU KLEMS – INTANProd
3.3. Business Dynamism and Resource Allocation
Productivity growth depends not only on technological advancements, but also on how effectively markets allocate capital and labour towards the most productive companies. An efficient allocation of resources allow higher productivity companies to invest in capital and hire labour at lower costs, boosting their growth. Because overall productivity is the sum of all the individual firm’s productivity, an economy with more productive companies is a more productive economy. This process is not trivial: studies estimate that it accounts for half of TFP growth[9]. However, when market competition weakens, the growth of the most productive companies slows down, hindering the productivity growth in the overall economy.
A proxy for business dynamism and the ability of the market to channel capital and labour from lower to higher productivity companies is the churn rate, which is the sum of the rate at which firms enter (birth rate) and exit (death rate) the market. Business creation and destruction is important because it reflects the process of creative destruction, whereby inefficient firms exit the market in favour of younger and more productive ones. This in turn translates into higher productivity growth. Figure 12 shows that this process has been slowing down in the EA-12 and the US between 2008 and 2020. However, churn rates were higher in the US than the EA-12 throughout the period, in particular because of higher exit rates.
Figure 12: Business dynamism, firm and establishment birth and death rates, 2008-2020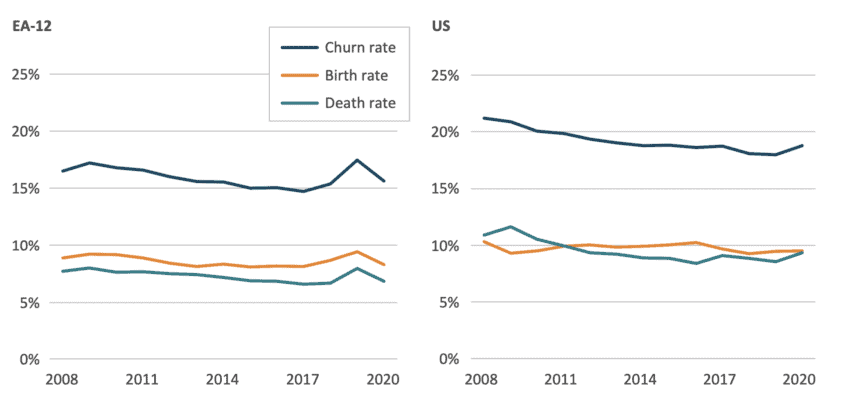 Source: OECD and US Business Dynamics Statistics (BDS). Note: EU and US comparisons must be done with caution due to differences in data collection methodologies. For EA-12 countries data relates to firms and covers the total industry, construction and market services, for the US data relates to establishments and covers all NAICS sectors.
Well-functioning markets should take resources (labour and capital) away from less efficient firms towards the more productive ones. Figure 13 presents this process, also called allocative efficiency, together with job dynamism. The allocative efficiency is based on the Olley-Pakes decomposition of aggregate productivity, also known as the OP gap, while job dynamisms is measured as the sum of job creation and destruction rates. The analysis shows that Europe’s ability to distribute labour and capital towards the most productive companies was on an upward trend until the financial crisis. Since then, the capacity of the market to effectively channel resources towards the more productive European firms has stagnated while job dynamism has declined markedly.
Figure 13: Within-sector allocative efficiency and job dynamism in the EU, percentage change relative to 2000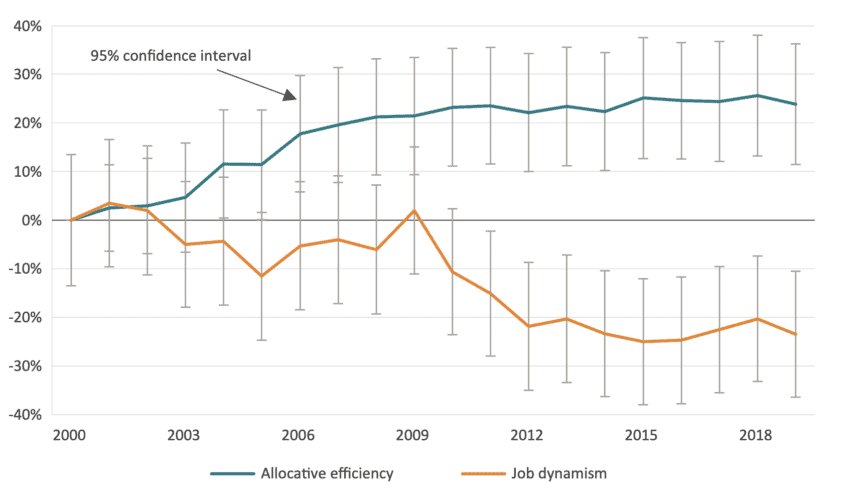 Source: Authors’ calculations based on CompNet data. Note: The graph reports coefficients on year dummy variables from an OLS regression of the OP gap and job dynamism on time, two-digit sector, and country dummies. The error bars show the coefficients’ confidence intervals. EU countries included: Belgium, Croatia, Czech Republic, Denmark, Finland, France, Germany, Hungary, Italy, Lithuania, Netherlands, Poland, Portugal, Romania, Slovakia, Slovenia, Spain, Sweden.
Among the reasons for the decline in business dynamism are the slowing entry rate, especially that of young and high growth firms, and a lack of responsiveness to productivity shocks.[10] The role of young and fast growing firms is especially important for labour dynamism and aggregate productivity because they contribute on average 7.6 percentage point more job creation than old firms, despite employing less than a fifth of the workforce.[11] In parallel, it has been shown that firms’ employment patterns have become less responsive to productivity gains stemming from innovation, which highlights the importance of reviving productivity growth from a labour market perspective.[12]
The role of young firms, especially in innovation sectors, also plays a central role in explaining the innovation deficit of the EU relative to the US. Figure 14 shows the share of startups over time, as a proportion of all enterprises for eleven EU countries and the US between 2008 and 2020. The proportion of startups, defined as firms less than two years old, is larger in many European countries than in the US. However, while this percentage has stayed relatively constant in the US, it has declined in France, Finland, Luxembourg, Italy, and Austria. Research has shown that US young firms have persistently been able to realise higher returns to R&D compared to EU firms, which explains why such firms are inexistant in high innovation and technology intensive sectors in Europe.[13]
Figure 14: Share of startups, as a percentage of enterprises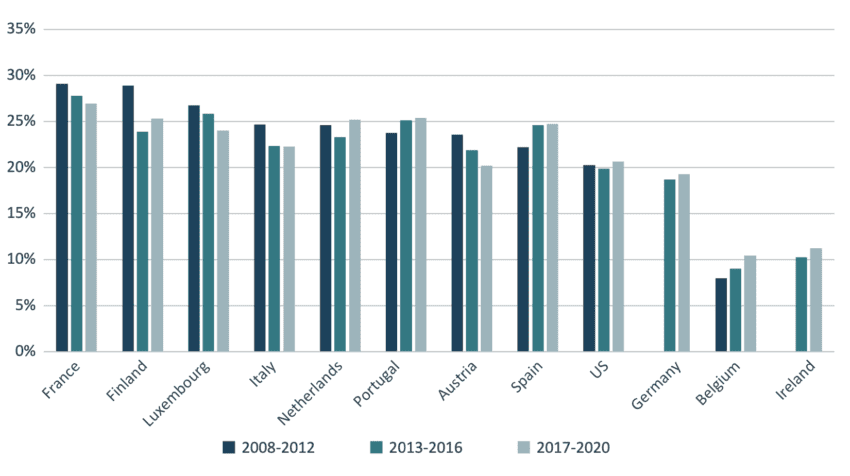 Source: OECD and US Census data (BDS). Note: The share of startups in the US is proportion to all active firms, while for EU countries it is relative to all firms employing at least one person.
3.4. International Exchange: Trade, Investment and Productivity
International trade plays a critical role in boosting productivity growth. It does this through two channels. First, by seeking market access abroad and engaging in international competition, trade incentivises firms to become more efficient. This competition supports the flow of inputs towards the most productive firms mentioned in the previous section. Second, trade facilitates the diffusion of new technologies and innovations. By gaining access to a wider range of foreign goods and services, firms can incorporate these advancements into their own production processes, leading to productivity gains.
Trade openness measures how connected a country’s economy is to the global market. It is calculated as the ratio of a country’s total trade in goods and services (both imports and exports) to its GDP. A high trade openness indicates that a country’s trade is a significant part of its economy. Conversely, a country with limited trade would present lower levels of trade openness. The figure below showed that for several decades EU and US trade openness were at similar levels. However, while US trade openness showed small increases over time, the EU’s trade openness grew much more and stood at 51 percent of GDP in 2022[14].
Figure 15: Trade openness in the EU and the US, 1980 – 2022 (Import and exports of goods in goods and services, percentage of GDP)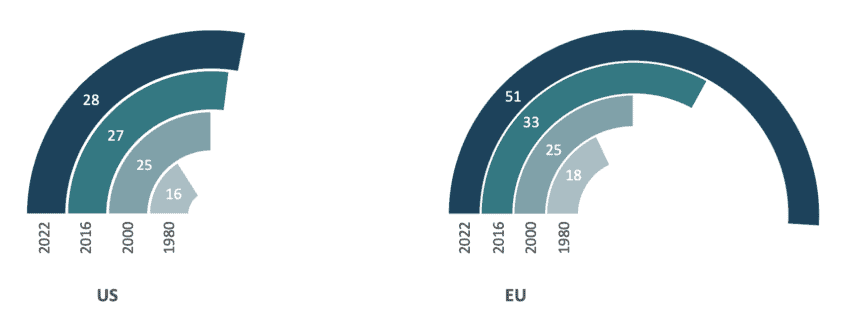 Source: Cernat, L. (2024)[15]. Note: EU trade data does not include intra-EU trade.
While the jury is still out on whether trade participation boosts productivity or vice-versa, it is clear that firms that engage in international trade are more productive than those that do not. Many of these firms participate in trade through Global Value Chains (GVCs). GVCs refer to international production networks where different stages of production take place in various countries. Thanks to GVCs firms can specialise in certain tasks and benefit from the economies of scale and scope granted by larger markets. It is estimated that a 10 percent increase in the level of GVC participation translates on average into a 1.7 percent increase in labour productivity.[16] In this dimension of international trade, the EU also outperforms the US.
Figure 16 shows the share of foreign value added in gross exports, a proxy for GVCs participation, for the Euro Area-19 countries (EA-19) and the US. It measures the extent to which foreign inputs are used to produce intermediate and/or final products to be exported. Foreign participation in the exports of goods and services outside of the EA-19 increased from around 10 percent of total gross exports in 1995 to 18 percent in 2020. By contrast this number decreased during this period in the US, from 8 to 7.5 percent. The figure also indicates that, in recent years, foreign participation in gross exports has flattened in the EA-19 and declined in the US.
Figure 16: Share of foreign value added in gross exports, 1995-2020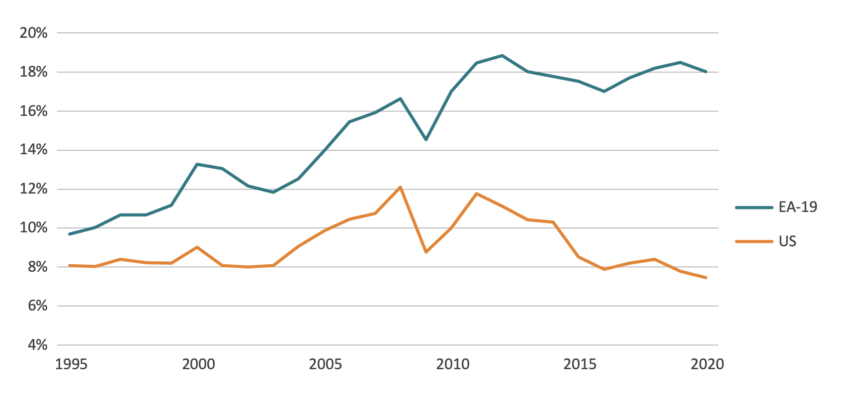 Source: OECD-TiVa
Foreign direct investment (FDI) is another indicator of international exchange and has similar effects on productivity growth than international trade. FDI flows introduce new technologies and expertise into the host country, provide capital for domestic firms, foster a more skilled workforce through the creation of higher-skilled jobs, and injects competition into domestic markets. Moreover, foreign-owned firms have a larger propensity to invest in intangible capital which contributes to knowledge diffusion[17] [18]. In this dimension of international exchange, the EU has fallen behind the US.
Figure 17 illustrates FDI trends in the EU and the US using data on aggregate FDI flows in billion euros. The figure is divided in two parts: inward FDI (left panel) and outward FDI (right panel). Inward FDI refers to investments from other countries into the EU and US, while outward FDI represents investments from the EU and US into other countries.
The data reveals that between 2013 and 2015, the EU held a larger share of both inward and outward FDI compared to the US. However, this trend has shifted, and the US now enjoys a higher level of both inward and outward FDI. This decline in inward FDI for the EU suggests a decrease in its attractiveness to foreign investors relative to the US. Similarly, the fall in outward FDI by EU companies implies a potential limitation on their ability to access resources in other countries and directly serve foreign demand. These changes are bound to have negative impacts on EU productivity growth.
Figure 17: Inward (left) and outward (right) Foreign Direct Investment (FDI) flows, three-year averages, in billion euros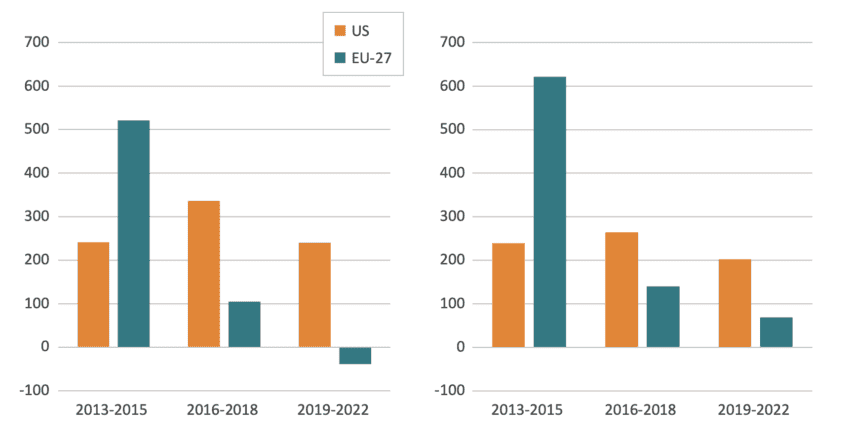 Source: Authors’ calculations based on Eurostat.
[1] Directorate-General for Research and Innovation (European Commission), Di Girolamo, V., Mitra, A., Ravet, J., Peiffer-Smadja, O., & Balland, P.-A. (2023). The global position of the EU in complex technologies. Publications Office of the European Union. https://data.europa.eu/doi/10.2777/454786
[2] Corrado, C., Haskel, J., Jona-Lasinio, C., & Iommi, M. (2022). Intangible Capital and Modern Economies. Journal of Economic Perspectives, 36(3), 3–28. https://doi.org/10.1257/jep.36.3.3
[3] Goodridge, P., Haskel, J., & Wallis, G. (2017). Spillovers from R&D and Other Intangible Investment: Evidence from UK Industries. Review of Income and Wealth, 63, S22–S48. https://doi.org/10.1111/roiw.12251
[4] Corrado, C., Haskel, J., Jona-Lasinio, C., & Iommi, M. (2022). Intangible Capital and Modern Economies. Journal of Economic Perspectives, 36(3), 3–28. https://doi.org/10.1257/jep.36.3.3
[5] Due to data availability reasons in the EU KLEMS – INTANProd database, EA-9 includes: Austria, Germany, Spain, Finland, France, Italy, Luxembourg, Netherlands, and Portugal.
[6] Brynjolfsson, E., Hitt, L. M., & Yang, S. (2002). Intangible Assets: Computers and Organizational Capital. Brookings Papers on Economic Activity, 2002(1), 137–181.
[7] Coatanlem, Y., & Coste, O. (2024). AI Investment in the World. Clubpraxis.com. https://www.clubpraxis.com/en/ai-investment-in-the-world
[8] EU-12 countries are Austria, Belgium, Denmark, Finland, France, Germany, Italy, Luxembourg, Netherlands, Spain, Sweden, and the United Kingdom. The selection of EU countries is based on data availability in the EU KLEMS – INTANProd database.
[9] Baqaee, D., & Farhi, E. (2020). Productivity and Misallocation in General Equilibrium. Quarterly Journal of Economics, 135(1), 105–163.
[10] Tian, C. (2018). Firm-level entry and exit dynamics over the business cycles. European Economic Review, 102, 298–326. https://doi.org/10.1016/j.euroecorev.2017.12.011
[11] C. Criscuolo, P. N. Gal and C. Menon (2014a), “The Dynamics of Employment Growth: New Evidence from 18 Countries”, OECD Science, Technology and Industry Policy Papers no. 14, OECD Publishing, http://dx.doi.org/10.1787/5jz417hj6hg6-en
[12] Biondi, F., Inferrera, S., Mertens, M., & Miranda, J. (2024, March 21). Declining business dynamism in Europe: The role of shocks, market power, and responsiveness. CEPR. https://cepr.org/voxeu/columns/declining-business-dynamism-europe-role-shocks-market-power-and-responsiveness
[13] Cincera, M., & Veugelers, R. (2014). Differences in the rates of return to R&D for European and US young leading R&D firms. Research Policy, 43. https://doi.org/10.2139/ssrn.2382494
[14] Changes in trade openness for the EU and the US could be explained by external factors such as trade with China, Brexit, or trade in fuels and minerals. However, while these aspects are relevant, they are not sufficient to explain the widening gap in trade openness between the EU and the US. See: Cernat, L. (2024). On the importance of trade openness. Blog. https://ecipe.org/blog/on-the-importance-of-trade-openness/
[15] Cernat, L. (2024). On the importance of trade openness. Blog. https://ecipe.org/blog/on-the-importance-of-trade-openness/
[16] Constantinescu, C., Mattoo, A., & Ruta, M. (2019). Does vertical specialisation increase productivity? The World Economy, 42(8), 2385–2402. https://doi.org/10.1111/twec.12801
[17] Cadestin, C., Jaax, A., Miroudot, S., & Zürcher, C. (2021). Multinational enterprises and intangible capital. In OECD. https://www.oecd-ilibrary.org/content/paper/6827b3c9-en
[18] Criscuolo, C., & Timmis, J. (2017). The Relationship Between Global Value Chains and Productivity. International Productivity Monitor, 32, 61–83.
4. Conclusion
The EU’s economy is lagging behind the US. Short-term factors such as US fiscal policy, lower energy prices, and a stronger US dollar are an important part of story but they are just one chapter of a larger book. A longer-term perspective reveals that the US has consistently outperformed the EU in productivity growth. While EU and US productivity were running neck to neck in the 1990s, US productivity was 20 percent higher than the EU in 2022. This is not coincidental. With the exception of trade openness, the US spends more in R&D and produces more patents in critical technologies than the EU; it invests more in intangible capital and has done it for a longer time; its market is more dynamic supporting a better allocation of labour and capital towards the more productive firms; and since 2016 it has received and sent more Foreign Direct Investment than the EU.
There are important points to make about Europe’s performance. For instance, it thrives on its international openness and high participation in international trade – creating positive channels for productivity. Importantly, there is variation in Europe. Central and Eastern European economies have had impressive rates of growth since their independence and, later, accession to the EU. Europe’s process of relative economic decline is rather focused on two regions: Southern Europe and Western Europe. These regions have not kept up pace with other advanced economies, and in recent decades they have been laggards in technology, innovation and market dynamism – important factors for TFP growth.
This Policy Brief has focused on assessing the drivers of low productivity in Europe, using the US as a benchmark to pinpoint areas for improvement. Understanding these problems is a critical first step towards finding the right solutions. Our analysis suggests that improving Europe’s productivity hinges on increased R&D spending. The target of spending 3 percent of GDP on R&D reflected the profile of the economy in the 1990s, but since then the role of knowledge, human capital, and scientific discovery in the economy has become much bigger. A better target for the economy of the future is 4 or 5 percent of GDP, and to achieve that by 2040 requires a significant increase in R&D spending in the next 15 years. This goal requires doubling R&D spending in the next EU Financial Framework, with member states themselves taking greater responsibility for incentivising private sector R&D investment and expanding their national research budgets.
The second recommendation is to invest more on intangible and ICT infrastructure. Traditionally, government policies have been geared towards supporting a structure of production where high-productivity activities took a larger share of the country’s value added. The digitalisation of the economy presents a shift, with a larger share of innovation coming in the form of zeroes and ones rather than nuts and bolts. Investment in intangible capital is critical to facilitate this process. New productivity-enhancing technologies, such as AI and software programmes, are themselves intangible assets. Additionally, intangible elements like managerial skills, organisational structures, and training programmes are essential for adopting and diffusing these new digital technologies. The EU single market plays a crucial role in lowering costs and accelerating these investments. This is because many intangibles are non-rival, meaning their diffusion is significantly easier. To achieve this, the EU must address its internal and external market barriers for services, which is the primary channel for trading intangible assets. The EU should also foster an ideal environment for private investment in infrastructure and network innovation. This ensures that investments in intangible assets are accompanied by investments in ICT infrastructure.
The final recommendation is to make the EU the most thriving and competitive market in the world. European policies, including industrial policy, should support entrepreneurship and make the economic environment more conducive to productivity growth. EU policymakers should put firm productivity at the centre of their thinking but avoid targeting in advance which activities – let alone firms – should be more productive than others. Here again, the role of the single market is crucial in fostering greater market dynamism. The single market should not only be seen as a platform for Europe companies to scale up but a place where the most competitive companies, from Europe and elsewhere, compete to deliver the best possible products. European policymakers should take inspiration from Jay-Z’s song, Empire State of Mind and set the market conditions to ensure that if a company can make it in the EU single market, it can make it everywhere.
References
Baqaee, D., & Farhi, E. (2020). Productivity and Misallocation in General Equilibrium. Quarterly Journal of Economics, 135(1), 105–163.
Biondi, F., Inferrera, S., Mertens, M., & Miranda, J. (2024, March 21). Declining business dynamism in Europe: The role of shocks, market power, and responsiveness. CEPR. https://cepr.org/voxeu/columns/declining-business-dynamism-europe-role-shocks-market-power-and-responsiveness
Brynjolfsson, E., Hitt, L. M., & Yang, S. (2002). Intangible Assets: Computers and Organizational Capital. Brookings Papers on Economic Activity, 2002(1), 137–181.
Cadestin, C., Jaax, A., Miroudot, S., & Zürcher, C. (2021). Multinational enterprises and intangible capital. In OECD. https://www.oecd-ilibrary.org/content/paper/6827b3c9-en
Cernat, L. (2024). On the importance of trade openness. Blog. https://ecipe.org/blog/on-the-importance-of-trade-openness/
Cincera, M., & Veugelers, R. (2014). Differences in the rates of return to R&D for European and US young leading R&D firms. Research Policy, 43. https://doi.org/10.2139/ssrn.2382494
Coatanlem, Y., & Coste, O. (2024). AI Investment in the World. Clubpraxis.Com. https://www.clubpraxis.com/en/ai-investment-in-the-world
Corrado, C., Haskel, J., Jona-Lasinio, C., & Iommi, M. (2022). Intangible Capital and Modern Economies. Journal of Economic Perspectives, 36(3), 3–28. https://doi.org/10.1257/jep.36.3.3
Criscuolo, C., Gal, P. N., & Menon, C. (2014). The Dynamics of Employment Growth: New Evidence from 18 Countries. OCDE. https://doi.org/10.1787/5jz417hj6hg6-en
Criscuolo, C., & Timmis, J. (2017). The Relationship Between Global Value Chains and Productivity. International Productivity Monitor, 32, 61–83.
Directorate-General for Research and Innovation (European Commission), Di Girolamo, V., Mitra, A., Ravet, J., Peiffer-Smadja, O., & Balland, P.-A. (2023). The global position of the EU in complex technologies. Publications Office of the European Union. https://data.europa.eu/doi/10.2777/454786
Erixon, F. Guinea, O. & du Roy, O. (2023). If the EU was a State in the United States: Comparing Economic Growth between EU and US States. Report, ECIPE, Brussels, Policy Brief 07/2023, 18 p.
Goodridge, P., Haskel, J., & Wallis, G. (2017). Spillovers from R&D and Other Intangible Investment: Evidence from UK Industries. Review of Income and Wealth, 63, S22–S48. https://doi.org/10.1111/roiw.12251
IMF. (2024). Regional economic outlook: Europe. International Monetary Fund. https://www.imf.org/en/Publications/REO/EU/Issues/2024/04/05/regional-economic-outlook-europe-april-2024
Le Grand Continent (2024, April 25). Bâtir un nouveau paradigme. Le discours intégral d’Emmanuel Macron à la Sorbonne. Le Grand Continent, Retrieved from http https://legrandcontinent.eu/
Tian, C. (2018). Firm-level entry and exit dynamics over the business cycles. European Economic Review, 102, 298–326. https://doi.org/10.1016/j.euroecorev.2017.12.011