Calling on the EU-US Trade and Technology Council: How to Deliver for the Planet and the Economy
Published By: Oscar Guinea Vanika Sharma Philipp Lamprecht Dyuti Pandya Oscar du Roy
Subjects: European Union North-America Sectors
Summary
This Policy Brief proposes the establishment of an agreement on conformity assessment between the EU and the US that covers machinery and electrical equipment. The initiative aims to increase the number of European and US conformity assessment bodies authorized to test and certify EU and US machinery and electrical equipment for exports into each other’s markets, without recognizing the equivalency or otherwise altering the product requirements in regulation, standards, or other normative documents on either side.
While this study focuses on the economic effects of an agreement on conformity assessment that includes machinery and electrical equipment, the scope of such an agreement could potentially be extended to several additional product categories, particularly those that are subject to requirements for mandatory third-party conformity assessment in both the EU and the US.
The increase in the number of conformity assessment bodies is expected to reduce the costs and the time required to demonstrate conformity. If this policy succeeds as expected in achieving a reduction in trade costs between 2 and 6 percent, US exports to the EU are projected to increase between US$ 11 billion and US$ 32.5 billion while EU exports to the US are estimated to grow by between US$ 13.8 billion and US$ 42.2 billion. In percentage terms, US firms are anticipated to experience a larger increase in exports of machinery and electrical equipment than their EU counterparts.
The increase in trade flows as a result of this agreement is estimated to be larger than the rise in trade flows achieved in other Free Trade Agreements signed by the EU or the US. Moreover, as an increasing number of EU regulations begin to mandate third-party conformity assessment, US firms will increasingly benefit from this agreement when exporting to the EU.
Given China’s status as the largest supplier of machinery and electrical equipment to both the EU and the US, the implementation of an EU-US agreement on conformity assessment would not only improve conditions for transatlantic trade but also lead to reduced trade dependence for the EU and the US on China. The reduction in trade costs between the EU and the US on machinery and electrical equipment due to the agreement could lower Chinese exports to the EU and the US by between US$ 6.5 billion and US$ 19.4 billion.
Importantly, machinery and electrical equipment are crucial inputs for some of the key technologies in which the EU and the US Administrations have identified trade dependencies on China. However, in contrast with other policies aimed at reducing reliance on Chinese imports, an agreement on conformity assessment for machinery and electrical equipment will not require public subsidies or impose any financial burden on taxpayers.
This agreement also has the potential to benefit the environment. Machinery and electrical equipment are essential inputs for green technologies. Therefore, a reduction in the cost and time of conformity assessment in these industries will accelerate the adoption of green technologies.
An agreement on conformity assessment between the EU and the US covering green goods and clean technologies could increase transatlantic exports between US$ 3.1 billion and US$ 9.2 billion. While this increase in exports is significant, broadening the scope of the agreement to include the entirety of machinery and electrical equipment, rather than just a subset, is projected to lead to trade effects eight times larger. Moreover, as green technologies rapidly evolve, an agreement on conformity assessment has the potential to serve as a dynamic instrument that evolves to accommodate future regulatory and economic developments on climate and the environment on both sides of the Atlantic.
This Policy Brief was commissioned and funded by Danish Industry, FME, FMTI, Metaalunie, Swissmem, and the Technology Industries of Sweden (Teknikföretagen).
1. Introduction
For several years now, there has been a worrying trend of growing frictions in trade and technology policy between the European Union and the United States. Both sides are also wrestling with rapid innovation in many sectors, changing conditions for market competition, and new power structures in the global economy. They acknowledge the need to deepen transatlantic cooperation to solve bilateral frictions and build up a better proposition for transatlantic leadership in international economic and regulatory policy. As a result, the EU-US Trade and Technology Council (TTC) was established in June 2021.
The case for TTC has only become stronger since it was launched, and it is now high time for the EU and the US to deliver tangible results that have meaningful impacts on transatlantic competitiveness and growth. This Policy Brief proposes the establishment of an agreement on conformity assessment covering machinery and electrical equipment (HS codes 84 and 85 respectively) that can be initiated, negotiated, and finalized under the EU-US TTC Transatlantic Initiative on Sustainable Trade[1]. This could be achieved by expanding the existing EU-US Mutual Recognition Agreement (MRA) from 1998, whereby the EU and the US accept the conformity assessment results carried out for specified industrial products and goods, by adding an annex that covers machinery and electrical equipment[2]. For these sectors, both Europe and the US have competitive manufacturers and a big ecology of Small and Medium-sized Enterprises (SMEs) that trade directly and indirectly through global supply chains. They represent a strong case for growth.
Such an agreement has the potential to boost EU-US trade by up to US$ 75 billion. As a comparison, EU and Canada bilateral exports of goods between 2016 (pre-CETA) and 2022 (post-CETA) grew by US$ 26 billion[3] and the EU-New Zealand Free Trade Agreement (FTA) is expected to increase bilateral trade by about US$ 4.2 billion[4]. Similarly, the US-South Korea FTA supported an increase in US exports to South Korea from 2011 (pre-FTA) to 2019 of US$ 13.1 billion[5].
An agreement on conformity assessment, while not eliminating the requirement for third-party testing and certification, will significantly expand the market for these assessments. Presently, for US firms exporting to the EU, third-party conformity assessments for machinery and electrical equipment must be carried out within the EU by a notified body. In the EU, a small number of conformity assessment bodies exist to provide certification for the US market, however they are not enough given the high volumes of trade taking place between the two regions. Implementing an agreement on conformity assessment would enable conformity assessment bodies in the US to provide certification for EU markets, while increasing the number of conformity assessment bodies in the EU that can provide certifications for the US market. Essentially, it will allow firms in both the EU and the US to utilize third-party laboratories within either region for these assessments. This expansion of the transatlantic conformity assessment market will foster competition, which in turn is expected to reduce both the costs and the time required to demonstrate conformity.
Beyond the advantages of reducing trade costs and increasing exports from both the US and the EU, there are two other vital reasons to establish an agreement on conformity assessment for machinery and electrical equipment between the EU and the US. First, such an agreement would significantly bolster economic security and resilience. Second, the agreement can play a crucial role in mitigating the costs associated with climate change policies.
In relation to the first argument, the EU and the US are actively seeking ways to reduce their dependency on China, while recognising the physical and fiscal constraints associated with reshoring production. Historically, efforts to foster economic integration between the EU and US have been met with apprehension due to concerns over increased competition. However, it is important to note that this competition is intrinsically linked with supply chain integration through trade and investment, effectively binding European and American companies together. In this context, it is imperative for both administrations to move beyond mercantilist views and concentrate on enhancing bilateral trade. An agreement on conformity assessment would stimulate transatlantic trade and fortify EU and US firms in their competition against Chinese counterparts, diminishing the EU and US’s reliance on Chinese suppliers in the machinery and electrical equipment sectors.
In relation to the second argument, the EU and the US are committed to the decarbonization of their economies, with several policies already in effect to support this transition. While accelerating green investments is imperative, the implementation of policies that reduce the transition costs is equally crucial. A transatlantic market for green goods and technologies, underpinned by an agreement on conformity assessment for machinery and electrical equipment, aligns with environmental objectives. Notably, of the goods that can be classified as environmentally beneficial (see Box 1 and Annex 1), 75 percent of the trade between the EU and the US in these products consists of machinery and electrical equipment[6]. Moreover, unlike other policy measures that rely on public subsidies, an agreement on conformity assessment enhances competitiveness and promotes climate change mitigation through market-driven competition.
The existing EU-US MRA from 1998 operates on the principle that conformity assessment bodies in either the EU or the US can certify compliance under each other’s regulatory frameworks[7]. Expanding this agreement to include machinery and electrical equipment would be a straightforward and effective policy to deepen EU-US economic integration, gain economic security and lower the cost of climate change policies. Furthermore, extending the scope of the current agreement could lay the groundwork for future integration of additional sectors and products subject to conformity assessment.
This Policy Brief argues strongly in favor of such a policy and provides evidence to support it. The forthcoming chapter details the level of transatlantic economic integration in machinery and electrical equipment over the past two decades. The third chapter offers a detailed quantification of the economic impact an EU-US agreement on conformity assessment for machinery, electrical equipment, and green goods sectors could have. It provides compelling evidence that such an agreement would not only boost transatlantic trade but also significantly reduce reliance on Chinese suppliers. The final chapter delves into how extending the 1998 EU-US agreement can realize these objectives.
[1] The objective of the TTC Transatlantic Initiative on Sustainable Trade’s is to “create a resilient and integrated transatlantic market that accelerates the transition to a climate-neutral and circular economy”. Source: Transatlantic Initiative on Sustainable Trade – work programme (n.d) EU-US Trade and Technology Council Futurium. Retrieved from: https://futurium.ec.europa.eu/en/EU-US-TTC/pages/annex-i-transatlantic-initiative-sustainable-trade-work-programme
[2] Agreement on mutual recognition between the European Community and the United States of America. Retrieved from https://eur-lex.europa.eu/EN/legal-content/summary/eu-united-states-of-america-mutual-recognition-agreement-mra.html
[3] Eurostat. Easy Comext. The EU-Canada trade value for 2016 was deflated using 2022 as the base year. Both values were then converted to USD using the 2022 EUR-USD average exchange rate.
[4] European Commission (2024). The EU-New Zealand trade agreement. Retrieved from: https://policy.trade.ec.europa.eu/eu-trade-relationships-country-and-region/countries-and-regions/new-zealand/eu-new-zealand-agreement_en. Bilateral trade (goods and services) is expected to increase by 30 percent due to the FTA. In 2022, bilateral trade between EU and New Zealand (goods and services) amounted to € 13.5 billion. A 30 percent increase would amount to an absolute increase of € 4 billion. This value was converted into USD using the 2022 average EU-USD exchange rate.
[5] USTR (2024). U.S.- South Korea Free Trade Agreement. Retrieved from https://ustr.gov/trade-agreements/free-trade-agreements/korus-fta. U.S. goods exports to South Korea in 2019 were US$ 56.5 billion up by 30.1 percent from 2011 (pre-FTA) which indicates an increase of US$ 13.1 billion. Figure not deflated.
[6] 75 percent represents the share of bilateral trade between the EU and the US of green goods belonging to product categories 84 and 85 over the bilateral trade between the EU and the US of all green goods. For US imports from the EU, this value represented 74.9 percent, while for EU imports from the US this value amounted to 74 percent.
[7] Agreement on mutual recognition between the European Community and the United States of America – Joint Declaration. L31/3. (1999); also see: Summaries of EU legislation (n.d.) EUR-Lex. https://eur-lex.europa.eu/EN/legal-content/summary/eu-united-states-of-america-mutual-recognition-agreement-mra.html#keyterm_E0002
2. EU-US Market on Machinery and Electrical Equipment
2.1 EU-US Economic Integration on Machinery and Electrical Equipment
In 2022, the transatlantic trade in machinery and electrical equipment amounted to US$ 192 billion. 61 percent of that trade was made in the machinery sector, 26 percent in the electrical equipment sector and 13 percent comprised goods from both sectors that are integral to fighting climate change (see Box 1). To put this into perspective, the market size for machinery and electrical equipment between the EU and US significantly surpassed that of pharmaceutical products, mineral fuels, vehicles, and aircraft[1]. In fact, the value of the transatlantic trade in machinery and electrical equipment was nearly threefold that of the market for vehicles.
Figure 1 shows that the EU’s market share in the US across the three product categories has been relatively stable, only dropping from 12 percent to 7 percent between 2021 and 2022. In contrast, during the period from 2002 to 2022, China experienced a significant rise in its US market share, increasing from 17 percent to 30 percent. However, the largest market share is held by a collective of other countries, including major suppliers like Mexico, Japan, Malaysia, and Vietnam.
Figure 2 presents an overview of the EU’s export trends to the US[2] across the three product categories between 2002 and 2022. The data reveals an increase in exports for all categories. Even though, there was a temporary decline during the 2009 financial crisis, a recovery followed[3]. Over this 20-year period, exports of green goods presented the most significant growth, with an increase of 58 percent. This was followed by machinery, which saw an increase of nearly 16 percent, and then electrical equipment, with a modest rise of 1 percent. In absolute terms, machinery remains the dominant export category from the EU to the US. For example, in 2022, exports of machinery were equal to US$ 81 billion, ahead of the combined exports of electrical equipment and green goods, which amounted to US$ 50 billion.
Figure 1: EU, China, and other countries’ share of US imports of machinery, electrical equipment and green goods belonging to machinery and electrical equipment (share, 2002-2022)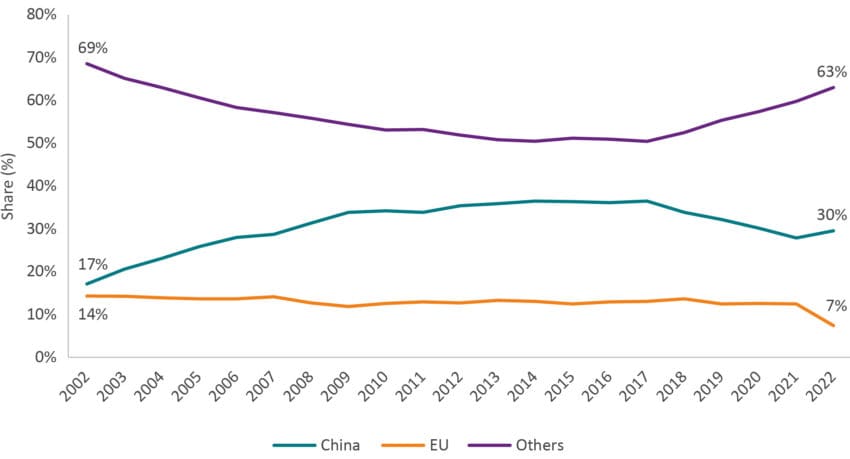 Source: UN Comtrade, author’s calculation.
Figure 2: US imports of EU machinery, electrical equipment and green goods belonging to machinery and electrical equipment (value, bn, 2002-2022)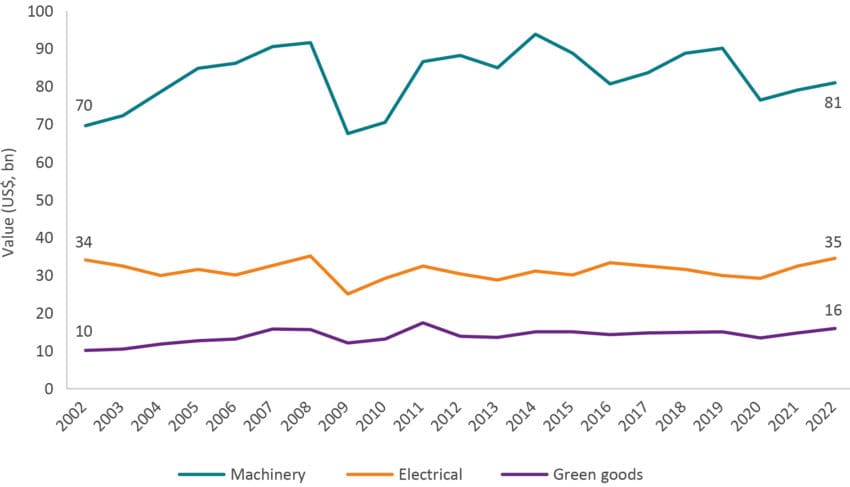 Source: UN Comtrade, author’s calculation.
Figure 3 illustrates the trends in US exports to the EU for machinery, electrical equipment, and green goods between 2002 and 2022. During this period, there was a general decrease in US exports of these products to the EU. Electrical equipment experienced the most significant decline over these 20 years, falling by 40 percent, while US exports of machinery to the EU declined by 20 percent. In terms of absolute values, machinery remained the largest export category from the US to the EU.
Between 2002 and 2022, there has been a shift in the US’s market position in the EU, moving from the first to the second-largest supplier, due to China’s emergence as the EU’s top supplier. Figure 4 offers a stark illustration of this trend: in 2002, the US held a larger portion of the EU market for these products than China, holding 21 percent against China’s 12 percent. By 2022, China witnessed a dramatic surge in its market share for these categories, reaching 44 percent, while the US share declined to 11 percent. This shift is not exclusive to the US; other major suppliers like the UK, Japan, South Korea, Malaysia, and Vietnam also experienced a reduction in their EU market share, which collectively decreased from 67 percent in 2002 to 45 percent in 2022.
Figure 3: EU imports of US machinery, electrical equipment and green goods belonging to machinery and electrical equipment (value, bn, 2002-2022)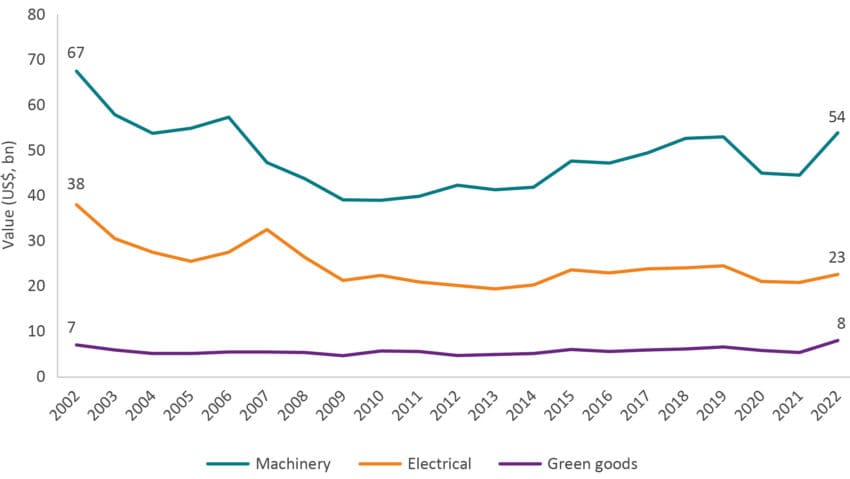 Source: UN Comtrade, author’s calculation.
Figure 4: US, China, and other countries’ share of EU imports of machinery, electrical equipment and green goods belonging to machinery and electrical equipment (share, 2002-2022) Source: UN Comtrade, author’s calculation.
2.2 The Rise of China in Machinery and Electrical Equipment
One of the most prominent shifts in the transatlantic market of machinery and electrical equipment over the past two decades has been the rise of China as a leading supplier of these products to the EU and the US. From 2002 to 2022, China’s share in the EU’s imports of machinery surged from 10 to 39 percent, while in the electrical equipment sector, the increase was even more pronounced, jumping from 14 to 49 percent. A similar trend is observed in green goods, with China’s share escalating from 11 to 41 percent. In the US market, the pattern of increasing reliance on Chinese imports is consistent. Over the same twenty-year period, the US’s imports of Chinese machinery rose from 13 to 25 percent, electrical equipment from 16 to 30 percent, and green goods from 13 to 19 percent.
As illustrated in Tables 1 and 2, the rise of China as a key supplier to the EU and the US is not just notable for its consistent growth over the years but also for the significant margin by which it has surpassed other countries. By 2022, China had established itself as the largest supplier of all three product categories – machinery, electrical equipment, and green goods – to both the EU and the US. This dominance is particularly striking in the EU market, where China’s market share significantly exceeds that of other non-EU suppliers[4].
Table 1: EU imports of machinery, electrical equipment and green goods belonging to machinery and electrical equipment by trade partner (top-five) in 2022 Source: UN Comtrade, author’s calculation.
Table 2: US imports of machinery, electrical equipment and green goods belonging to machinery and electrical equipment by trade partner (top-five) in 2022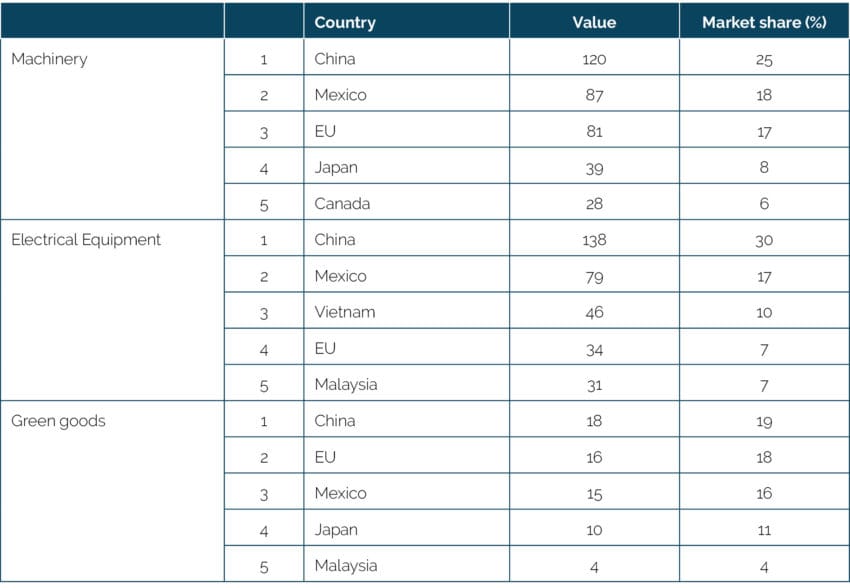 Source: UN Comtrade, author’s calculation.
The increasing market share of China in the EU and US imports of machinery and electrical equipment reflects a broader global trend. As illustrated in Figure 5, Chinese firms have consistently expanded their footprint in these industries on a global scale, while firms from the US and EU have experienced a contrasting trajectory of decline. The EU maintained its status as the world’s largest supplier in these sectors until 2008, at which point China surpassed it. The rise of Chinese firms was even more pronounced in relation to the US, overtaking American firms as early as 2003. By 2022, the cumulative market share of the US and EU combined fell short of China’s share by 7 percentage points.
The ascent of China in global trade is further evidenced by its increasing Revealed Comparative Advantage (RCA)[5], as depicted in Figure 6. This index, which evaluates a country’s export performance relative to the global average, provides a clear measure of competitive strength. The analysis across machinery, electrical equipment, and green goods shows a consistent upward trajectory in China’s RCA, indicating a strengthening position in exports of these products on the global stage. In contrast, the RCA for both the EU and the US in these categories has remained stagnant or has experienced a decline.
Figure 5: EU, US, China global market share of machinery, electrical equipment and green goods belonging to machinery and electrical equipment (share of global imports) (2002-2022) Source: UN Comtrade, author’s calculation.
Figure 6: EU, US, China RCA for machinery, electrical equipment and green goods belonging to machinery and electrical equipment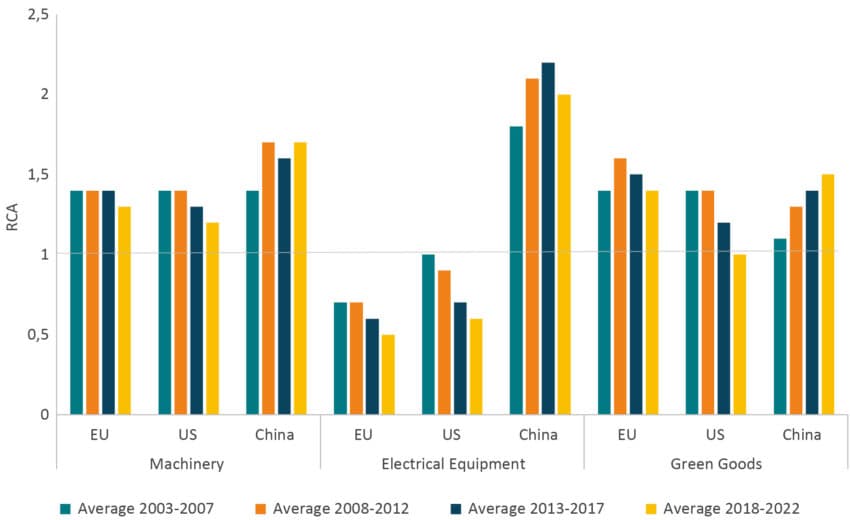 Source: UN Comtrade, author’s calculation.
[1] The full name of the sectors, their HS codes, and the value of bilateral trade are as follows: Pharmaceutical Products (30) – US$ 137 billion, Mineral Fuels, Oils, and Products of their Distillation (27) – US$ 131 billion, Vehicles other than Railways/Tramways Roll Stock, parts and access (87) – US$ 68 billion, Aircraft, Spacecraft, parts thereof (88) – US$ 28 billion.
[2] All trade values have been calculated using import data due to higher reliability. However, throughout the text, ‘imports’ and ‘exports’ are used interchangeably. For instance, EU imports of US products are also expressed as US exports to the EU, and vice versa.
[3] The export values have been deflated using 2022 as the base year to make them comparable over time.
[4] EU is a significant global exporter of machinery and electrical equipment. Intra-EU trade of machinery and electrical equipment can therefore reduce EU’s dependency on extra-EU imports, including those from China. In fact, when looking at China’s share in total EU imports (including intra-EU trade) of machinery and electrical equipment in 2022, it accounted for 22 percent. At the same time, intra-EU imports of machinery and electrical equipment accounted for 50 percent.
[5] An RCA value greater than 1 indicates that the country is relatively more efficient or competitive in producing a particular good compared to the average world performance. Conversely, a value less than 1 indicates a comparative disadvantage in that specific good.
3. The Impact of an EU-US Agreements on Conformity Assessment for Machinery and Electrical Equipment
3.1 An Economic Literature on the Impact of Agreements on Conformity Assessment
Conformity assessment, a critical process of assessing and certifying that a product meets the relevant requirements in regulation, standards, or other normative documents, typically involves testing and certification either by the producer or by independent conformity assessment bodies. This process, while essential for quality and safety assurance, has significant implications for trade, particularly in terms of additional costs borne by producers.
As outlined in the introduction, this is especially pertinent for EU and US exporters of machinery and electrical equipment when accessing each other’s markets. These additional costs manifest in various forms, including extended product approval procedures that can delay market entry for new products, the need for specialized technical expertise for testing, and the transportation expenses incurred when accessing foreign conformity assessment bodies. Collectively, these factors contribute to increased export costs, making products more expensive and, consequently, leading to a reduction in trade compared to a scenario with fewer barriers[1].
In this context, agreements on conformity assessment have become a common measure to promote trade liberalization. These agreements operate on the principle of mutual trust in partner countries’ conformity assessment bodies. They allow for products to be tested and certified by a mutually recognized domestic third-party accreditation body before export, which removes the additional costs associated with requirements on undertaking testing in the importer’s own country.
The extent of trade enhancement resulting from any agreement on conformity assessment is influenced by the specific characteristics of the products and markets involved. Generally, it can be observed that the more burdensome and time-consuming the conformity assessment procedures are, the greater the potential for trade creation following the implementation of an agreement on conformity assessment between two trading blocs. Furthermore, trade creation through these kinds of agreements occurs via two distinct mechanisms. The first is where the reduction in trade barriers encourages new producers to enter the export markets for a specific product[2]. The second, sees existing exporters increasing the volume of their products in foreign markets due to eased restrictions[3][4].
Empirical studies have sought to quantify the effects of agreements on conformity assessment, along with other policies designed to alleviate the burdens of regulatory divergence. These studies encompass a broad spectrum, covering different years, countries, economic sectors, and employing a range of quantitative methodologies. Despite this diversity, a unifying theme emerges: agreements on conformity assessment are consistently found to reduce trade costs, thereby promoting greater economic integration among trading partners. Table 3 provides a synthesized overview of the key findings from the most recent and relevant empirical research in this field.
Table 3: Summary of the literature on the economic impact of agreements on conformity assessment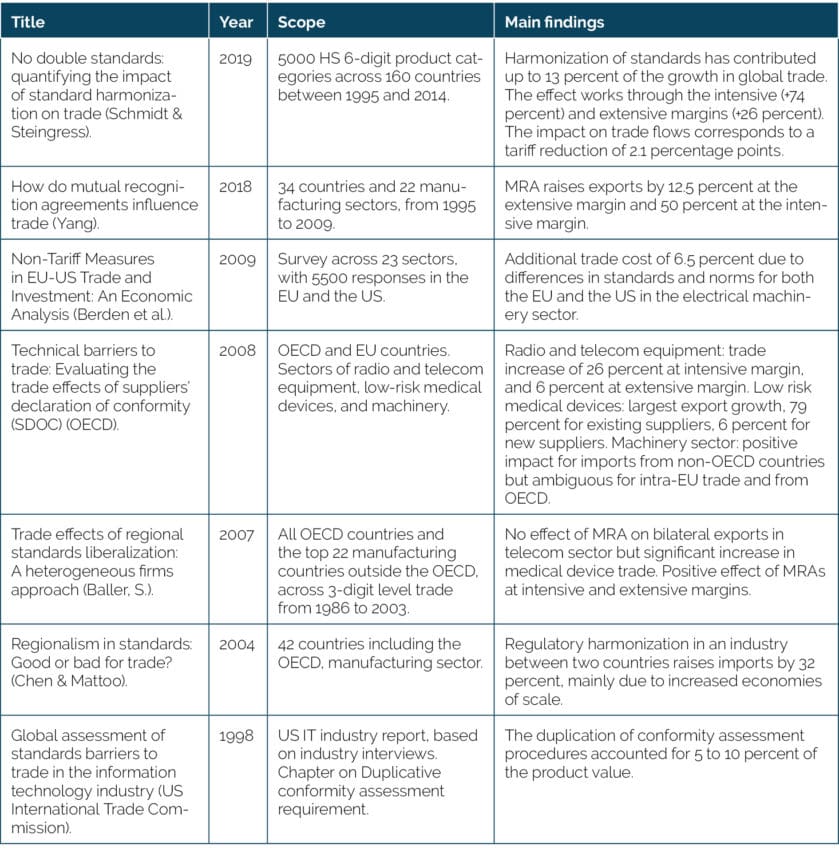 The summarized empirical literature on agreements on conformity assessments and similar policies to lower the costs of regulatory heterogeneity underscores two primary findings. Firstly, the presence of divergent conformity assessment procedures leads to higher costs for exporters. For example, in the electrical machinery sector, exporters from the EU and US encounter additional trade costs of up to 6.5 percent[5]. This aligns with findings from the US International Trade Commission Report on the Information and Communication Technology (ICT) sector, which indicates that duplicative conformity assessments can constitute 5 to 10 percent of a product’s value[6]. Moreover, regulatory harmonization is shown to be equivalent to a tariff reduction of about 2.1 percentage points[7].
Secondly, the implementation of policies similar to an agreement on conformity assessment is linked to a significant reduction in trade barriers and a corresponding increase in trade. In one of the most comprehensive studies in this field, Yang (2018) [8] found that MRAs in 22 manufacturing sectors resulted in an average export increase of 50 percent for incumbent firms. These are firms that were already present on the market and bore extra costs due to conformity assessments. Additionally, new market entrants, contributing to the extensive margin, experienced a 12.5 percent increase in exports. Baller (2007) corroborates these findings in the context of medical devices trade, emphasizing the pro-competitive effects brought about by the entry of new firms in export markets[9].
3.2 Quantifying the Economic Impact of an EU-US Agreement on Conformity Assessment for Machinery and Electrical Equipment
3.2.1 Scenarios
The reviewed empirical studies provide valuable insights into the potential range of impacts from an EU-US agreement on conformity assessment in the sectors of machinery and electrical equipment. Drawing on this assessment[10], our study develops two distinct scenarios to estimate the potential economic effects of such an agreement. The first scenario, which it is considered a conservative or lower-bound estimate, suggests that the agreement on conformity assessment could result in a 2 percent reduction in bilateral trade costs for firms in both the EU and the US. The second scenario, representing a more optimistic or upper-bound estimate, posits that this agreement might lead to a reduction of up to 6 percent in bilateral trade costs.
Table 4: Economic scenarios for an EU-US agreement on conformity assessment for machinery and electrical equipment
3.2.2 Computable General Equilibrium (CGE) Modeling
The economic effect of an agreement on conformity assessment between the EU and the US for machinery and electrical equipment is conducted using Computable General Equilibrium (CGE) modeling. CGE models integrate economic theory and empirical data, enabling the estimation of the economic impacts of policy measures or external economic shocks. These models are widely employed by governments and research institutions to understand the potential impacts of policy changes.
CGE modeling operates by contrasting the state of an economy before and after the introduction of the policy change, known as the policy shock. The process begins by establishing a baseline where the economy is in a state of equilibrium. Against this backdrop, the policy shock – in our case, the implementation of an agreement on conformity assessment for machinery and electrical equipment between the EU and the US – is introduced. The CGE model then simulates the economy’s response to this intervention, tracking adjustments across various sectors and markets. As the model progresses, it traces the path of the economy as it moves towards a new equilibrium state.
This simulation is executed using a static comparative model: the standard GTAP Model developed by the Global Trade Analysis Project (GTAP) at Purdue University. This model is extensively used in studies assessing the impacts of trade policy. However, as with any applied economic model, the GTAP Model operates on a set of assumptions that simplify the complex policy framework governing real-world economies. Consequently, the results of these estimations should be viewed as indicative of the possible economic effects rather than as an economic forecast. A more detailed description of the CGE modeling approach is provided in Annex 3.
The reduction in trade costs resulting from an agreement on conformity assessment is conceptualized within the CGE framework as a decrease in import prices. The model simulates a reduction in import prices for machinery and electrical equipment that the EU and the US import from each other. Based on the previously outlined scenarios, this decrease is estimated at two levels: a conservative reduction of 2 percent and a more optimistic reduction of 6 percent. In addition to these scenarios, the model incorporates an alternative scenario where the EU-US agreement on conformity assessment is applied exclusively to environmental goods within the machinery and electrical equipment categories. In this scenario, it is projected that 14 percent of EU exports and 10 percent of US exports in machinery and electrical equipment would experience the proposed reductions in trade costs.
3.2.3 Results
The implementation of an agreement on conformity assessment in the machinery and electrical equipment sectors between the EU and the US is expected to yield a positive impact on the production and exports for both economies. This anticipated increase in exports can be broken down into two components: trade creation and trade diversion. Trade creation refers to the boost in commerce directly attributable to the reduced trade costs resulting from the agreement on conformity assessment. As the agreement facilitates more efficient and cost-effective trade between the EU and US, it increases commerce within these markets.
Conversely, the trade diversion effect arises because this reduction in trade costs is exclusive to EU and US exporters. It leads to a shift in import preferences away from third countries, as goods from these countries become comparatively more expensive in the EU and US markets. Given China’s significant role as a major exporter of machinery and electrical equipment to the EU and US shown in the previous chapter, the increased competitive advantage for EU and US exporters translates into reduced market share for Chinese exporters. Table 5 and 6 provide a detailed breakdown of these results.
Table 5: Economic effects of EU-US agreement on conformity assessment equal to a 2 percent reduction in trade costs, percentage change Source: Authors’ calculations.
Table 6: Economic effects of EU-US agreement on conformity assessment equal to a 6 percent reduction in trade costs, percentage change Source: Authors’ calculations.
The results of our economic analysis reveal distinct trends in response to the implementation of the EU-US agreement on conformity assessment. US firms are projected to experience a significant increase in exports to the EU across these sectors, surpassing the growth rate of EU exports to the US. This indicates a robust expansion of US firms’ presence in the EU under the new framework. In terms of industrial output, the EU is expected to see a more pronounced increase in the production of machinery, suggesting an improvement in this sector’s competitiveness and capacity. On the other hand, the US electrical equipment sector is expected to witness a larger percentage rise in production compared to its EU counterparts.
These positive developments in the EU and US industries have an inverse effect on China. The economic modeling estimates a decline in both exports and industrial output for Chinese firms in these sectors. This downturn reflects the trade diversion effect inherent in the EU-US agreement on conformity assessment, where the improved competitiveness and reduced trade barriers for EU and US firms come at the expense of non-member countries’ market share, particularly impacting China.
The percentage changes in trade, as detailed in Tables 5 and 6, can be directly applied to the values of EU and US imports of machinery, electrical equipment, and green goods, presented in the preceding chapter. Figures 7 and 8 represent these shifts in trade values under the two outlined scenarios. These figures illustrate, firstly, the increase in EU and US exports into each other’s markets, and secondly, the fall in Chinese exports to the EU and the US.
Under the first scenario, which assumes a 2 percent decrease in trade costs due to the implementation of the EU-US agreement on conformity assessment, EU and US exports of machinery and electrical equipment to each other’s markets are projected to rise by US$ 13.8 billion and US$ 11 billion, respectively. At the same time, this scenario quantifies a reduction in Chinese exports of these goods to the EU and the US by approximately US$ 6.5 billion.
In the second scenario, where the reduction in trade costs is estimated at 6 percent, the expected increase in trade is even more substantial. Under this scenario, the growth in EU and US exports of machinery and electrical equipment is estimated to reach US$ 42.2 billion and US$ 32.5 billion, respectively. Meanwhile, the decrease in Chinese exports to the EU and US markets under this scenario is projected to be around US$ 19.4 billion.
The benefits of a specialized agreement on conformity assessment focused on machinery and electrical equipment pivotal in addressing climate change also presents substantial advantages. An EU-US agreement on conformity assessment that covers green goods and clean technologies could increase exports between the EU and the US between US$ 3.1 to US$ 9.2 billion. Simultaneously, it would result in a decline in Chinese exports of these categories to the EU and US, estimated to be between US$ 0.8 billion and US$ 2.4 billion.
Figure 7: Change in EU, US and Chinese trade as a result of EU-US agreement on conformity assessment for machinery and electrical equipment resulting in a 2 percent reduction in EU-US bilateral trade costs Source: Authors’ calculations.
Figure 8: Change in EU, US and Chinese trade as a result of EU-US agreement on conformity assessment for machinery and electrical equipment resulting in a 6 percent reduction in EU-US bilateral trade costs Source: Authors’ calculations.
[1] Vancauteren, M. (2009). Trade effects of approaches intended to facilitate acceptance of results of conformity assessment: What is the evidence? OECD 2009 Workshop and Policy Dialogue on Technical Barriers to Trade: Promoting Good Practices in Support of Open Markets, OECD Headquarters.
[2] Technically referred to as the extensive margin.
[3] Technically referred to as the intensive margin.
[4] Jang, Y. J. (2018). How do mutual recognition agreements influence trade? Review of Development Economic, 22(3), 95–114. https://doi.org/10.1111/rode.12400
[5] Francois, J., Berden, K., Tamminen, S., Thelle, M., & Wymenga, P. (2013). Non-Tariff Measures in EU-US Trade and Investment: An Economic Analysis. IIDE Discussion Papers, 20090806. Institute for International and Development Economics.
[6] Office of Industries USITC Staff Writers (1998) Global assessment of standards barriers to trade in the information technology sector. US ITC Publication 3141. https://www.usitc.gov/publications/332/pub3141.pdf
[7] Schmidt, J., & Steingress, W. (2019). No double standards: Quantifying the impact of standard harmonization on trade. Bank of Canada Staff Working Paper, No. 2019-36, Bank of Canada, Ottawa. https://doi.org/10.34989/swp-2019-36
[8] Jang, Y. J. (see note: 16).
[9] Baller, S. (2007). Trade Effects of Regional Standards Liberalization: A Heterogeneous Firms Approach. World Bank Policy Research Working Paper No. 4124. https://papers.ssrn.com/abstract=960381
[10] Berden et al. (2009) suggest a potential increase in costs as a result of differences in standards and norms between the EU and the US in the electrical machinery sector of 6.5 percent. Moreover, Schmidt & Steingress (2019) estimated that the impact of trade as a result of the harmonization of standards is equivalent to a tariff reduction of 2.1 percentage points.
4. Policy Recommendation: Extending the EU-US 1998 MRA to Machinery and Electrical Equipment
In 1998, the EU and the US established an MRA on conformity assessment covering sectors such as telecommunications equipment, pharmaceutical products, and medical devices[1]. Under this agreement, conformity assessment bodies accredited and supervised within either the EU or the US were authorized to certify compliance with the regulatory requirements of both economies[2]. Over time, this agreement has evolved integrating additional conformity assessment bodies, products, and procedures[3].
With the recent EU-US TTC, there is renewed vigor for the EU and the US to deliver a concrete output that serves the objectives of both regions. An extension of the EU-US agreement on conformity assessment could be the perfect solution. The EU and the US can extend the scope of the 1998 EU-US MRA to include the machinery and electrical equipment sectors. This extension could be realized by adding a sectoral annex to the agreement. This annex could include the complete product category list for machinery and electrical equipment, classified under HS codes 84 and 85, many of which are often used as inputs for products deemed strategic for both the EU and the US, or specifically focus on those products within these categories that are deemed relevant for the energy transition and fall under the category of green goods.
There are multiple reasons why an agreement on conformity assessment for machinery and electrical equipment will benefit the EU and the US. These benefits can be categorized into three key themes: (i) increasing transatlantic trade; (ii) reducing reliance on China; and (iii) lowering the cost of the energy transition.
Increasing Transatlantic Trade
Non-tariff barriers (NTBs) have emerged as the most substantial barrier to transatlantic trade. In 2019, the trade-weighted average import tariffs were relatively low, standing at 2.4 percent for the US and 2.9 percent for the EU[4]. However, in the sector of electrical machinery, NTBs for both the EU and the US were estimated to represent an equivalent of 6.5 percent in trade costs (Berden et at. 2009).
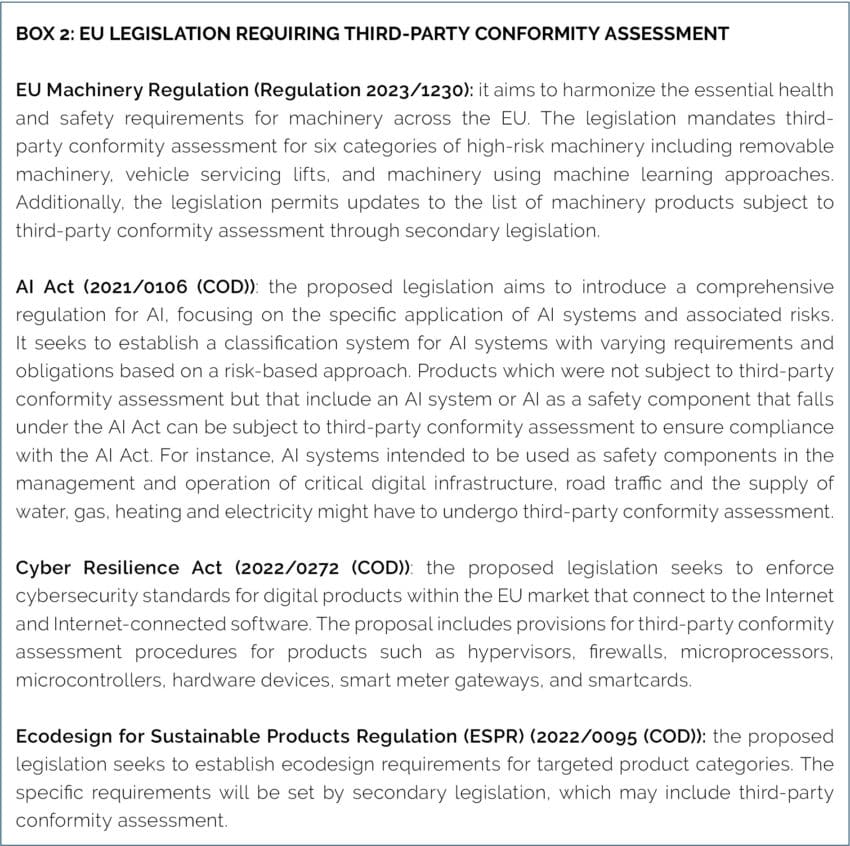
As explained in chapter three, conformity assessment is a type of NTB. EU businesses have frequently voiced concerns about the burdens imposed by conformity assessment. These concerns extend beyond the direct cost of the service itself to the limited testing capacity in both the EU and the US, which results in prolonged waiting periods for obtaining necessary conformity assessments[5]. While US companies may not currently express similar levels of concern, the landscape is likely to evolve. As more European regulations begin to mandate third-party conformity assessments (as detailed in Box 2), US firms will increasingly encounter these challenges when exporting to the EU market. Therefore, while the immediate benefits of an agreement on conformity assessment for machinery and electrical equipment may be more pronounced for EU firms, it is anticipated that US firms will progressively reap the advantages of this agreement in future exports to the EU.
It is also important to recognize that while an agreement on conformity assessment is anticipated to reduce the costs associated with these processes, it will not eliminate the need for them. The aim of the agreement is to streamline compliance for EU and US firms with the regulatory requirements in their respective export markets. In the past, EU-US economic relations have encountered challenges, often due to the attempts by each party to impose their regulatory frameworks on the other, hindering the development of trade-enhancing agreements. In contrast, the proposed agreement on conformity assessment is designed to reduce regulatory compliance costs without changing product regulations on either side of the Atlantic.
While the cost savings achieved through reduced duplication, more efficient processes, and expedited market access may seem modest in relation to the total cost of a product, their significance is magnified when viewed in the context of the vast scale of EU-US trade in the machinery and electrical equipment sectors. As detailed in chapter three, the implementation of the EU-US agreement on conformity assessment in these sectors has the potential to increase US exports to the EU by between US$ 11 billion and US$ 32.5 billion. Similarly, EU exports to the US are anticipated to grow by between US$ 13.8 billion and US$ 42.2 billion.
The surge in exports in absolute value is projected to be higher for the EU than for the US because European firms export larger volumes of machinery and electrical equipment to the US than the other way around. However, it is important to note that US exporters are expected to experience a higher percentage increase in their exports to the EU than EU exporters to the US (see Table 5 and 6). The reduction in trade costs facilitated by the agreement on conformity assessment is particularly beneficial to US firms that have witnessed a decline in both absolute export values and market share in the EU market (see Figure 3 and Figure 4). The agreement, by lowering trade barriers, offers an opportunity for these US firms to reverse this trend and enhance their competitive position in the EU market. Moreover, as outlined above and in Box 2, US firms will increasingly encounter requirements for third-party conformity assessments on the European market. Hence the long-term benefits of an extended agreement on conformity assessment will likely be even greater for US firms.
Reducing Reliance on China
The EU and the US have been actively developing policies aimed at identifying and mitigating their dependencies on imports from China, particularly in areas of strategic importance involving certain goods and technologies. For instance, the EU has identified dependencies in key technologies such as wind generators, photovoltaics, and robotics. These technologies rely on components sourced from the machinery and electrical equipment sector[6]. Notably, in 2022, Chinese firms accounted for almost half of the EU’s imports in the electrical equipment sector. Similarly, the US introduced the Inflation Reduction Act in 2022. This legislation aims to decarbonize the US economy and re-shore supply chains of critical minerals, reducing the country’s reliance on Chinese imports[7].
Given China’s status as the largest supplier of machinery and electrical equipment to both the EU and the US (see Table 1 and Table 2), the implementation of the EU-US agreement on conformity assessment is poised to have significant repercussions for Chinese firms. Specifically, the reduction in bilateral import costs for EU and US firms in these sectors, facilitated by the agreement, is projected to decrease Chinese exports to the EU and the US by between US$ 6.5 billion and US$ 19.4 billion.
Importantly, this policy shift achieves a reduction in dependency on Chinese imports without resorting to public subsidies or imposing any financial burden on taxpayers. This aspect underscores the role of the agreement on conformity assessment as a pro-competitive measure, enhancing economic security and resilience by leveraging market-driven competition.
Lowering the Costs of the Energy Transition
The EU and the US are confronted with the significant challenge of decarbonizing their economies. To achieve this goal, it is vital for both countries to minimize the costs of green investments and accelerate their deployment. The EU-US agreement on conformity assessment for machinery and electrical equipment creates a transatlantic market for conformity assessment on green goods and clean technologies that reduces the costs associated with bringing these goods and technologies to market.
The potential economic and resilience effects of an EU-US agreement on conformity assessment for green goods and clean technologies are substantial: ranging between US$ 3.1 billion and US$ 9.2 billion on higher EU and US bilateral exports while reducing China’s exports to the EU and the US by between US$ 0.8 billion and US$ 2.4 billion. However, broadening the scope of the agreement to include the entirety of machinery and electrical equipment sectors, rather than just a subset, would significantly amplify the trade effects. Such an approach is estimated to yield trade impacts that are much larger than those realized under the more limited agreement on conformity assessment for green goods and clean technologies .
Our analysis serves as a motivation to adopt a more ambitious approach in selecting green goods and technologies for inclusion in an EU-US agreement on conformity assessment. While the definition of green goods employed in this paper was relatively conservative, as outlined in Box 1, a broader perspective reveals that many products within machinery and electrical equipment contribute to green initiatives by serving as essential inputs in the energy transition. Consequently, the substantial increase in exports of machinery and electrical equipment offers a glimpse into the potential benefits of a comprehensive EU-US agreement on conformity assessment for green goods and clean technologies.
Crucially, an EU-US agreement on conformity assessment for machinery and electrical equipment does not have to be a static agreement. It has the potential to be a dynamic instrument that evolves to meet future needs. As presented in Box 2, an increasing number of green goods and technologies require third-party testing. Having an existing agreement on conformity assessment for green goods and clean technologies would establish a proactive framework to accommodate future regulatory and economic developments on climate and the environment on both sides of the Atlantic.
[1] Agreement on mutual recognition between the European Community and the United States of America. Source: https://eur-lex.europa.eu/legal-content/EN/TXT/PDF/?uri=CELEX:01999A0204(01)-20171124
[2] The 1998 EU-US MRA led to the creation of a transatlantic marketplace for testing and certification for the products included under the agreement. Currently, there are 46 US CABs accredited for the EU market and 74 EU CABs for the US market. Source: Agreement on mutual recognition between the European Community and the United States of America. https://eur-lex.europa.eu/legal-content/EN/TXT/PDF/?uri=CELEX:01999A0204(01)-20171124
[3] Ibid
[4] Akhatar, I. S. et al, (2022, May 6). U.S.-EU Trade Relations. Congressional Research Service. https://sgp.fas.org/crs/row/R47095.pdf
[5] Tucci, A., and Loridan, M. (compilers) (2016). Navigating Non-Tariff Measures: Insights From A Business Survey in the European Union. ITC. https://intracen.org/resources/publications/navigating-non-tariff-measuresinsights-from-a-business-survey-in-the
[6] Bobba, S., C et al. (2020, September 2) Critical Raw Materials for Strategic Technologies and Sectors in the EU – A Foresight Study. https://rmis.jrc.ec.europa.eu/uploads/CRMs_for_Strategic_Technologies_and_Sectors_in_the_EU_2020.pdf
[7] Daniel Garrahan(ed). (2023, September 6). How Biden’s Inflation Reduction Act changed the world. FT Film. Financial Times, Retrieved from https://www.ft.com/video/9f002882-c330-4c7f-88c0-4cc5112125a2
References
Aguiar, A., Chepeliev, M., Corong, E., & van der Mensbrugghe, D. (2022). The global trade analysis project (GTAP) database: Version 11. Journal of Global Economic Analysis, 7(2).
Akhatar, I. S., Fefer, F. R., Johnson, R. And Schwarzenberg, B. A., (2022, May 6). U.S.-EU Trade Relations. Congressional Research Service. https://sgp.fas.org/crs/row/R47095.pdf
Agreement on mutual recognition in relation to conformity assessment between the European Community and New Zealand (signed February 23, 2012; entry into force November 28, 2012). https://eur-lex.europa.eu/EN/legal-content/summary/eu-new-zealand-mutual-recognition-agreement-mra.html
Agreement on mutual recognition between the European Community and the United States of America (signed December 12, 1998). https://eur-lex.europa.eu/legal-content/EN/TXT/PDF/?uri=CELEX:01999A0204(01)-20171124 [Old Agreement]
Agreement on mutual recognition between the European Community and the United States of America. (2017) OJ L 31, 4.2.1999. [Consolidated Version – Latest]. https://eur-lex.europa.eu/legal-content/EN/TXT/PDF/?uri=CELEX:01999A0204(01)-20171124
Baller, S. (2007). Trade Effects of Regional Standards Liberalization: A Heterogeneous Firms Approach. World Bank Policy Research Working Paper No. 4124. https://papers.ssrn.com/abstract=960381
Bernard, A. B., J. B. Jensen, S. J. Redding, and P. K. Schott (2009) “The Margins of U.S. Trade,” American Economic Review, 99(2), 487–493, Papers and Proceeding
Bobba, S., C Carrara, S., Huisman, J., and Mathieux, F., Pavel, C. (2020)) Critical Raw Materials for Strategic Technologies and Sectors in the EU – A Foresight Study. https://rmis.jrc.ec.europa.eu/uploads/CRMs_for_Strategic_Technologies_and_Sectors_in_the_EU_2020.pdf
Garrahan, D., (ed). (2023, September 6). How Biden’s Inflation Reduction Act changed the world | FT Film. Financial Times. Retrieved from https://www.ft.com/video/9f002882-c330-4c7f-88c0-4cc5112125a2
European Commission (2024). The EU-New Zealand trade agreement. Retrieved from: https://policy.trade.ec.europa.eu/eu-trade-relationships-country-and-region/countries-and-regions/new-zealand/eu-new-zealand-agreement_en
European Commission (2023) Regulation (EU) 2023/1230 Of The European Parliament And Of The Council of 14 June 2023 on machinery and repealing Directive 2006/42/EC of the European Parliament and of the Council and Council Directive 73/361/EEC. https://eur-lex.europa.eu/legal-content/EN/TXT/PDF/?uri=CELEX:32023R1230
European Commission (2021) Proposal For A Regulation Of The European Parliament And Of The Council Laying Down Harmonised Rules On Artificial Intelligence (Artificial Intelligence Act) And Amending Certain Union Legislative Acts. https://eur-lex.europa.eu/resource.html?uri=cellar:e0649735-a372-11eb-9585-01aa75ed71a1.0001.02/DOC_1&format=PDF
European Commission (2022) Proposal For A Regulation Of The European Parliament And Of The Council On Horizontal Cybersecurity Requirements For Products With Digital Elements And Amending Regulation (EU) 2019/1020. https://eur-lex.europa.eu/resource.html?uri=cellar:864f472b-34e9-11ed-9c68-01aa75ed71a1.0001.02/DOC_1&format=PDF
European Commission (2022) Proposal For A Regulation Of The European Parliament And Of The Council Establishing A Framework For Setting Ecodesign Requirements For Sustainable Products And Repealing Directive 2009/125/EC. https://eur-lex.europa.eu/resource.html?uri=cellar:bb8539b7-b1b5-11ec-9d96-01aa75ed71a1.0001.02/DOC_1&format=PDF
Francois, J., Berden, K., Tamminen, S., Thelle, M., & Wymenga, P. (2013). Non-Tariff Measures in EU-US Trade and Investment: An Economic Analysis. IIDE Discussion Papers, 20090806. Institute for International and Development Economics
Jang, Y. J. (2018). How do mutual recognition agreements influence trade? Review of Development Economic, 22(3), 95–114. https://doi.org/10.1111/rode.12400
Office of Industries USITC Staff Writers (1998) Global assessment of standards barriers to trade in the information technology sector. US ITC Publication 3141. https://www.usitc.gov/publications/332/pub3141.pdf
Schmidt, J., & Steingress, W. (2019). No double standards: Quantifying the impact of standard harmonization on trade. Bank of Canada Staff Working Paper, No. 2019-36, Bank of Canada, Ottawa. https://doi.org/10.34989/swp-2019-36
Summaries of EU legislation (n.d.) EUR-Lex. https://eur-lex.europa.eu/EN/legal-content/summary/eu-united-states-of-america-mutual-recognition-agreement-mra.html#keyterm_E0002
Tucci, A., and Loridan, M. (compilers) (2016). Navigating Non-Tariff Measures: Insights From A Business Survey in the European Union. ITC. https://intracen.org/resources/publications/navigating-non-tariff-measuresinsights-from-a-business-survey-in-the
USTR (2024). U.S.-South Korea Free Trade Agreement. Retrieved from https://ustr.gov/trade-agreements/free-trade-agreements/korus-fta
Vancauteren, M. (2009). Trade effects of approaches intended to facilitate acceptance of results of conformity assessment: What is the evidence? OECD 2009 Workshop and Policy Dialogue on Technical Barriers to Trade: Promoting Good Practices in Support of Open Markets, OECD Headquarters.
Annex
Annex 1: List of Trade Codes
Table 1: List of Green Goods belonging to Machinery (Chapter 84) and Electrical Equipment (Chapter 85) Table 2: List of 4-Digit Goods belonging to Machinery (Chapter 84) and Electrical Equipment (Chapter 85)
Annex 2: EU, US, and China Market Share on Machinery, Electrical Equipment and Green Goods Belonging to Machinery and Electrical Equipment
Figure 1: US, China, and other countries’ share of EU imports of machinery (share, 2002-2022) Source: UN Comtrade, author’s calculation.
Figure 2: US, China, and other countries’ share of EU imports of electrical equipment (share, 2002-2022) Source: UN Comtrade, author’s calculation
Figure 3: US, China, and other countries’ share of EU imports of green goods belonging to machinery and electrical equipment (share, 2002-2022)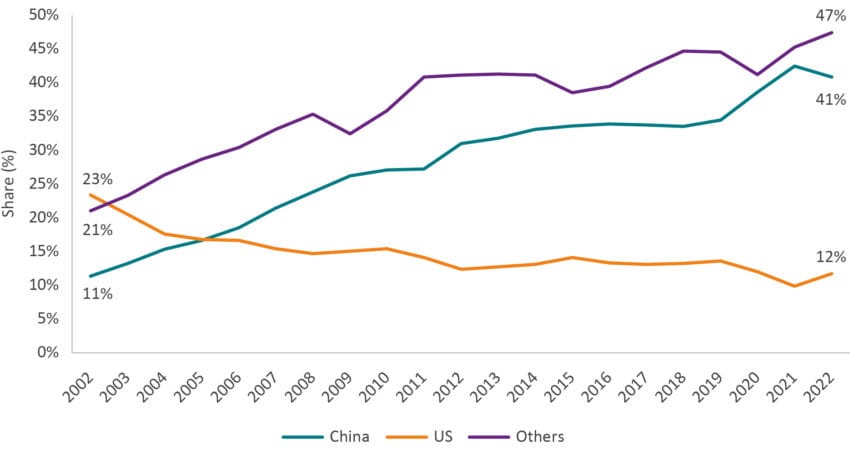 Source: UN Comtrade, author’s calculation
Figure 4: EU, China, and other countries’ share of US imports of machinery (share, 2002-2022) Source: UN Comtrade, author’s calculation
Figure 5: EU, China, and other countries’ share of US imports of electrical equipment (share, 2002-2022) Source: UN Comtrade, author’s calculation
Figure 6: EU, China, and other countries’ share of US imports of green goods belonging to machinery and electrical equipment (share, 2002-2022)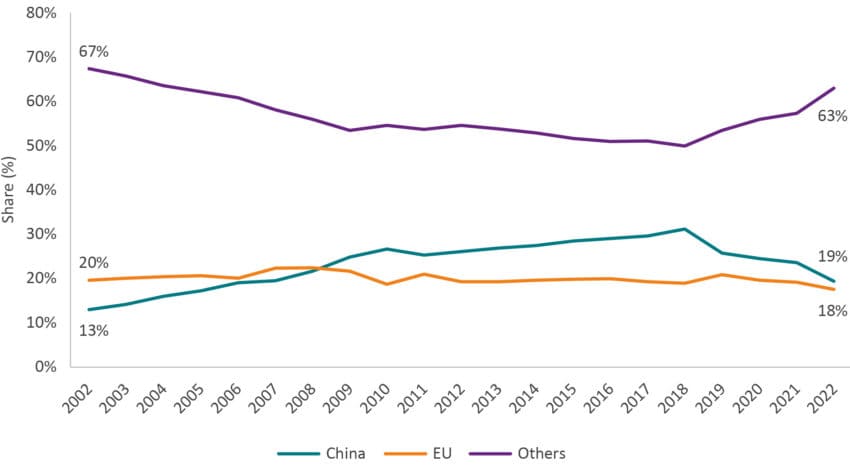 Source: UN Comtrade, author’s calculation
Annex 3: Description of the CGE Model
CGE model simulations are conducted on the basis of the standard model by the Global Trade Analysis Project (GTAP) at the University of Purdue. CGE models are frequently used in economic impact assessments to estimate the magnitude of economic feedback effects, including structural changes in countries’ international trade profiles for goods and services (see, e.g., European Commission).
The model applied in this analysis is static-comparative and has been applied frequently in studies on the impacts of various trade policy measures such as tariffs and non-tariff trade barriers (NTBs). We apply a multi-regional and multi-sector model, characterized by perfect competition, constant returns to scale and a set of fixed Armington elasticities. The modeling is conducted on the basis of the default macro-closure, which applies a savings-driven model, i.e., the savings rate is exogenous, and the investment rate will adjust.
As concerns the economic base data on which we run the simulations, we apply the most up to date GTAP 11 database released in 2023. The database contains global trade data for 2004, 2007, 2011, 2014 and 2017 as reference years based on input output tables and recorded trade protection data.[1] The database covers 141 countries and 19 aggregate regions of the world for each reference year. The sectoral coverage includes a total of 65 sectors. The GTAP 11 dataset on the global economy was extrapolated to reflect the “best estimate” of the global economy today.
In relation to the regional set-up, we distinguish between the EU27, the US, China and the rest of the world. The model’s sector aggregation is outlined in Table 1.
Table 1: GTAP Sector Aggregation Source: GTAP, ECIPE.
The shocks used for the model simulation where AMS shocks to account for the economic impact of a change in technology availability in the sectors that the modeling focuses on in each of the different regions. When AMS is shocked by 20 percent, then 20 percent more of the product becomes available to domestic consumers — given the same level of exports from the source country. To ensure that producers still receive the same revenue from their sales, effective import prices fall by 20 percent.
Key assumptions of the CGE model
CGE simulation results are sensitive to various features of the model and assumptions underlying of the modeling approach, including the quality of the underlying trade and production data, the underlying closure (the parameterization of casual economic relationships), and the actual quantification of economic shocks (e.g., the level of numerical tariff equivalents of non-tariff trade barriers). The outcomes in terms of changes in economic variables also depend on the set-up of the model and the assumptions underlying the modeling approach which translates real world legal obligations to quantitative inputs for the model. These include assumptions about the nature of competition, substitutability of goods and services, trade elasticities, scale economies, firm heterogeneity, and productivity, which are frequently subject to criticism in academic and policy circles.
Like any applied economic model, the model used in this analysis is based on several assumptions which simplify complex behavioral economic relationships and the policy framework governing the reality of domestic production and international commerce. The results of the estimations therefore only have indicative character as it is not possible to forecast the precise economic impacts of regulatory changes on macro-economic variables, mainly due to lack of empirical data, the influence of a many different policy and non-policy factors and causal relationships that change over time (Lucas’ critique).[2]
The applied model is comparative-static, i.e., the simulation results reflect two equilibria at different points in time.[3] As concerns the timeframe for the economic impacts to evolve, the time horizon generally depends on the nature of the simulated policy shock and a reasonable assessment of agents’ behavioral responses, i.e., adjustments in consumption, production, trade, and investment. The timeframe also depends on the nature of the policy change and is generally sensitive to industry characteristics. The timeframe for economic impacts to unfold thus needs to be assessed and discussed on a sector-by-sector basis. In addition, the assumption of full factor mobility and full employment of factors of production, i.e., all factors of production including labour will adjust until they are fully absorbed by other sectors after the policy changes, has critical implications for the modeling and the assessment of the time horizon within which policy-induced economic impacts will unfold
[1] It is built on the most reliable international data sources (including Eurostat data for EU countries) and undergoes constant scrutiny by the different stakeholders and users such as the European Commission, the World Bank, OECD, IMF, WTO, United Nations, FAO, etc.
[2] The Lucas critique is a criticism of econometric policy assessment approaches that fail to recognize that optimal decision rules of economic agents vary systematically with changes in regulation. It criticizes using estimated statistical relationships from past data to forecast the effects of adopting a new policy, because the estimated regression coefficients are not invariant but will change along with agents’ decision rules in response to a new policy context.
[3] Most CGE models are “comparative-static” by default, i.e., the results of the modeling to not have a preset time dimension indicating how long it would take the economy to adjust to a new equilibrium.