The Gini Trade Index: What Can We Learn from A New Trade Indicator?
Published By: Lucian Cernat
Subjects: European Union
Summary
This Policy Brief introduces the Gini Trade Index (GTI) as a new trade synthetic key performance indicator capable of capturing the different distribution of trade values across firm characteristics and across countries. The new indicator replicates the well-known features of the traditional Gini Index, a widely used metric for the skewness of several socioeconomic indicators, in particular income inequality. The Policy Brief calculates the Gini Trade Index for all EU member states and contrasts the case of Slovakia and Cyprus, the EU countries situated at the opposite ends of the Gini Trade Index. The paper finds that the GTI has increased over time in most EU countries and offers a tentative range of optimal GTI values. The final section offers several examples of trade policy initiatives that can reduce trade concentration and lead to greater participation of small and medium enterprises in global trade.
* Disclaimer: the views expressed herein are those of the author and do not represent an official position of the European Commission. The author would like to thank Carmen Diaz-Mora, Oscar Guinea and Hein Roelfsema for their useful suggestions and feedback.
1. Introduction
Few heads of states take a personal interest in how many small and medium enterprises (SMEs) engage in exporting activities. Yet, President Emmanuel Macron does. In November 2023, he lamented that French SMEs account for a low share of total French exports, lower than the German and Italian ones. On that occasion, he used statistics which indicate an untapped export potential for French SMEs and advocated in favour of several initiatives aimed at increasing the number of French exporting firms (Normand, 2023). For instance, under the new initiative dubbed “Osez l’export” (“Dare to export”), the French government intends to increase the number of French exporting firms from 150’000 to 200’000 by 2030 (CCI, 2023).
While heads of states do not usually back up their statements with firm-level trade statistics, many other countries have dedicated trade policies to support the participation of their SMEs in global supply chains. For instance, the Biden Administration has increased its support to the export promotion programmes administered by the Small Business Administration in 2023 (US SBA, 2023). South Korea’s new Minister for Small Enterprises and Startups has announced new plans for Korean exporting SMEs (MSS, 2024) and a commitment to support all the existing 90’000 Korean exporting firms to expand their export activities (Korea Times, 2024).
Such trade promotion initiatives in favour of SMEs are easily understood when looking at the current global context. In its latest World Economic Outlook, the IMF predicted that world trade growth slowed down sharply, from 5.1 % in 2022 to 0.9 % in 2023 (IMF, 2023). Current forecasts predict a higher, but fairly modest, rebound in world trade in 2024. Many reasons were behind this sudden drop in global trade. Growing geopolitical tensions, global fragmentation, wars and national disasters were all to blame. Trade policy played a role too. According to the IMF report, in 2022 alone, countries around the world imposed almost 3’000 new restrictions on trade. Hence, the global trade slowdown and growing protectionism worldwide is a matter of concern for policy makers, as trade is a key ingredient for macroeconomic stability and prosperity.
However, there is also a microeconomic rationale for such policies aimed at increasing the participation of SMEs in global trade. This rationale becomes apparent when looking at the firm-level structure of global trade. In the words of a renowned French economist and his co-authors: “nations do not trade, firms do” (Mayer and Ottaviano, 2007). And not just any firms. Ample empirical evidence suggests that firms engaged in trade stand out, in many ways. Exporting firms are more productive than non-exporters (ISGEP, 2008), more innovative (Tomàs-Porres et al., 2023) and pay higher wages (Rueda-Cantuche et al., 2019). For instance, French and Italian exporters are 20% more productive than non-exporters (ECB, 2015) and export productivity premia are also found for firms engaged in trade from developing countries (Amiti and Konings, 2007; Van Biesebroeck, 2005).
Becoming an exporter is not easy. In any given country, only a small proportion of firms engage directly in international trade. As a result, global trade tends to be very skewed, with a small number of large firms accounting for a disproportionate share of total trade values. In the United States, the top 1% of trading firms (exporters and importers) account for over 80% of the value of total trade (Bernard et al., 2007). The top 1% of exporters account for more than 50% of Italian exports (Marin et al., 2015) and almost 60% of Portuguese exports (Cabral et al., 2020). Freund and Pierola (2012) also found a skewed trade distribution across a large sample of developing countries.
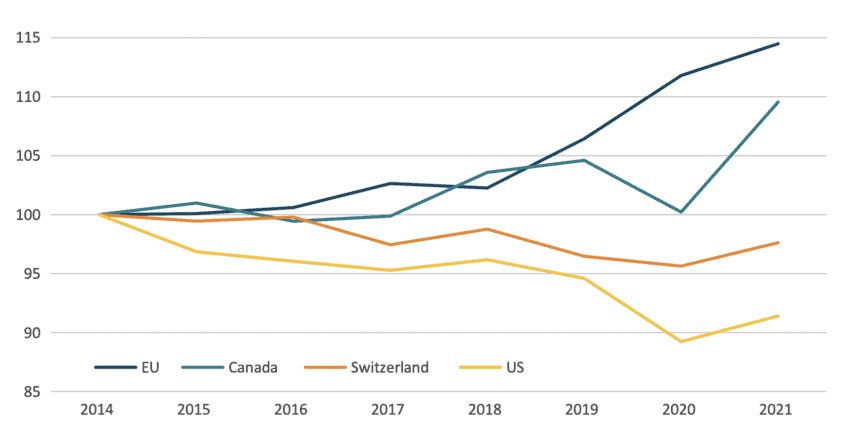
Therefore, one can learn a lot about global trade dynamics by looking at the firm characteristics and trade demographics. When going beyond macro to firm-level trade realities, policy makers need different “Trade Policy 2.0” key performance indicators (KPIs) (Cernat, 2014). These indicators are well-grounded in economic analysis (Bernard et al., 2007). Hence, in order to understand national comparative advantage and measure the impact of trade policy on competitiveness, we need new KPIs that put the firm at the centre of trade policy analysis. Seen from this perspective, Cernat and Guinea (2023) argue that it makes sense to focus on the number of exporting firms as part of trade policy KPIs, not just on trade values. Thus, the simplest “Trade Policy 2.0” indicator would be the number of exporting firms, a KPI that can be easily derived from official statistics. For instance, Figure 1 shows the evolution of the number of exporters in several OECD economies.
Figure 1: Number of exporting firms, 2014-2021 Source: Author’s calculations based on the OECD Trade by Enterprise Characteristics database, StatCan and US Census. Data indexed on 2014, as base year (2014=100).
Simple indicators are powerful: the number of EU exporters increased quite steadily over time, reaching over 736’000 exporting firms in 2021, the vast majority of which are small and medium enterprises (SMEs). As a point of comparison, over the same period, the number of Canadian exporters has also increased while the number of US and Swiss exporters has declined over time. Why focus on such firm-level trade KPIs? The answer is simple: firm characteristics may impact considerably trade performance. While small firms are not always the most productive firms in an economy, exposure to foreign markets has positive effects on small firm productivity, an effect known as “learning-by-exporting” (Atkin et al., 2017). Hence, a growing number of EU firms participating in global trade as Figure 1 indicates, would be good news.
However, as previously indicated, there is also strong evidence that export performance around the world is an activity dominated by “super-exporters”. Looking at the number of exporting firms is useful but not enough to understand the micro-foundations of a country’s trade performance. As Andersson and Lööf (2009) discovered, being an exporter is not enough for a firm to derive the increased productivity performance expected from participation in international trade. What makes the difference is the ability to reach a certain critical mass, in terms of export intensity and persistence over time. Therefore, the distribution of trade flows across the firms’ demographics becomes an important metric.
Moreover, a high concentration of export value generated by a small number of firms renders countries vulnerable to external shocks affecting those “super-exporters”. If a handful of exporters generate a disproportionate share of total exports concentrated in a few products, then overall export performance may be vulnerable to “black swan” events. Resilient and diversified trade and supply chains are also needed for macroeconomic stability (Adriantomanga et al. 2023).
2. A New Trade Metric: The Gini Trade Index
We therefore need more elaborate indicators that could measure the skewness of trade, just as we measure the skewness of various socioeconomic indicators (e.g. wealth and income distribution, access to land or education, consumption patterns, or even life expectancy). The best-known indicator is the Gini index. Invented by the Italian statistician Corrado Gini, and named after him, the Gini index ranges from 0 (which represents a perfect equality) to 1 (or 100, depending on scale) to indicate perfect inequality. Applying the Gini index to measure a country’s trade structure leads us to a new, more elaborate indicator of firm-level trade participation – the Gini Trade Index (GTI). A country where all exporters would export perfectly equal values would have a GTI equal to 0. In contrast, a country where the entire export value would be generated by a single exporter would have a GTI value of 100.
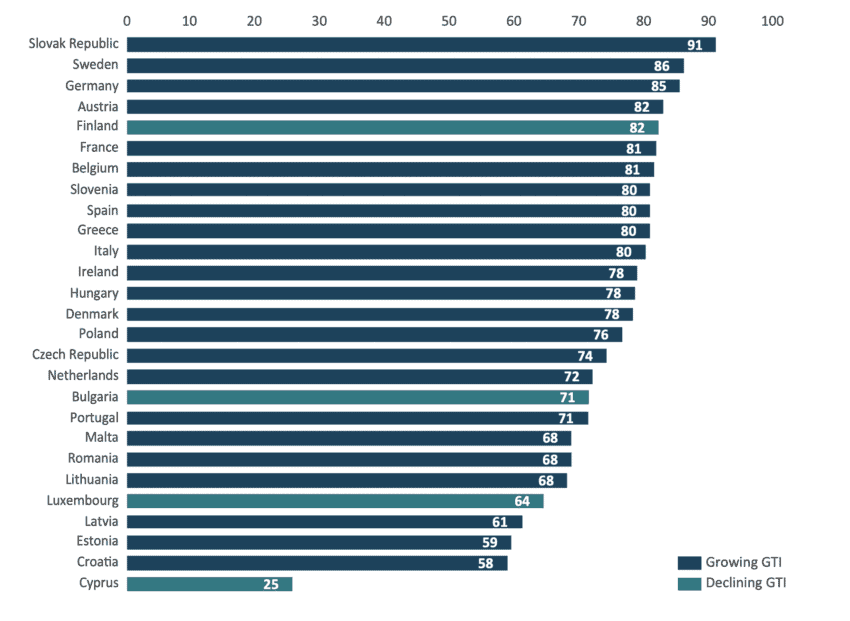
Just like the traditional Gini inequality index, the Gini Trade Index measures the skewness in trade, based on the numbers of exporters and their share in export values. Ideally, the GTI would be measured on firm-level trade statistics. Unfortunately, that kind of data is not readily available across all EU countries. A second-best proxy for the data needed to measure the GTI is the Eurostat Trade by Enterprise Characteristics (TEC) database (Eurostat, 2023). The TEC database indicates the number of micro (less than 10 employees), small (less than 50 employees), medium (less than 250 employees) and large firms (more than 250 employees) engaged in trade and the trade values exported by each category of firms. The Gini Trade Index can be calculated across these four size classes of exporters from micro firms with less than 10 employees, all the way to “super-exporters” (large firms). Figure 2 illustrates the Gini Trade Index for several EU countries in 2020 and compares it with 2010 values. The relatively high (and growing over time) GTI values confirm that trade performance is very skewed towards larger firms. The higher the GTI, the more unequal the export value is distributed across exporters of that country. In Cyprus, the 2020 GTI was 25 (low inequality) whereas in Slovakia it was 91 (high inequality). Hence, Slovakia has a far more unequal export distribution than Cyprus. The difference between “high-value” exporters and the “small-value” exporters in Slovakia is bigger than in any other EU member state.
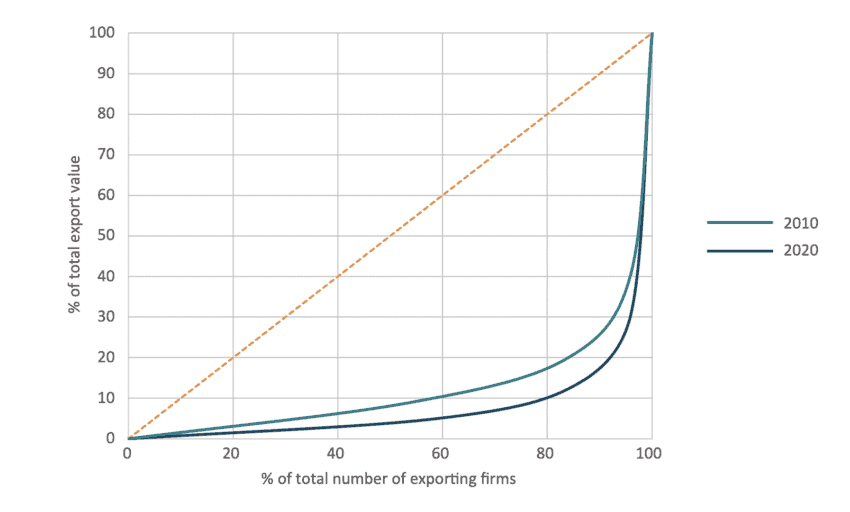
The GTI is not only very diverse across EU Member States but has also evolved across time differently. Since 2010, the GTI has increased in virtually all EU Member States, except Finland, Bulgaria, Cyprus and Luxembourg. This increase in the skewness of EU trade values towards larger firms between 2010 and 2020 led to an overall increase in the EU-wide GTI from 73 in 2010 to 82 in 2020, as can be seen in the trade Lorenz curves depicted in Figure 3. When looking at individual EU Member States, they tend to have a very complex distribution across the GTI value spectrum. Several Baltic countries and Luxembourg have relatively low trade inequality (with GTI values below 70) whereas Romania, Bulgaria, Portugal and the Netherlands have GTI values clustered around 70. Twelve EU Member States (among them large Member States like Germany, France, Italy, Spain, but also smaller ones like Greece, Slovenia or Denmark) have fairly high GTI values, equal or above 80. Yet, Slovakia stands out as the only EU country with a GTI above 90.
This indicates that the participation of micro and small EU exporters in global trade remains uneven, across EU Member States. However, the overall demographics are encouraging: as shown in Figure 1, the increase in EU exporting firms (which are mostly SMEs) indicates that small firms remain globally competitive. At the same time, the Gini Trade Index shows that there has not been a similar increase in their export values.
Figure 2: The Gini Trade Index (GTI)
Figure 3: The evolution of the EU GINI Trade Index (GTI): 2010-2020 Source: Authors’ calculations based on the Eurostat TEC database
3. The Ideal GTI: A Tale of Two Countries
To illustrate the additional insights that the GTI can offer to trade policy analysis, let us focus on the two countries situated at the end of the GTI spectrum: Slovakia and Cyprus. The explanation for the Slovak high GTI value is quite simple: cars. Slovakia has a special relationship with car production. Slovakia has a long industrial tradition with its well-known Škoda brand, one of the largest European industrial conglomerates of the 20th century, founded by the Czech engineer Emil Škoda in 1859. Nowadays, Slovakia is a central hub for car production in Europe, with major European car producers having a strong presence in the country. Take Volkswagen, for instance. Volkswagen Slovakia tops the chart of Slovak exporters. Out of its 9 billion euros worth of car production in Slovakia, Volkswagen exported more than 99%, with China and the US accounting for around 40% of exports (Volkswagen, 2018).
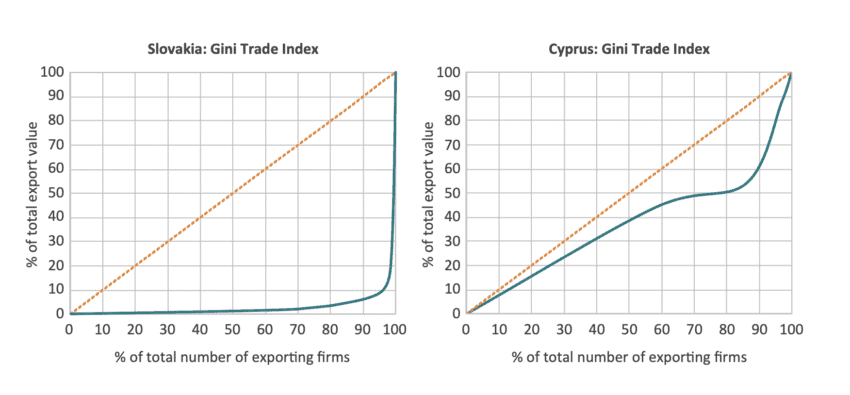
Figure 4: Comparing the Gini Trade Index: Slovakia vs Cyprus Source: Author’s calculations based on the Eurostat TEC database, latest available data.
This means that one single company (Volkswagen Slovakia) generates probably around one third of total Slovak exports to the rest of the world, all sectors combined. If you drive a Skoda, Seat, Volkswagen, Audi or Porsche, chances are your car was assembled in Slovakia. Even if your car is not produced in Slovakia, there are big chances that the gearbox and many other car parts are sourced from Slovakia. This is clearly illustrated in the shape of the Lorenz curve for Slovakia (Figure 4), indicating a very skewed distribution of export values across firm size categories towards large exporters.
At the same time, both Slovakia and Cyprus have many exporting SMEs. In fact, both countries have a similar share of SMEs in the total number of exporting firms (around 97%). But Slovakia has the lowest share of SMEs in the value of exports (18%) across all EU Member States, compared with 91% in Cyprus, the EU member states with the lowest GTI (the most equal distribution of export value across its exporters). This stark difference is also visible in Figure 4, with Cyprus having an export distribution Lorenz curve much closer to the diagonal than Slovakia. So, when looking at such firm-level KPIs, the differences in GTI values start to make a lot of sense.
This raises an important question: should countries aim to have the highest GTI possible, like Slovakia? Or should everyone strive to have the lowest GTI, like Cyprus?
There is no simple answer to this question. But one thing is clear: putting all eggs in one single basket may be a risky trade strategy. Relying on a “single goose with golden eggs” is, especially nowadays, not necessarily a good idea. In its 2023 Country Report, the European Commission (2023a) argued that raising long-term productivity growth and industrial competitiveness in Slovakia requires a more diversified economy. Slovakia has the EU’s highest share of direct automotive employment in total manufacturing (over 16% of total manufacturing workforce). These days, the automotive sector is facing significant disruptive challenges globally, including in terms of increased robotisation and automation, a shift towards Industry 4.0 and Mode 5 services (Cernat, 2021a) that require a new set of skills for 21st century automotive production. Being so dependent on one single industrial sector makes an economy more vulnerable to supply chain shocks and shortages. The number of Slovak firms facing disruptions in the form of materials shortages increased from 23% in 2021 to 32% in 2022, with the most significant impact in the automotive industry (European Commission, 2023a).
Having a very low GTI like Cyprus is probably not an ideal position either. Cyprus is a services-oriented economy, with one of the lowest numbers of exporting firms and a handful of products and export destinations accounting for more than half of Cyprus’ merchandise exports. Is there an ideal GTI value? Hard to say. But common sense and this anecdotal evidence would indicate that neither a too high, nor a too low GTI is ideal. Perhaps the ideal GTI values should be somewhere in the middle. Across all EU Member States the GTI simple average is 75. Knowing that some small Member States (like Cyprus) are GTI outliers, it would make sense to also calculate a GDP-weighted GTI average. The EU weighted average GTI was 80 in 2020. This suggests that most EU Member States find themselves in the optimal, middle-range of GTI values.
4. Making Sense Out of the Gini Trade Index: Policy Implications
The exact GTI value is of little importance without an understanding of its broader potential implications. The increase in export concentration is not an isolated phenomenon. It mirrors a trend of growing industry concentration across countries, more generally (Koltay et al., 2023). While this can be problematic for trade competition and economic dynamism, this is not true across the board. Some countries see a growing participation of SMEs, both in terms of numbers and their share in total trade values. Some SMEs of today may go global and become the unicorns of tomorrow (Cernat, 2021b). This is important for EU competitiveness and productivity. Trade participation goes hand in hand with productivity. And since some argue that Europe has a growth and productivity gap (Erixon et al., 2023), a robust trade participation by a growing number of small firms might help both export competitiveness and overall productivity.
The participation of SMEs in international trade has been already part of trade policy preoccupations. Many EU trade agreements include provisions in favour of SMEs, including by having dedicated SME chapters in Free Trade Agreements (FTAs). Apart from these dedicated chapters, many other FTA provisions are relevant for SMEs and could promote their export performance. Yet, FTAs are long and complex international treaties. A typical FTA has more than 1000 pages and many FTA provisions go beyond tariff elimination and are fairly complex, given the nature of technical issues addressed (e.g. intellectual property rights, technical barriers to trade, public procurement). Thus, if the GTI values would indicate an overly concentrated export structure and low SME participation in trade, there may be certain policy actions that could reverse such trends.
Making trade formalities and procedures easier to understand by SMEs saves them unnecessary costs and would allow them to tap into new markets. The newest trend in the “easification” of trade procedures is the creation of a digital “one-stop-shop”, where all trade procedures are explained in plain language based on algorithms and interactive interfaces (Cernat, 2021c). The EU has put in place a number of such tools under the EU “Access2Markets” online portal. In most cases, tariffs are no longer the biggest problem for exporting SMEs, at least in terms of knowledge gaps. The biggest hurdles for exporting SMEs remain non-tariff barriers, notably technical barriers to trade (e.g. testing requirements, product certification, etc.). The good news is that the Access2Market portal offers a set of simple tools to EU exporting SMEs, such as the recently launched #Access2Conformity (European Commission, 2023b).
Following a firm-level approach, the Gini Trade Index fits well with this new “Trade Policy 2.0” trend. Beyond Europe, the GTI may offer additional valuable insights to global policymakers. In the developing world, for instance, the participation of small firms in global supply chains is one of the surest ways to increase firm productivity, wages, and overall welfare. The GTI would be a good metric for such a purpose. The GTI might also be needed to understand services trade and the new realities of global e-commerce (Lopez-Gonzalez et al., 2023). The world is changing, and new trade realities require new trade indicators. Let’s put the Gini inside the trade bottle and ensure that we have the right metrics to measure the future benefits from trade.
References
Adriantomanga, Z., Bolhuis, M. A., Kakobyan, S. (2023) Global Supply Chain Disruptions: Challenges for Inflation and Monetary Policy in Sub-Saharan Africa, IMF Working Paper 2023/039, International Monetary Fund.
Amiti, M. and Konings, J. (2007).Trade Liberalization, Intermediate Inputs, and Productivity: Evidence from Indonesia. American Economic Review, 97 (5), 1611-1638.
Atkin, D., Khandelwal, A.K., Osman, A. (2017). Exporting and Firm Performance: Evidence from a Randomized Trial. The Quarterly Journal of Economics, 132 (2), 551–615.
Bernard, A., Bradford J., Redding, S. and Schott, P. (2007). Firms in International Trade, Journal of Economic Perspectives, vol.21:3, pp.105-130.
Cabral, S., Gouveia, C.M, Manteu, C. (2020). The granularity of Portuguese firm-level exports.Banco de Portugal Economic Studies, Lisbon.
Cernat, L. (2014). Towards ‘Trade Policy Analysis 2.0’: from national comparative advantage to firm-level trade data. VoxEU. https://cepr.org/voxeu/columns/towards-trade-policy-analysis-20-national-comparative-advantage-firm-level-trade-data
Cernat, L. (2021a).The (Cyber) Security of Global Supply Chains: Is this a Blind Spot for Industry 4.0?. ECIPE Blog. https://ecipe.org/blog/cyber-security-global-supply-chains-industry-40/
Cernat, L. (2021b). From SMEs to Unicorns: What Role for Trade, Standards and New Tech?. ECIPE Policy Brief 13/2021. ECIPE, Brussels. https://ecipe.org/wp-content/uploads/2021/09/ECI_21_PolicyBrief_13_2021_LY02.pdf.
Cernat, L. (2021c).Trade policy 2.0 and algorithms: towards the “easification” of FTA implementation. 2021PE-05, Perspectives (2020-2021), CIRANO, Montreal.
Cernat, L and Guinea, O. (2023). Trade and Competitiveness: Putting the Firm at the Centre of the Analysis. ECIPE Policy Brief 06/2023, ECIPEBrussels. https://ecipe.org/wp-content/uploads/2023/06/ECI_23_PolicyBrief_06-2023_LY04.pdf
CCI (2023). Lancement du Plan “Osez l’export. Chambre de Commerce et d’Industrie. https://www.cci.fr/actualites/lancement-du-plan-osez-lexport.
ECB (2015). Assessing European firms’ exports and productivity distributions: the CompNet trade module. ECB Working Paper 1788/2015, European Central Bank, Frankfurt.
Erixon, F., Guinea, O. and du Roy, O. (2023). If the EU was a State in the United States: Comparing Economic Growth between EU and US States. ECIPE Policy Brief 07/2023, ECIPE, Brussels.
European Commission (2023a). 2023 Country Report – Slovakia. Commission Staff Working Document, SWD(2023)/625 final, Brussels.
European Commission (2023b). EU launches tool to help exporters seize benefits of Mutual Recognition Agreements.DG Trade News Article, Brussels. https://policy.trade.ec.europa.eu/news/eu-launches-tool-help-exporters-seize-benefits-mutual-recognition-agreements-2023-11-13_en
Eurostat (2023). European business statistics compilers’ manual for international trade in goods statistics – trade by enterprise characteristics, Eurostat, Luxembourg. https://ec.europa.eu/eurostat/web/products-manuals-and-guidelines/w/ks-gq-23-007
Freund, C. and Pierola, M.D. (2012). Export Superstars. Policy Research Working Paper No. 6222, World Bank, Washington.
IMF (2023). World Economic Outlook: Navigating Global Divergences. International Monetary Fund, Washington, DC. https://www.imf.org/en/Publications/WEO/Issues/2023/10/10/world-economic-outlook-october-2023
ISGEP (2008). Understanding Cross-Country Differences in Exporter Premia: Comparable Evidence for 14 Countries. Review of World Economy, 144, 596–635.
Koltay, G., Lorincz, S., Valletti, T. (2023). Concentration and Competition: Evidence from Europe and Implications for Policy. Journal of Competition Law and Economics, 19 (3), 466-501.
Lopez-Gonzalez, J., Sorescu, S. and Kaynak, P. (2023). Of bytes and trade: Quantifying the impact of digitalisation on trade. OECD Trade Policy Paper 273/2023, Paris.
Marin, D., Schymik, J. and Tscheke, J. (2015). Europe’s export superstars – it’s the organisation!. Bruegel Working Paper 2015/05, Brussels. https://www.bruegel.org/sites/default/files/wp_attachments/Europe_-export_superstar.pdf
Mayer, T. and Ottaviano, G. I. (2008). The Happy Few: The internationalisation of European firms – new facts based on firm-level evidence. Intereconomics 43, 135-148.
MSS (2024). The Ministry of Small and Medium Enterprises and Startups allocates KRW 8.7 trillion (USD 6.6 billion) as policy funds to SMEs and microenterprises in 2024. Ministry of Small and Medium Enterprises and Startups, Seoul. https://www.mss.go.kr/site/eng/ex/bbs/View.do?cbIdx=244&bcIdx=1047226
Normand, G. (2023). Face au déficit commercial record de la France, Macron veut muscler les exportations des PME. La Tribune. https://www.latribune.fr/economie/france/face-au-deficit-commercial-record-de-la-france-macron-veut-muscler-les-exportations-des-pme-983668.html
Park, J-H. (2024). SMEs rush to seek globalisation under diplomat-turned-minister’s leadership. The Korea Times. https://www.koreatimes.co.kr/www/tech/2024/01/129_366122.html
Rueda-Cantuche, J. M., Cernat, L. and Sousa, N. (2019). Trade and jobs in Europe: The role of mode 5 service exports. International Labour Review, 158 (1),117-136.
Tomàs-Porres, J., Segarra-Blasco, A. and Teruel, M. (2023). Export and variability in the innovative status. Eurasian Business Review 13, 257–279.
US SBA (2023). SBA Dedicates $20 Million to New Small Business Export Growth. United States Small Business Administration. https://www.sba.gov/article/2023/09/05/sba-dedicates-20-million-new-small-business-export-growth
Van Biesebroeck, J. (2005). Exporting Raises Productivity in Sub-Saharan African Manufacturing Firms. Journal of International Economics 67 (2), 373–391.
Volkswagen (2018). Annual Report: Startups and efficiency Volkswagen Slovakia. https://de.volkswagen.sk/content/dam/companies/sk_vw_slovakia/podnik/Vyrocna_sprava_2018_EN.pdf