Taxing Digital Services – Compensating for the Loss of Competitiveness
Published By: Erik van der Marel Peer Schulze
Subjects: Digital Economy DTE European Union
Summary
Several countries around the world have implemented a tax on digital services, commonly called Digital Services Tax (DST). This policy brief takes a closer look at why some European countries have imposed DSTs but not others. Surely, there are economic explanations behind the fact that Austria, France, Italy, Spain, and the UK have introduced DSTs – but not other countries in Europe.
The five tax-imposing countries (here called DST5) have been losing trade competitiveness in digital services over the last 15 years. On the many trade competitiveness indicators we compute, the DST5 score lower values and show lower growth rates compared to other non-DST countries in Europe. Moreover, the differences between the DST5 and non-DST countries are stark, suggesting that digital services markets for the latter group of countries are a lot more dynamic and globalized.
The difference between DST5 and other European countries in digital services competitiveness is striking. This is not to say that there should not be special taxes on digital services – that is a different issue – but it is important that the discussion about the DST starts from a better understanding of how such a tax relates to underlying patterns of digital service performance.
1. Introduction
In recent years, several countries around the world have implemented a tax on many digital services, ranging from online advertising and digital platforms to search engines and the trading of data. The tax is commonly called Digital Services Tax (DST). In Europe, Italy, Austria, Spain, France, and the United Kingdom all apply a tax rate varying between just a few percentages up to 5 percent on these digital services. Others have proposed a similar tax or are still considering it.[1] Obviously, the tax is controversial.
In this policy brief, we take a closer look at why some European countries have imposed DSTs but not others. The argument from countries that have introduced these taxes are that firms supplying digital services are not paying enough in tax. That may be true, but there is surely a richer explanation behind the fact that Austria, France, Italy, Spain, and the UK have introduced DSTs – but not other countries in Europe.
Other countries may be waiting for the result of the OECD talks about broader changes to corporate income taxation – and perhaps they are prepared to introduce their variant of a DST in the future. Still, what might be the reason these countries did not join forces with other European countries that went for the DST? Indeed, why did many of non-DST countries take a sceptical view of the EU proposal to have a Europe-wide agreement on taxing digital services? Are there explanations that are anchored in the relative competitiveness of countries?
[1] Poland has applied its own DST of a low 1.5 percent on audio-visuals only, whereas Hungary has temporary set its applied digital tax rate to zero.
2. Trade competitiveness with the US
The underlying trade performance may help to get a better understanding. In fact, a revealing pattern appears. Relative to the US, the five tax-imposing countries (here called DST5), have had a decade and half of declining digital services competitiveness. They have shown little vigour in their digital services markets, resulting in an ailing trade performance in the sector over almost 15 years.
The DST5 started with a strong comparative advantage, a well-known indicator measuring a country’s ability to produce a particular good or service at a higher proficiency rate compared to trading partners, but the group has lost ground over the years (see Figure 1, left-hand panel). Their bilateral revealed comparative advantage (BRCA) with the US has dropped below 1, now denoting a comparative disadvantage.[1]
Similarly, the extent to which the DST5 “should” trade with the US has been lagging, too. That can be seen by the trade intensity, an indicator used to assess whether two partner countries trade as much as would be expected given their weight in global trade. Trade intensity with the US has diminished in recent years for the DST5, further falling short of their potential given their importance in world trade, as measured by a value lower than one (see Figure 1, right-hand panel).
While digital services trade competitiveness for these five European countries has plummeted, the competitiveness of other EU countries has been rising. Excluding the DST5, other EU members reveal an opposite trend of reinforced comparative advantage in digital services against the US (denoted as EU28 w/o DST5 in Figure 1). Equally, the trade strength with the US for these non-DST countries has been rising, even if it is still below 1 for the benchmark countries.
Figure 1: Digital services trade competitiveness vis-à-vis the US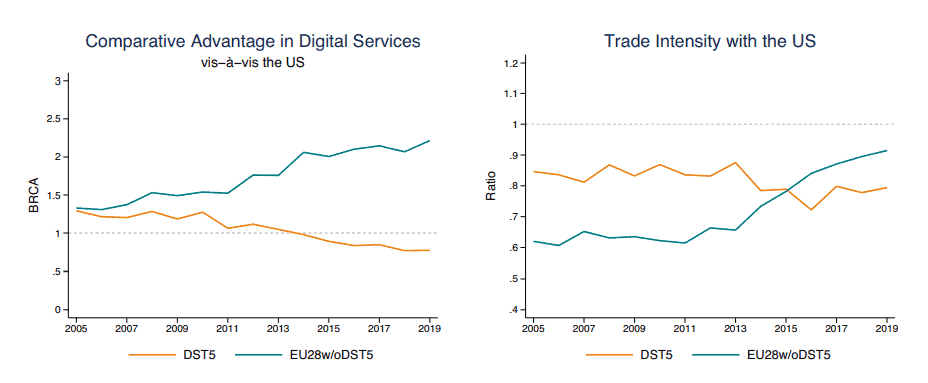 Sources: Author’s calculations; WTO-OECD BaTiS.
Table 1 tells a similar story of trade decline. It evaluates all aspects of trade competitiveness with the US in digital services for the DST5 and the non-DST countries (in addition to a third group of countries; see below). The columns tabulate the value and growth rate of all competitiveness indicators: the import penetration ratio, per capita trade numbers, and trade openness, including the revealed comparative advantage and trade intensity index.
On all indicators the DST5 score lower values (except on trade intensity) and show lower growth rates. Moreover, the differences are stark. For example, over the last decade the import penetration of digital services has been much lower in levels and growth for the DST5 markets than that of an average non-DST European country, suggesting the five DST-imposing countries profited much less from digital spill-overs coming in from abroad.
Per capita trade, a competitiveness indicator measuring the per-unit trade ability of a country, has also been trailing behind other non-DST countries. And for both per capita imports and exports, growth rates for the DST5 have drifted around a meagre 5 percent, whereas that for the non-imposing countries, growth rates are running into 2-digits with a whopping 17 percent on average. These numbers indicate that European markets outside the DST5 are a lot more dynamic.
Table 1: Trade competitiveness of digital services vis-à-vis the US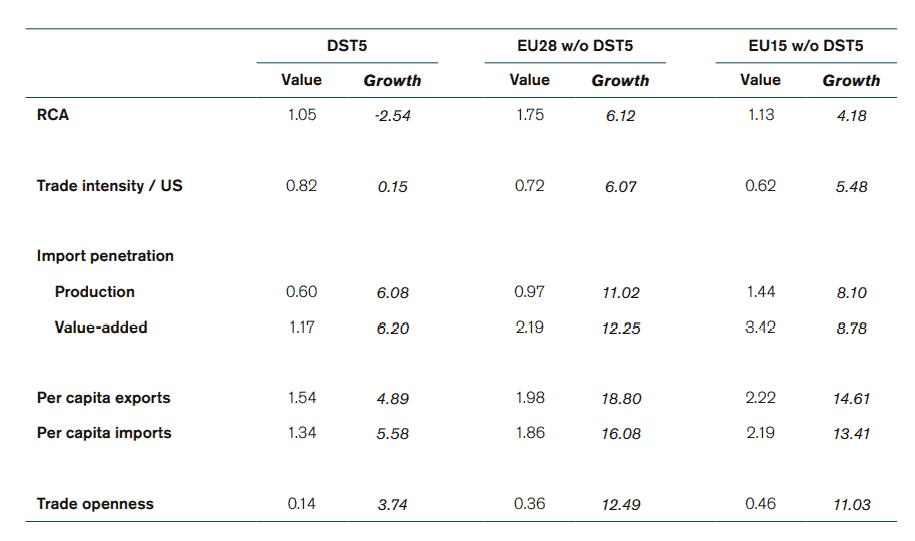 Note: Growth rates are computed on the basis of annual average growth rates (AAGR). Production data is taken from TiVA and STAN with similar results. Results are similar when using total GDP from the WDI. Trade openness is computed with data from WDI. Trade data is taken from WTO-OECD BaTiS (final values). Years of analysis vary depending on data availability but generally covers 2005-2019 for trade and 2005-2015 for output. Values for per capita trade are put in logs. All competitiveness indicators are for the digital services of computer, information, and communication services only.
Some might think that a comparison with all EU members is unfair. Many Eastern European countries have young markets, are still fast-growing, and have become real digital centres. Cluj in Romania is cementing its reputation as an IT innovation hub; Poland, profiting from a lot of European supply-chain trade, is increasing the speed to become a digital leader in the region. Including Eastern Europe in the comparison group may therefore cover up for the weaker performance of other European benchmark countries.
However, this is not the case. Even if the Eastern bloc is taken out (see column EU15 w/o DST5 in Table 1), the conclusions are strikingly similar: digital services markets in the DST5 have been weak in trade competitiveness with the US. And more worryingly, other European countries without any digital duty are moving in the opposite direction as their markets over time have become more competitive.
[1] Bilateral revealed comparative advantage is a spin-off measure of the standard revealed comparative advantage in which case a country’s trade pattern is benchmarked with one country it trades with instead of the rest of the world. For the DST5, the bilateral benchmark is the US.
3. Global Trade competitiveness
But losing competitiveness to the US may not mean shortfalls in trade with the rest of the world. After all, the US is home to many digital giants and has a vibrant tech sector. The weak position of the DST5 against the US may therefore be offset by their stronger standing elsewhere in the world. Their digital services markets may have globalized much faster somewhere else than across the Atlantic.
However, that thesis is not holding up. Using similar metrics but now with global benchmarks we arrive at the same conclusion: the DST5 have witnessed a dismal decade of trade decline in digital services with the rest of the world. Since 2006, their global comparative advantage in digital services has steadily fallen. And import penetration has grown slower than in the other countries, confirming a lower exposure to competitive forces (see Figure 2).
Figure 2: Digital services trade competitiveness vis-à-vis the world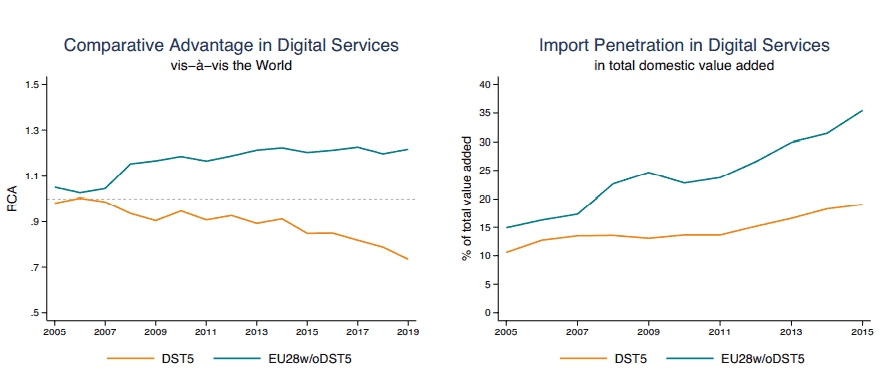 Sources: Author’s calculations; WTO-OECD BaTiS, OECD TiVA.
The weakening of global trade performance also holds up in all other yardsticks (as shown in Table 2, which replicates the previous table but now against global benchmarks). Even though the comparative advantage for the EU15 (excluding DST5) has diminished as well, its value stays robustly above the 1-line threshold, meaning it is in a much better shape. Trade-intensity growth in the EU, now benchmarked against the OECD, is twice faster if we exclude the DST5. Furthermore, the two ratios of import penetration are much larger for the non-DST countries.
Altogether, digital services markets for non-DST European countries seem to be a lot more dynamic. They have stronger relative trade levels in digital services, market positions that are in line with what global trade patterns would predict, and unit values of exports and imports that are booming (shown in the per-capita trade numbers in Table 2).
By contrast, the results for the DST5 disappoint. Their digital services markets appear to be much less globalized. One way to express this difference is shown by the last indicator of trade openness: the DST5’s integration with the US trails the non-DST countries by a factor of 2.5. This is very significant. But the difference gets even larger when trade integration with the rest of the world is measured. Remarkably, then the DST5 are behind non-DST countries by a factor of 4.
Overall, DST5 markets have lost in digital services trade competitiveness. True, some countries in the DST5 group perform better than others. Austria has stronger import penetration patterns ratios and higher per-capita imports than others. The UK has higher trade intensity developments bilaterally with the US, for obvious reasons. Still, the overall trend is going downwards and no country in the DST5 skews the averages.
Table 2: Trade competitiveness of digital services vis-à-vis the World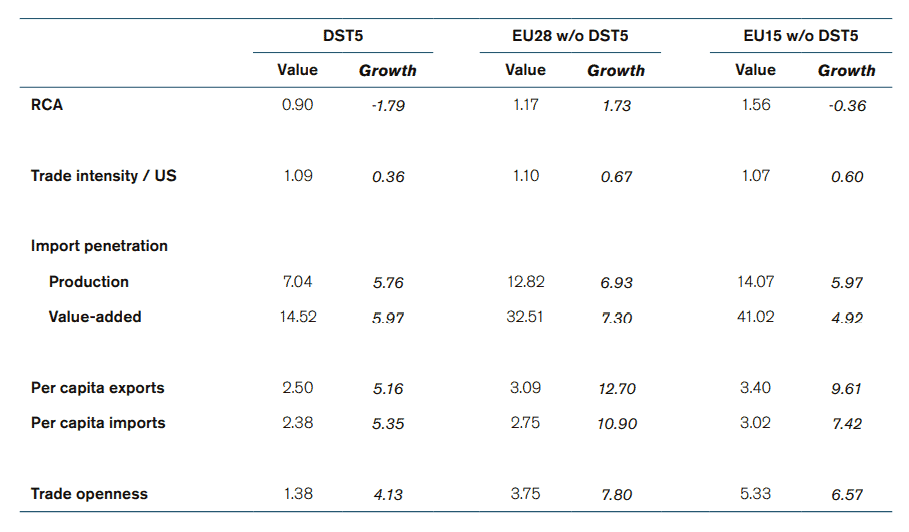 Note: Growth rates are computed on the basis of annual average growth rates (AAGR). Production data is taken from TiVA and STAN with similar results. Results are similar when using total GDP from the WDI. Trade openness is computed with data from WDI. Trade data is taken from WTO-OECD BaTiS (final values). Years of analysis vary depending on data availability but generally covers 2005-2019 for trade and 2005-2015 for output. Values for per capita trade are put in logs. All competitiveness indicators are for the digital services of computer, information, and communication services only.
4. Economic Competitiveness in Digital Services
What may further explain this ailing trade performance in digital services for the DST5? Going a little deeper in exploring economic explanations to why DST5 introduced the digital services tax – but not other countries in Europe – may provide a potential answer. While there is a normative and political discussion going on about the right level of corporate taxation, our results so far have indicated that the DST5 are different from the average performance and competitiveness in other European countries.
The failing performance in the five DST-countries reflects the underlying gloomy trend in their digital markets. For instance, the share of output for digital service (measured in value-added) has actually declined since 2005; nor does that share seems to be recovering (see Figure 3, left-hand panel). Likewise, the share of employment in digital services in the DST5 has trailed the development in the rest of Europe (see Figure 3, right-hand panel).
Figure 3: Other economic competitiveness indicators vis-à-vis the world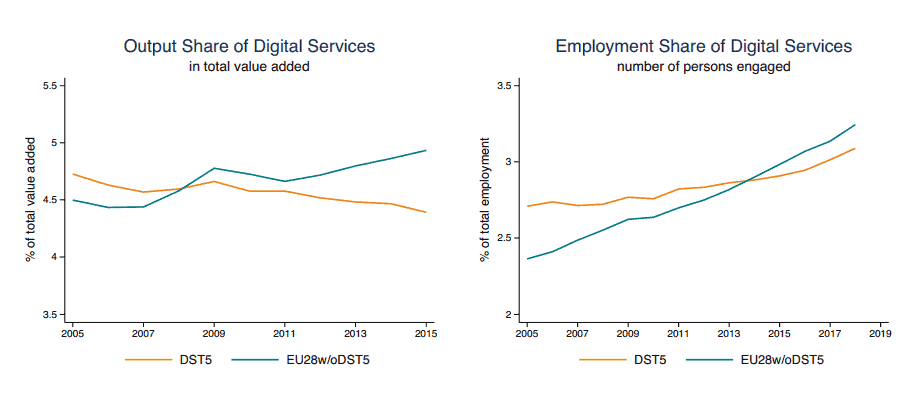 Sources: Author’s calculations; OECD TiVA; OECD STAN.
Using alternative proxies to calculate the share of economic output and employment for digital services confirms these results (see Table 3). The growth of digital services production has been consistently negative while it has been positive for the rest of the EU, regardless of the inclusion or not of fast-growing countries in Central and Eastern Europe. The number of people working in digital services has been growing for all European countries. However, it has not grown so fast for the DST5.
These results also go beyond a simple loss in trade shares. Productivity growth in digital services across the country groups reinforces our point (as shown by labor productivity in Table 3). The productivity rates for the DST5 – which are behind non-DST countries – suggest that something more structural is going on.
There may be many reasons behind the sluggish productivity performance but the fact that they are precisely observed in the digital services point to explanations that are specific to this sector. For instance, the share of intangible business investments – ranging from computer software and engineering designs to organizational capital and R&D – grew much slower in the DST5. Given that trade is often driven by investments, this factor may be one area to start looking at.
Table 3: Other economic competitiveness indicators in digital services vis-à-vis the World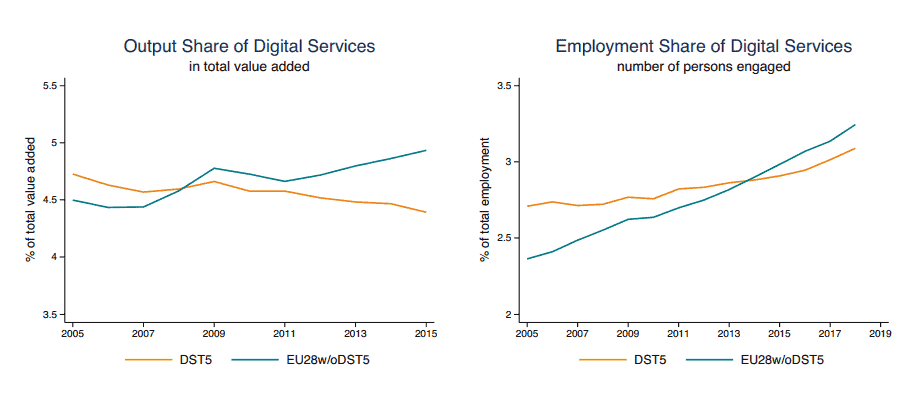 Note: For the intangible indicators we take EU14 instead of EU15 w/o DST5 because of data availability. EU14 are: Belgium, Czech Republic, Germany, Denmark, Finland, Greece, Hungary, Ireland, Luxembourg, Netherlands, Portugal, Slovak Republic, Slovenia, Sweden. Growth rates are computed on the basis of annual average growth rates (AAGR). Production data is taken from TiVA and STAN with similar results. Productivity data is taken from EUKLEMS. Results are similar when using total GDP from the WDI. Total value-added for intangibles is taken from INTAN. Years of analysis vary depending on data availability but generally covers 2005-2015 for output; 2005-2018 for employment; 2005-2015 for productivity; and 2005-2016 for intangibles. Values for productivity levels are put in logs. All competitiveness indicators are for the digital services of computer, information and communication services only.
Conclusion
The difference between DST5 and other European countries in digital services competitiveness is striking. This may also help to explain why some countries in Europe – but not others – have introduce taxes on digital services. Obviously, the difference in performance and competitiveness has an impact on the actual working of a digital tax: whom it taxes and how the local economy responds to a tax.
This is not to say that there should not be special taxes on digital services – that is a different issue – but it is important that the discussion about the DST starts from a better understanding of how such a tax relates to underlying patterns of digital service performance.