Seeing the Forest and the Trees: Recent Developments in the US Tariff Landscape
Published By: Lucian Cernat
Subjects: North-America
Summary
This short factual overview paper describes the complexity created by the tariffs imposed by the US, especially for small and medium enterprises (SMEs). The Policy Brief concludes by highlighting the importance of the EU “Access2Market” tool in addressing these new complexities, helping EU exporters gain access to the US market.
*Disclaimer: The views expressed herein are those of the author and do not represent an official position by the European Commission.
1. Introduction
“Tariffs is the most beautiful word in the dictionary” has become by now a famous phrase. Tariffs have now also become the key parameter defining the current US trade policy, partly due to their perceived simplicity. Compared to other trade policy instruments, tariffs are straightforward: they are clearly defined by the relevant legislation of each importing country as a tax on imported products. Unlike non-tariff barriers whose cost is often unclear and whose impact is hard to measure, tariffs are usually expressed as an ad-valorem percentage tax on the value of imported goods.
However, tariffs come with their own challenges. At the international level, tariffs are administered through the Harmonised System, a meticulously defined product classification, that assigns each imported product and allocates a numerical code of up to six digits. Based on the Harmonised System (HS), countries define their own detailed tariff codes, usually extending to 8 or 10 digits and in some cases even further.[1]
Tariff codes are key to determining the tariff rate applicable to any given imported product. For instance, sausages can fall under different tariff codes and face different tariff rates, depending on the type of meat they are made of. Similarly, fish products are subject to different import tariffs, depending on the type of fish, the method of preparation (fresh, frozen, pre-cooked, boiled, breaded, etc.) and the packaging (e.g., in airtight containers or otherwise). Hence, for a small exporter or importer, trying to determine the correct tariff code for lobster meat (cooked by steaming or boiling in water and out of shell, whether or not frozen, but not further prepared or preserved) can be a tricky task.
This complexity has led to the emergence of an entire industry of customs classification experts helping exporters and importers navigate the maze of tariff codes. Governments have also tried to offer easy-to-use online tools for trading firms, notably small and medium-sized enterprises (SMEs) engaged in international trade. For instance, the EU has created a dedicated website, called “Access2Markets”, which now has over 1 million users.[2] However, even with professional help, occasionally, disputes over the correct tariff code for a product can reach US federal courts, and in some cases, even the Supreme Court. [3]
So, tariffs are simple until they aren’t. This “simple but complex” paradox is evident in the way the Trump administration’s newly announced tariffs have been implemented. Identifying the correct tariff becomes even more difficult when the product’s origin determines the applicable tariff rates. For example, if sausages from different countries are subject to different tariffs, it is of paramount importance to consider the so-called “rules of origin” that define under which conditions a sausage is Italian or Canadian.
Therefore, when President Trump announced on 2 April that imported products from different countries would be subject to additional tariffs on top of the existing ones, the result was a huge US tariff matrix comprising more than 17,000 tariff codes, combined with around 200 countries of origin for each product, and with different tariff rates added to the existing ones. This amounts to more than 3 million individual, product-specific tariffs. Visualising millions of data points in a single chart would be almost as difficult as analysing every single pixel in your last selfie. Since that task would be inhumanely difficult, the next best step is to simplify. Einstein famously said that “everything should be made as simple as possible, but not simpler”.
[1] For a full description of the Harmonised System classification of products applied internationally by over 200 countries, see WCO (2022). HS Nomenclature 2022 Edition, World Customs Organization. Available online at: https://www.wcoomd.org/en/topics/nomenclature/instrument-and-tools/hs-nomenclature-2022-edition/hs-nomenclature-2022-edition.aspx
[2] European Commission (2025). Access2Markets – Exporting from the EU, importing into the EU – all you need to know. Available online at: https://trade.ec.europa.eu/access-to-markets/en/home
[3] Howarth, Jr., C. (2002). United States v. Meade Corp.: More pieces for the Chevron/Skidmore deference puzzle, Administrative Law Review, 54(2): 699-717.
2. Navigating Tariff Complexity: From Millions of Tariff Lines to Less Than 100 Sectors
One way to simplify the more than 3 million data points in the US tariff landscape is to zoom out from the 10-digit product categories to the broader 2-digit level. This is essentially like enlarging the pixels in a picture. In doing so, we simplify the tariff landscape, reducing it to fewer than 20,000 data points.
Based on this logic, IMF and WTO experts created a tool called “Tariff Tracker”, which offers a guided tour throughout the tariff maze.[1] The Tariff Tracker groups data into HS two-digit categories (HS chapters) comprising all related product-specific 10-digit US tariff codes. For instance, meat products fall under HS code 02, most fish products under HS code 03, and processed meat and fish under HS code 16. As a result, the 17,000 individual products are reduced to 96 product categories at 2-digit level. Once these 96 HS two-digit product categories were established, the next step was to calculate the average tariffs for each category, using a simple average of all the product-specific tariffs adjusted by country of origin.
For example, some imported products were subject to zero tariffs in the US regardless of their country of origin, under the MFN principle. Others had a zero tariff for countries with a Free Trade Agreement with the US, but a positive tariff for all others. On top of these product-specific tariffs, the Trump administration imposed additional ones, again based on the specific rate applicable to different countries. Moreover, there were additional product-specific tariffs in place from the Biden administration (e.g., tariffs on aluminium products from Russia) whereas some products were exempted from the additional tariffs announced on 2 April (e.g., mobile phones). All these specificities were taken into account in the WTO-IMF tracker.
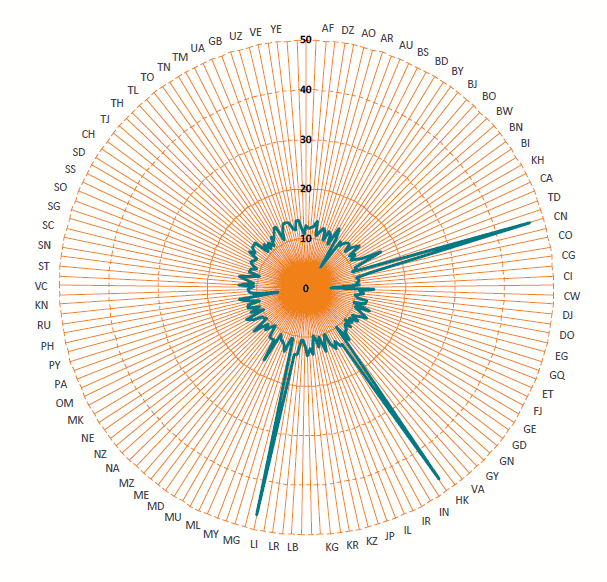
The outcome of this first simplification is shown in Figure 1, which plots the US tariffs applicable in May 2025 for each HS chapter and country-of-origin combination. While it still resembles a dense “tariff jungle” where it is difficult to see and analyse every data point, it is now at least possible to see both the shape of the forest and its individual trees.
Figure 1: US tariffs at HS2 level, by country of origin (simple averages), May 2025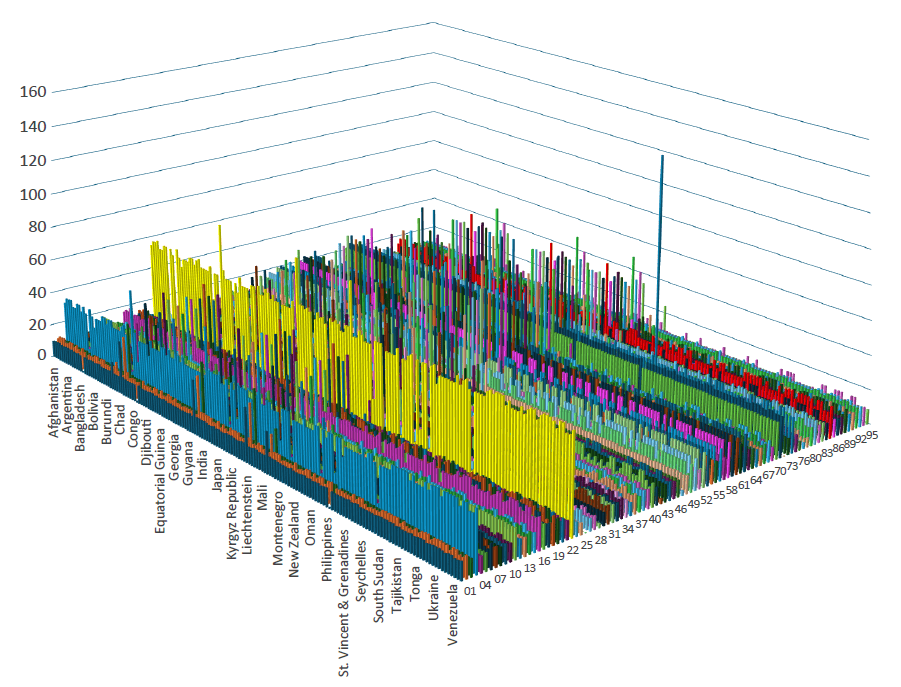 Source: Author’s calculations based on the WTO-IMF Tariff Tracker.
With this HS2 simplification, visualising only a few thousand data points as in Figure 1 rather than more than 3 million data points at tariff line level makes the task manageable. Yet it remains difficult to see clearly the forest and the trees. Some patterns are nonetheless visible. Certain tariffs are higher than the US simple average across all partners and sectors. Take, for instance, tariffs applicable to agrifood products, such as chapter 04 (dairy), chapter 17 (sugars and confectionery products), and chapter 24 (tobacco). Higher tariffs are also visible for certain industrial products, such as chapter 55 (man-made fibres), chapter 61 (apparel), chapter 73 (articles of iron and steel), chapter 76 (aluminium), and chapter 87 (cars and car parts). Then, there are some outliers that stand out in this dense landscape of tariffs. One of the tallest tariff “trees” in Figure 1 is HS chapter 76 for Russia, at more than 140 percent. Such tariff peaks, even if isolated, can significantly affect the overall level of tariffs.
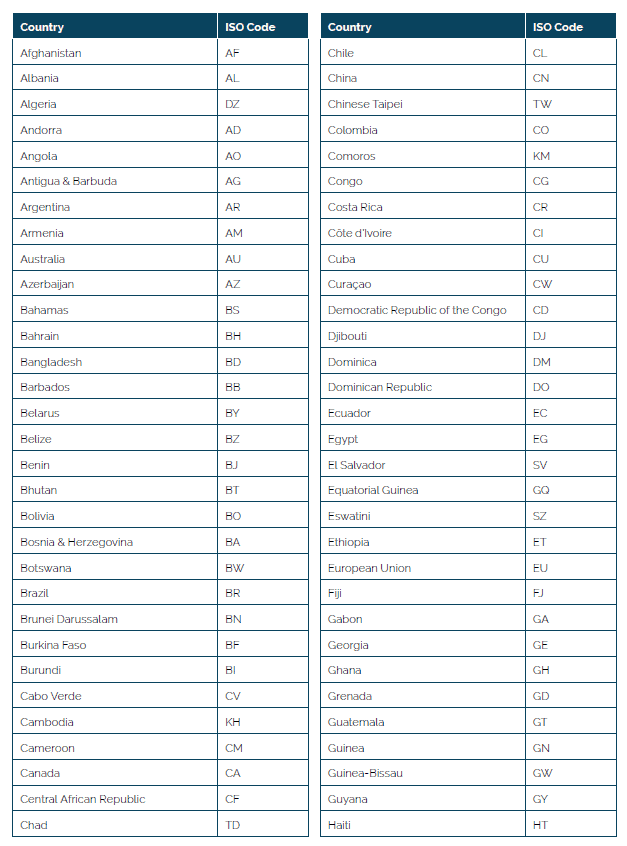
[1] WTO-IMF (2025). The WTO-IMF Tariff Tracker. Available online at: https://ttd.wto.org/en/news-blog/wto-imf-tariff-trackerAnnex: Country two digit ISO codes
3. Simplifying Further: From Sectoral Averages to National Average Tariffs
If we are prepared to lose some of the details depicted in Figure 1, we can simplify the US tariff landscape even further. One option is to eliminate the multidimensionality created by the various sectors (HS chapters). Instead of sector-specific tariffs for each country, we can aggregate further by calculating a single average tariff at the country level across all products. Instead of 96 different sectoral average tariffs for each country, we now end up with a simple average tariff at the national level. This is the equivalent of removing all the different colours from a picture to create a monochromatic image.
This method is the most straightforward way to calculate a simple average tariff for each country. These simple averages disregard the structure of import flows between the US and each of its trading partners. Essentially, the method assumes that countries export all HS2 chapters in equal values. The corresponding simple tariff averages across all products, as faced by each US trading partner, are shown in Figure 2.
Figure 2a illustrates the impact of adding a quasi-uniform 10 percent tariff on top of the existing US tariffs. However, there are some caveats. According to the WTO-IMF Tariff Tracker, as of May 2025, the Russian Federation, Belarus, and Cuba were not subject to the uniform 10 percent tariff. Also, in certain specific cases, the 10 percent tariff does appear to apply (e.g., in the case of imports of mineral oils and copper products from Korea, Peru, and Morocco). Canada and Mexico also faced a different tariff structure, indicating that the 10 percent horizontal tariff did not apply. In Canada, for example, tariffs ranged from 1.53 percent on iron and steel to 36.86 percent on dairy products. The three trading partners that stand out in Figure 2a are China, Hong Kong and Macao, with simple average tariffs of 47 percent.
Figure 2: United States: simple average tariffs
a. May 2025
b. August 2025
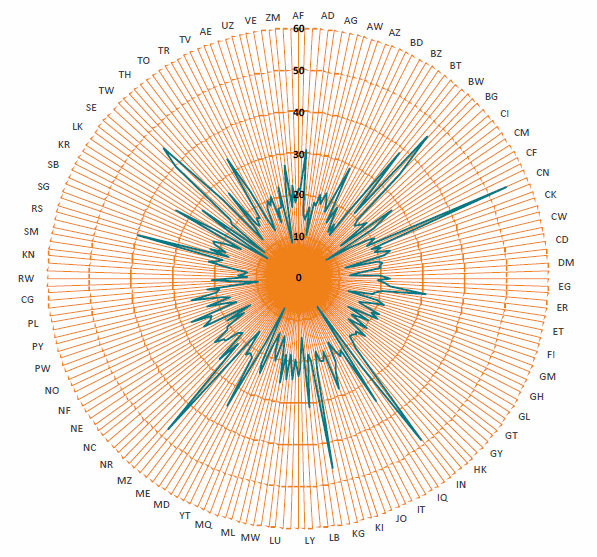
Source: Author’s calculations based on the WTO-IMF Tariff Tracker for the May 2025 tariff data and the GTA database for August 2025.
Critically, the US tariff structure became even more volatile in the second half of 2025. A series of executive orders and other official announcements modified US tariffs for certain sectors (e.g., steel and aluminium, copper derivatives, car parts) and for specific trading partners (e.g., UK, China, Brazil, Korea, Japan, EU, India, and Switzerland).
As a result, the tariff landscape became even more complex. The Global Trade Alert (GTA) initiative has compiled a comprehensive dataset of the most recent US tariffs, broken down by product and country of origin. Aggregating the GTA data at the national level allows us to compare the evolution of US tariffs between May and August (see Figure 2b).[1]
The overall picture has shifted towards greater complexity and heterogeneity across countries in terms of the simple average tariffs they faced in the US. A clear trend that can be observed is the increase in average tariffs since May 2025. At the end of August 2025, more than a hundred countries faced a US simple average tariff above 20 percent. In May, only China, Hong Kong and Macao faced a US simple average tariff greater than 20 percent.
[1] GTA (2025). US Tariff Measure Inventory 2025, Global Trade Alert Initiative. Available online at: https://globaltradealert.org/blog/US-Tariff-Measures-Inventory
4. Adding Some Shades of Grey: From National Simple Average Tariffs to Weighted Averages
Simple average tariffs are, as the name suggests, the simplest way to look at the US tariffs. However, by stripping away the sectoral heterogeneity of US imports across countries, we risk coming close to violating Einstein’s principle of making things as simple as possible, but not overly simplistic. The logic behind simple averages is that all products carry equal weight in the trade structure of a given country. Obviously, this is not the case. Many countries have a highly skewed distribution of their exports, with certain HS chapters accounting for a large share of their exports to the US, while other products make up an insignificant share or are not exported at all.
For instance, more than 90 percent of Burundi’s exports to the US are in HS chapter 09 (coffee, tea, mate and spices), followed by articles of apparel (around 7 percent of total export value). This means that the tariffs that truly matter for Burundian exporters are those applied to these two product categories. For coffee, tea and spices, the US tariff on Burundi’s exports went from zero to 10 percent in May 2025. For apparel, the simple average tariff for this category rose from 12.9 percent at the beginning of the year to over 22 percent. Since Burundi exports little else, these two product categories determine the actual tariffs paid. To capture this high concentration of exports in certain product categories, the standard metric used is weighted tariff averages, which account for the value of trade in each product category when calculating the tariff faced by a country’s exporters to the US.
Taking the relative importance of various HS chapters into account when calculating a single tariff per country is like moving from a black-and-white picture to one that shows many shades of grey. Considering trade values brings back the fact that trade flows for some countries may be concentrated in sectors with higher US tariffs. So, even though many countries face the same US simple average tariffs, they may end up paying higher weighted average duties. This is the case for countries across all continents and income levels, such as Haiti, Azerbaijan, Liechtenstein, or Bahrain. Conversely, many countries pay an effective tariff rate that is lower than the simple averages. This is the result of many sectoral exceptions in the new US tariff structure, whereby several products (including certain pharmaceutical ingredients, or products that cannot be grown, mined, or naturally produced in sufficient quantities in the US, such as graphite, nickel, and gold) are subject to zero duties. Many countries with large export shares of such exempted products end up facing lower tariffs in the US than the official, headline figures.
5. Conclusions: Tariffs Are Simple Until They Get Complex
Compared with other trade policy instruments, tariffs are generally considered as one of the simplest tools to influence trade flows. Their perceived simplicity was one reasons the Trump administration placed tariffs at the centre of US trade policy. In reality, the vast number of traded products and the varying tariff rules by product and country make the system so complex that even tariff experts struggle to obtain a full and accurate picture of the US tariff landscape. Initiatives such as the IMF-WTO Tariff Tracker tool and the Global Trade Alert, which closely monitor the evolution of tariffs at the sectoral level across countries, almost in real time, make the task of analysing US tariffs far easier.
Yet, gaining a clear “helicopter view” of the US tariff landscape is only the first step in navigating tariff complexity and uncertainty. For hundreds of thousands of US importers and exporting firms worldwide, finding the right tariff for their products requires a far more precise approach. Implementing such complex tariffs comes with increased administrative costs and burdens. For instance, at the end of August, the US government announced a new task force between the Departments of Justice and Homeland Security, responsible for detecting customs fraud and tariff evasion.[1]
The good news for EU exporters to the US is that they can use the “Access2Markets” tool created by the European Commission several years ago. Designed with the needs of SMEs in mind, this tool greatly simplifies issues surrounding tariffs and other applicable trade rules (e.g., rules of origin, non-tariff measures such as SPS, TBT and customs formalities). “Access2Markets” uses algorithms to codify trade rules and transform them into simple, plain language answers for SMEs.[2]
Going back to the example of the small firm interested in exporting or importing “lobster meat, cooked by steaming or boiling in water and out of shell, whether or not frozen, but not further prepared or preserved”, what really matters is that trading companies select the right product classification, identify the correct country of origin, and get a clear sense of the tariff applicable in the US at that highly detailed product level. According to the “Access2Markets” tool, at the time of writing, the US tariff on EU lobster was 15 per cent.
[1] Department of Justice (2025). Departments of Justice and Homeland Security Partnering on Cross-Agency Trade Fraud Task Force. Available online at: https://www.justice.gov/opa/pr/departments-justice-and-homeland-security-partnering-cross-agency-trade-fraud-task-force
[2] Cernat, L. (2021). Trade Policy 2.0 and algorithms: towards the “easification” of FTA implementation, CIRANO Papers 2021pe-05, CIRANO.
References
Cernat, L. (2021) Trade Policy 2.0 and algorithms: towards the “easification” of FTA implementation, CIRANO Papers 2021pe-05, CIRANO.
Department of Justice (2025) Departments of Justice and Homeland Security Partnering on Cross-Agency Trade Fraud Task Force. Available online at: https://www.justice.gov/opa/pr/departments-justice-and-homeland-security-partnering-cross-agency-trade-fraud-task-force
European Commission (2025) Access2Markets – Exporting from the EU, importing into the EU – all you need to know. Available online at: https://trade.ec.europa.eu/access-to-markets/en/home
GTA (2025) US Tariff Measure Inventory 2025, Global Trade Alert Initiative. Available online at: https://globaltradealert.org/blog/US-Tariff-Measures-Inventory
Howarth, Jr., C. (2002) United States v. Meade Corp.: More pieces for the Chevron/Skidmore deference puzzle, Administrative Law Review, 54(2): 699-717.
WCO (2022) HS Nomenclature 2022 Edition, World Customs Organization. Available online at: https://www.wcoomd.org/en/topics/nomenclature/instrument-and-tools/hs-nomenclature-2022-edition/hs-nomenclature-2022-edition.aspx
WTO-IMF (2025) The WTO-IMF Tariff Tracker. Available online at: https://ttd.wto.org/en/news-blog/wto-imf-tariff-tracker
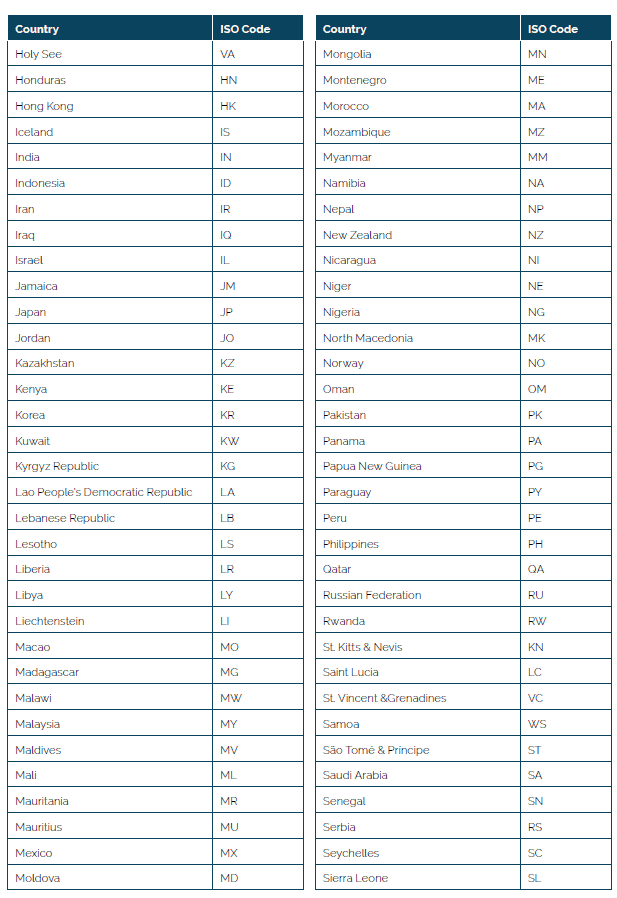
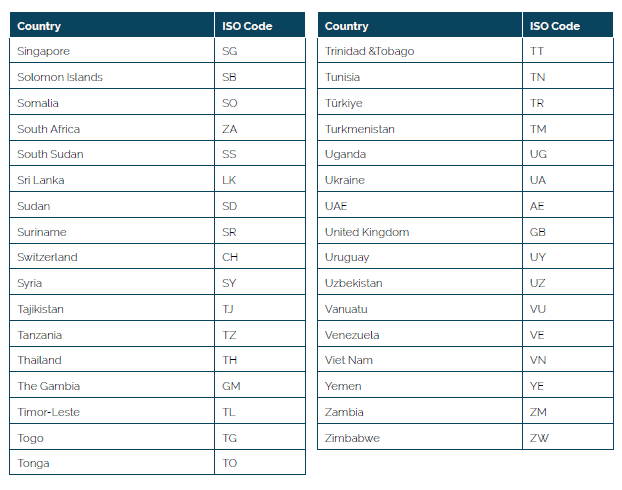
Annex: Country Two-Digit ISO Codes