Models of Industrial Policy: Driving Innovation and Economic Growth
Published By: Andrea Dugo Fredrik Erixon Oscar Guinea
Subjects: European Union Regions Sectors
Summary
Europe’s approach to industrial policy has undergone a dramatic transformation in recent years, with state aid reaching 1.4 per cent of GDP in 2022, levels unseen since the early 1990s. While advocates of substantial state aid argue that this intervention is necessary to maintain competitiveness in a world where the US and China are implementing large-scale industrial strategies, the effectiveness of this approach remains contested.
This paper critically examines the evolution of EU industrial policy, contrasting it with alternative models adopted globally and within Europe itself. While EU economic strategies since the 1980s had focused mainly on horizontal policies such as market liberalisation, competition enforcement and support to Research and Development (R&D), recent developments have shifted towards a more interventionist stance. This shift has largely been driven by crises – the financial crisis of 2008, the COVID-19 pandemic, geopolitical tensions, and the energy transition – which have prompted calls for greater state involvement in shaping industrial outcomes.
However, this paper shows that, while industrial policy can support good economic development, it is not a determinant of economic success. All successful economies have pursued industrial policy, but so have all unsuccessful ones. This suggests that industrial policy, in and of itself, is not a determinant of economic growth and competitiveness. The effectiveness of industrial policy depends on its design, its ability to avoid market distortions, and its capacity to stimulate genuine private-sector investment rather than crowding it out.
The revival of industrial policy in the EU – best exemplified by a series of high-level reports, including the Enrico Letta and Mario Draghi Reports of 2024 – signals a shift towards an industrial strategy that embraces state aid as a central tool for economic restructuring. Unlike earlier EU economic strategies that prioritised the deepening of the Single Market as the best form of industrial policy, recent proposals advocate for a relaxation of state aid rules to enable greater public subsidies for European industries. The rationale is that the EU must respond to global competitors who are no longer playing by the rules of free trade.
As documented in this study, across a diverse range of EU countries, sectors, and policy targets, the prevailing industrial policy model in Europe consistently prioritises a selection of incumbent firms over the private sector as a whole, direct grants over other policy instruments, middle-technology sectors over high-tech ones. This paper argues that such an approach will not generate the desired outcome and assesses its shortcomings to encourage careful review by policymakers before Europe embarks on more of the same.
In search of other policy solutions, this paper contrasts the broad European model of industrial policy with other approaches, particularly those of the US, South Korea, Switzerland, and Ireland, which offer, in different fields, alternative frameworks for fostering industrial competitiveness. These models are attractive because they respond to specific and growing problems in the EU economy that public policy can help to alleviate: low levels of investment, declining inward Foreign Direct Investment (FDI), lagging R&D-based innovation, and problems supplying industry with adequate human capital.
- The US Inflation Reduction Act (IRA) model: the US approach relies primarily on tax credits rather than direct grants. The IRA, introduced in 2022, aims to boost clean energy and industrial innovation by offering broad-based tax incentives to businesses. This method contrasts with the EU’s heavy reliance on direct subsidies, which are often highly selective and risk distorting competition.
- The South Korean model: South Korea has successfully used industrial policy to promote R&D in high-tech sectors. Its G7 Programme in the 1990s provided targeted research subsidies to encourage private firms to invest in cutting-edge technologies. The country also employs highly differentiated R&D tax incentives, favouring small firms that are more responsive to innovation policies.
- The Swiss model: Switzerland relies on strong public investment in research and higher education rather than direct industry subsidies. It maintains a highly innovative economy by fostering collaboration between universities, businesses, and research institutions, making it one of the world’s most innovation-driven economies.
- The Irish model: Ireland has successfully leveraged Foreign Direct Investment (FDI) to transform its economic structure, attracting multinational companies in high-tech industries. By offering a stable business environment, a skilled workforce, and favourable corporate tax policies, Ireland has established itself as a global hub for high-value-added sectors such as pharmaceuticals and information technology.
The common thread between all these different policy models is that they are highly targeted towards certain outcomes – not towards certain companies. A second shared feature is that they want to achieve change in key factors for economic success – including innovation and structural economic change. The paper thus argues that the EU’s industrial policy, while increasing in scale, has yet to demonstrate a clear framework for long-term competitiveness. It remains heavily dependent on direct grants, which can sometimes replace rather than complement private-sector investment. A more targeted approach, drawing inspiration from successful global models, could improve the effectiveness of EU industrial policy by prioritising investment in R&D, fostering entrepreneurship, and ensuring that subsidies do not entrench inefficient firms.
1. Introduction
1.1 Unpacking Industrial Policy: Definitions, Objectives, and Realities
The concept of industrial policy has long been notoriously hard to define, particularly in Europe, as it lends itself to a myriad of different and conveniently tailorable interpretations.[1] However, industrial policy, at its core, is any type of government assistance to businesses that alters the structure of economic activity.
The question is: what are the objectives behind governments or the EU pursuing various forms of industrial policy, and how do policymakers expect these objectives to be achieved through specific policy interventions? Both public policy debates and a new breed of academics seem to suggest that the answers are self-evident. Using narratives such as “smart industrial policy” or “mission-oriented industrial policy,” the prevailing argument is that large-scale government intervention can foster productive and innovative economic behaviour while simultaneously achieving broader societal goals, such as reducing carbon emissions. Building on examples such as DARPA[2] in the US and other examples of government-funded research that spurred successful commercial innovation, the case is that Europe should now orchestrate a massive programme for industrial policy.
However, if we scratch beneath the surface, we will immediately find that these narratives sit awkwardly with reality. A first and fundamental observation, which this paper will explore in depth, is that industrial policy does not start from scratch: there is, in fact, already a whole lot of industrial policy in Europe and, unfortunately, the profile of state-aid focused industrial policy does not mesh with the narrative. If past efforts have failed to deliver smart industrial policy so far, what reason is there to believe future attempts will succeed?
Moreover, demands for increased state aid are growing across multiple sectors, each with its own objectives. While some policymakers remain cautious, the majority accept the premise that state aid or other forms of industrial intervention are necessary. Yet, industrial policy cannot be both “smart” and “mission-oriented” when its scope expands to cover broad sectoral and functional targets. Likewise, isolated successes from DARPA or other mission-driven initiatives do not necessarily lend themselves to large-scale replication. Many of these achievements are extraordinarily difficult to scale, raising important questions about the feasibility of translating such models into sweeping industrial policy programmes.
Recognising that industrial policy encompasses a wide range of policy interventions, a more constructive way to approach industrial policy in the EU today is to begin with two fundamental observations. The first one is:
- All successful economies have pursued industrial policy.
- All unsuccessful economies have pursued industrial policy.
This simple reality suggests that industrial policy, in and of itself, is not an independent variable in determining economic success. While certain industrial policies may yield positive effects, broader economic success is driven by other, more fundamental factors.
The second observation follows the same logic:
- All successful companies have received some benefits from industrial policy.
- All unsuccessful companies have received some benefits from industrial policy.
Once again, this indicates that industrial policy is not the defining determinant of commercial success. While specific interventions may contribute to favourable economic outcomes, the core drivers of success lie beyond industrial policy alone.
1.2 Industrial Policy and the European Union
Unfortunately, many policymakers have jumped on the bandwagon of industrial policy without first establishing basic principles and clear methods. A useful way to track shifts in EU policy trends is through the numerous economic reports commissioned by EU Presidents since the 1970s. A notable absence from these reports all throughout the 1970s[3],[4] and 1980s[5],[6] up to the early 2000s[7] was any substantial focus on industrial policy.
Nevertheless, industrial policy made an unexpected comeback at the turn of the new decade. The Monti Report of 2010 marked the beginning of a streak of economic reports, later contributed to by two other former Italian Prime Ministers, Letta and Draghi in 2024, that would resurrect industrial policy from the world of the dead. Written in the aftermath of the Global Financial Crisis, the Monti Report explicitly acknowledges the “return of interest for industrial policy” as “no longer taboo,” prompted by concerns over the crisis-driven transformation of Europe’s industrial base.[8]
While the Monti Report references industrial policy some 19 times – more frequently than the Letta Report and slightly less than the Draghi Report, despite the latter being four times as long – it insists that EU industrial policy must not contradict competition principles or state aid rules. Instead, the report maintains that the Single Market itself remains the EU’s most effective industrial policy – nothing more, nothing less.[9]
Fourteen years later, the Letta and Draghi Reports propose a markedly different vision of industrial policy. The Letta Report of April 2024, for instance, advocates for a “dynamic and effective European industrial policy” necessitating a profound revision of state aid rules.[10] Whereas the Monti Report upheld strict adherence to existing state aid rules, the Letta Report argues that, while national-level enforcement should remain stringent, a relaxation of provisions at the EU level is essential. If implemented at the Union level rather than nationally – thereby supposedly preserving the integrity of the Single Market and avoiding fiscal disparities among Member States – the report deems a progressive expansion of public subsidies desirable to safeguard the European industrial landscape.[11]
Similarly, the Draghi Report, presented in September 2024, also calls for adjusting state aid rules in alignment with an EU-wide industrial policy. It advocates allowing “greater amounts of aid where EU coordination is enhanced.”[12] In his own words, in a world where the US and China “are no longer playing by the rules and are actively devising policies to enhance their competitive position,” the EU must implement a comparable large-scale industrial policy initiative to “shield our traditional industries from an unlevel global playing field.”[13]
The industrial policy framework proposed by Letta and Draghi revolves around public subsidies to businesses as an indispensable tool for restoring the EU’s competitiveness. This perspective is widely shared across Europe, as evidenced by state aid data. In 2010, following the 2007–08 financial crisis, total EU state aid measures amounted to less than EUR 92 billion. By 2020 and 2021, in response to the COVID-19 crisis, this figure had surged to nearly EUR 350 billion – a nearly fourfold increase.[14] The latest data from 2022 indicates a decline in COVID-related aid, but total state aid expenditure still remains high at EUR 228 billion.[15]
This shift in industrial policy marks a significant departure from the approach dominant since the 1980s. Gone are the days when industrial policy in the EU and globally was merely synonymous with horizontal, non-selective measures aimed at improving the overall business environment – such as high investment in R&D and education, labour market flexibility, and sound levels of taxation and regulation.[16] By contrast, the EU’s emerging industrial policy is more proactive, with governments now being tasked to actively promoting and protecting specific industries.
1.3 Comparing Industrial Policies
A more proactive approach to industrial policy is by no means exclusive to Europe. In areas such as the green transition, for example, the US has made an extraordinary industrial policy effort to boost clean energy investment through the Inflation Reduction Act (IRA) and other key initiatives.[17] While these climate policies are partly reshaped under the Second Trump administration, significant government-guided investment is expected to continue, particularly in emerging technology areas such as artificial intelligence (AI).[18]
However, recognising the global trend towards a more active industrial policy should not obscure the differences between various approaches. The European state aid model, which heavily relies on direct cash payments to selected companies, is just one of many possible strategies. There are many other models of applied industrial policy, and those associated with successful countries and regions tend to share certain key characteristics. One distinguishing feature is that they are highly targeted towards certain outcomes – not towards certain companies. A second characteristic is that they want to achieve change in key factors for economic success, and these factors are, for example, levels of investments, inward Foreign Direct Investment, increasing R&D intensity, and improved firm-level human capital supply.
In this paper, we will examine examples of such targeted industrial policies, assessing their effectiveness through measurable economic success indicators. These models of industrial policy include:
- The US IRA model: this focuses on the use of tax credits instead of direct grants to stimulate investment and capital expenditure within targeted sectors. While the IRA and other US industrial programmes have achieved notable successes, they also face failures stemming from issues similar to those encountered in European state aid efforts;
- The South Korean model: this approach emphasises R&D-focused and targeted government support for firms, especially smaller ones, in higher technology sectors, promoting R&D collaboration and access to advanced technology and knowledge;
- The Swiss model: this model combines significant public sector and university research spending and centres around human capital and policies to train and restructure workers at the firm level with targeted industry-wide R&D programmes;
- The Irish model: this strategy prioritises very big incentives for inward Foreign Direct Investment (FDI) in order to achieve an upgrade of the country’s industry structure, and it allocates resources towards industries with higher value-added contributions.
The report is structured as follows. Chapter 2 will examine EU industrial policy and its usual practices. Chapter 3 will explore the alternative industrial policy models defined above, drawing insights that can inform European policy development. Finally, the Conclusion will synthesise key lessons from external models and propose policy recommendations.
[1] Vanden Bosch, X. (2014). Industrial policy in the EU: A guide to an elusive concept (Egmont Paper No. 69). Egmont – Royal Institute for International Relations. https://www.egmontinstitute.be/content/uploads/2014/09/ep69.pdf
[2] DARPA is the Defence Advanced Research Projects Agency, which is one of several ARPA-agencies that has as mission to support heterodox ideas that can foster new fields of innovation.
[3] Council and the Commission of the European Communities. (1970). Report on the realisation by stages of economic and monetary union in the Community (Werner Report), p. 23. Office for Official Publications of the European Communities. https://ec.europa.eu/archives/emu_history/documentation/chapter5/19701008en72realisationbystage.pdf
[4] Commission of the European Communities. (1977). Report of the study group on the role of public finance in European integration (MacDougall Report), p. 69. Office for Official Publications of the European Communities. https://www.cvce.eu/content/publication/2012/5/31/c475e949-ed28-490b-81ae-a33ce9860d09/publishable_en.pdf
[5] Cecchini, P., Catinat, M. and Jacquemin A. (1988). The European challenge, 1992: the benefits of a single market (Cecchini Report). Wildwood House, London. https://citeseerx.ist.psu.edu/document?repid=rep1&type=pdf&doi=2c09465f7ae8cd516f09288ce1467bf665add1e0
[6] Committee for the Study of Economic and Monetary Union. (1989). Report on economic and monetary union in the European Community (Delors Report). Office for Official Publications of the European Communities. https://aei.pitt.edu/1007/1/monetary_delors.pdf
[7] Sapir, A., Aghion, P., Bertola, G., Hellwig, M., Pisani-Ferry, J., Rosati, D., Viñals, J. and Wallace, H. (2003). An agenda for a growing Europe: Making the EU economic system deliver (Sapir Report). Oxford University Press. https://citeseerx.ist.psu.edu/document?repid=rep1&type=pdf&doi=40f92499a132760ba46bf31309b4d3e3894ca60a
[8] Monti, M. (2010). A new strategy for the single market at the service of Europe’s economy and society, p. 86. Report to the President of the European Commission (Monti Report). European Commission. https://ec.europa.eu/docsroom/documents/15501/attachments/1/translations/en/renditions/pdf
[9] Ibid, p. 88.
[10] Letta, E. (2024). Much more than a market: Report on the future of the Single Market, pp. 5 and 39. Council of the European Union. https://www.consilium.europa.eu/media/ny3j24sm/much-more-than-a-market-report-by-enrico-letta.pdf
[11] Ibid, pp. 26, 39–40.
[12] Draghi, M. (2024). The future of European competitiveness: In-depth analysis and recommendations (Part B), p. 301. European Commission. https://commission.europa.eu/document/download/ec1409c1-d4b4-4882-8bdd-3519f86bbb92_en?filename=The+future+of+European+competitiveness_+In-depth+analysis+and+recommendations_0.pdf
[13] Draghi, M. (2024). Mario Draghi: Radical Change—Is What Is Needed. Speech at the High-level Conference on the European Pillar of Social Rights in Brussels on April 16, 2024. Groupe d’études géopolitiques. https://geopolitique.eu/en/2024/04/16/radical-change-is-what-is-needed/
[14] European Commission. (2024). Scoreboard State Aid data – New dissemination tool for statistics (2000-2022) https://competition-policy.ec.europa.eu/state-aid/scoreboard/scoreboard-state-aid-data_en
[15] Ibid.
[16] Owen, G. (2012). Industrial policy in Europe since the Second World War: what has been learnt?. ECIPE Occasional paper, No. 1/2012. https://ecipe.org/wp-content/uploads/2014/12/OCC12012-revised.pdf
[17] Goldwyn, D. L. and Clabough, A. (2023, August 7). A year after the IRA, industrial policy has gone global. Now what?. Atlantic Council. https://www.atlanticcouncil.org/blogs/energysource/a-year-after-the-ira-industrial-policy-has-gone-global/
[18] Holland, S. (2025, January 22). Trump announces private-sector $500 billion investment in AI infrastructure. Reuters. https://www.reuters.com/technology/artificial-intelligence/trump-announce-private-sector-ai-infrastructure-investment-cbs-reports-2025-01-21/
2. The EU’s Industrial Policy Revival: What Shape Is It Taking?
European industrial policy has made a return. Government interventions in the EU economy, primarily in the form of state aid, have reached record levels, both in absolute terms and as a percentage of GDP. However, since the early 1990s, the significance of such interventions in supporting industry and services had declined dramatically for at least two decades.
The share of GDP devoted to industrial policy action in the EU fell sharply, nearly halving from approximately 0.9 per cent of GDP in 1992 to around 0.5 per cent in the early 2000s. This trend stabilised over the course of the first decade of the new century, fluctuating between 0.5 and 0.6 per cent.[1] By the early 2010s, however, as the financial crisis exposed market failures, and industrial policy crept back in from the rear door presumably to correct them, state aid interventions slowly but surely gained new momentum. With the advent of the COVID-19 pandemic, the energy crisis triggered by the Russian invasion of Ukraine, and efforts to transition Europe to a net-zero economy, state aid measures skyrocketed. In 2020, state aid expenditure reached a peak of 2.4 per cent of EU GDP, remained stable at 2.3 per cent in 2021, and then declined to 1.4 per cent of GDP in 2022.[2] Nevertheless, this level still represents the third highest since the early 1990s.
On top of spending volume, however, the critical question is whether the composition of the EU’s industrial policy expenditure resembles that of other advanced economies, or if it represents a distinct model. Furthermore, it is essential to examine how these potentially differing policy approaches compare in terms of effectiveness and outcomes.
To begin, it is essential to briefly explore the main instruments of industrial policy. One way to understand the various forms that industrial policy assistance to businesses can take is to liken it to a child’s lemonade stand. After all, in its most basic yet straightforward form, lemonade stands can be considered “a symbol of capitalism and entrepreneurship,” as somebody claimed.[3]
Consider Emma, who dreams of starting her own lemonade stand. Her parents have several ways to support her. The most straightforward is to give her €20 upfront for supplies – akin to (direct) grants[4] in industrial policy. While this helps cover initial costs, it does not necessarily push her to perform better or outcompete other neighbourhood stands, especially if given later when she is struggling.
Alternatively, Emma’s parents might let her use her savings and promise extra pocket money if she does well, or waive her monthly contribution to the family piggy bank – this is what the literature calls tax concessions.[5] They could also lend her €20, requiring repayment, or invest €10 in exchange for a share of her profits, mirroring loans and equity instruments,[6] respectively. In both cases, her parents share in the risk and rewards, encouraging responsible business growth.
To foster innovation, they might offer a €5 bonus or discount to experiment with new lemonade recipes, resembling R&D incentives. Other support measures could include setting up an umbrella for her stand, improving infrastructure, or limiting competition by instructing her siblings not to open rival stands – similar to protectionist policies. The possibilities are vast, but the message is clear: just as Emma’s parents have a range of strategies to support her, governments also have a broad array of policy options to assist businesses, each taking different forms.
With this foundation in mind, let us now look into which of these tools the EU has preferred to employ so far. By narrowing the focus to state aid measures – the set of fiscal industrial policies for which we have the most comprehensive and comparable dataset across EU Member States – we are met with an interesting set of observations. These are illustrated in Figure 1 below.
The composition of state aid expenditures in the EU has fluctuated and evolved significantly over the first two decades of the 21st century. However, throughout the entire period, direct grants have consistently accounted for the largest share of EU state aid measures. Tax concessions have ranked second, while loans, guarantees, equity instruments, and other forms of state aid played a negligible role until the onset of the COVID-19 crisis.
With the pandemic, the relative weight of direct grants dropped markedly in 2020 and 2022, making way for increased reliance on loans and equity instruments, as well as a modest resurgence of tax concessions and other forms of state aid. Nevertheless, this shift does not imply a reduction in direct grants in absolute terms. Rather, their relative importance declined while the overall size of state aid expenditure expanded. Between 2020 and 2022, the annual volume of direct grants averaged approximately 1 per cent of EU GDP – EUR 150 billion – two and a half times the average of the preceding two decades.
Even with their relative share reduced, direct grants continue to dominate state aid expenditure. As a proportion of the total, they still represent at least twice the individual weight of all other categories, thus pointing to their enduring significance in the EU’s industrial policy toolkit.
Figure 1: State aid expenditures as a share of GDP by broad categories of state aid instruments in the EU-27, 2000–2022 (percentage of EU-27 GDP)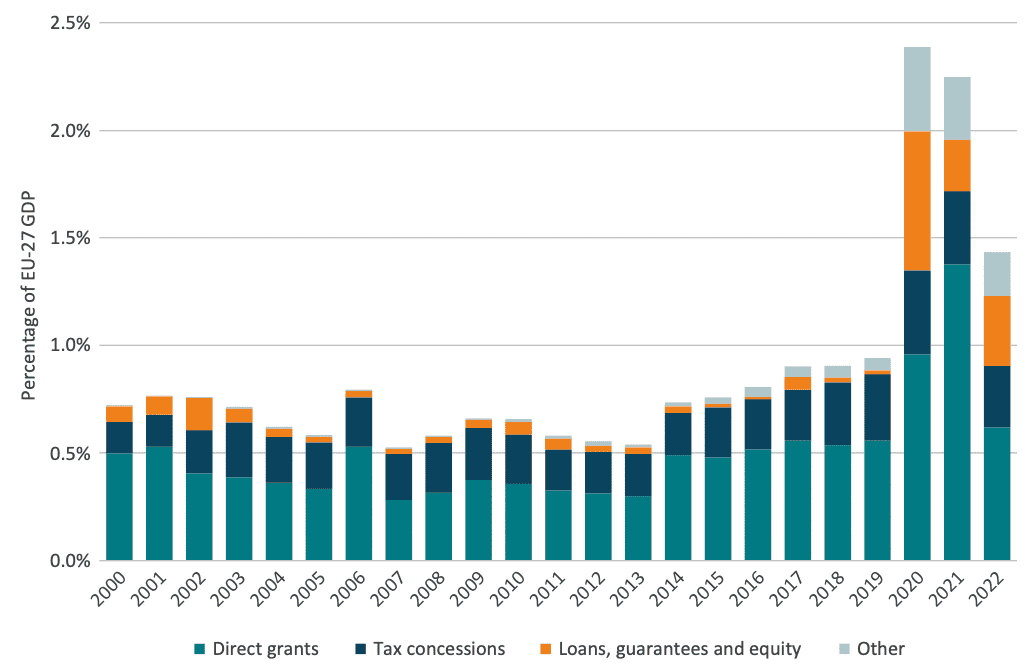 Source: Authors’ calculation based on European Commission Scoreboard State Aid data. Note: The four broad categories of state aid instruments presented here were developed by ECIPE through the grouping of a more extensive set of items categorised by the European Commission.
Figure 1 provides valuable insight into the EU’s overall state aid strategy over the past two decades. However, it does not shed light on the differences between individual Member States’ approaches to industrial policy. Aggregate data may conceal significant disparities in tactics employed by different countries. This is where Figure 2 comes to the rescue, offering a detailed breakdown of state aid instruments as a share of national GDP across all 27 EU Member States.
Figure 2: Cumulative state aid expenditure by broad categories of state aid instruments as a share of national GDP for EU-27 Member States, 2000–2022 (percentage of national 2022 GDP)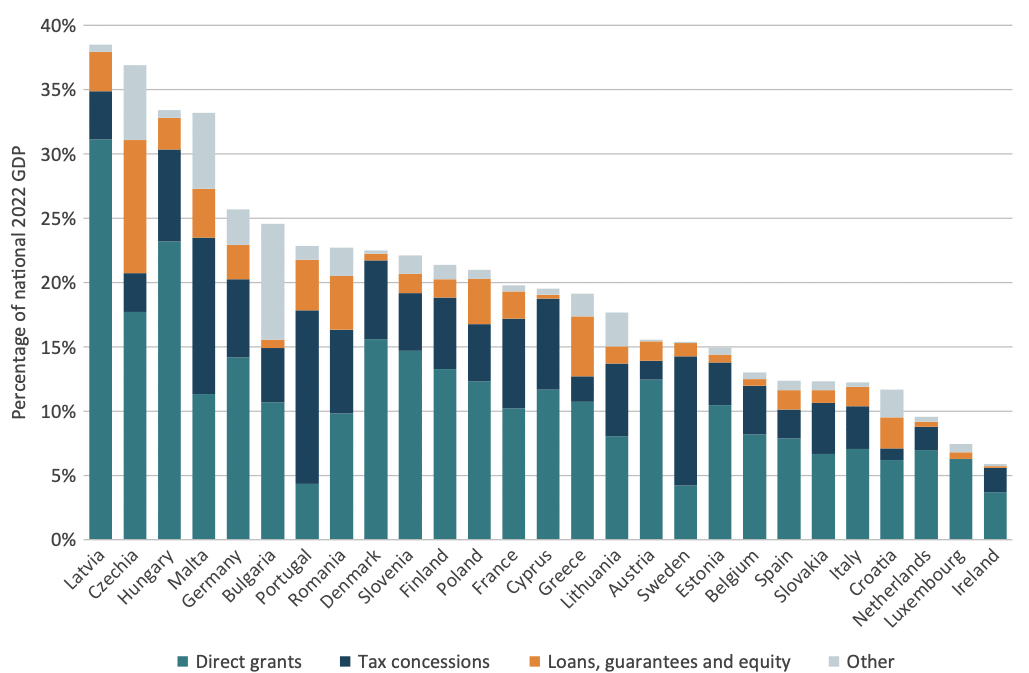 Source: Authors’ calculation based on European Commission Scoreboard State Aid data. Note: The four broad categories of state aid instruments presented here were developed by ECIPE through the grouping of a more extensive set of items categorised by the European Commission.
Figure 2 aggregates all state aid expenditures by different instruments between 2000 and 2022 for each EU Member State, dividing them by the country’s GDP in 2022. Interestingly, a first observation is that there is no clear pattern in the share of state aid spending relative to GDP across countries. Contrary to common assumptions, traditionally frugal countries such as Denmark, Austria, and Sweden have devoted a larger share of their GDP to industrial policy spending over the past two decades than Spain, Italy, and Ireland. Notably, despite its vast economy – where measuring as a share of GDP usually tends to overstate the figures for smaller countries – Germany places very high, fifth overall.
Moreover, while the chart highlights considerable variation in the mix of state aid instruments used across EU Member States, one trend stands out: in 24 out of 27 countries, direct grants represent the largest single component of state aid. Only Malta, Sweden and Portugal diverge from this pattern, with the latter two in particular prioritising tax-based state aid over direct cash transfers to businesses.
In summary, what is striking is the extent to which the vast majority of Member States still rely on state aid, and how they favour direct grants over other forms of government support to the private sector, with only a very few exceptions.
[1] Schito, M. (2021). The politics of State aid in the European Union: explaining variation in aid allocation among Member States. Journal of Public Policy, 41(2), 277–306. https://doi.org/10.1017/S0143814X2000001X
[2] European Commission. (2024). State aid scoreboard 2023. Directorate-General for Competition. https://competition-policy.ec.europa.eu/document/download/0b2037c5-c43f-4917-b654-f48f74444015_en
[3] McNish, J. (2017, February 6). Lemonade stands and how to foster innovation. Policy Options. https://policyoptions.irpp.org/magazines/february-2017/lemonade-stands-and-how-to-foster-innovation/
[4] OECD. (2023, April). Government support in industrial sectors: A synthesis report (OECD Trade Policy Paper No. 270). https://www.oecd.org/en/publications/government-support-in-industrial-sectors_1d28d299-en.html
[5] Ibid.
[6] Ibid.
3. Alternative Models of Industrial Policy
Given the inherent complexity of industrial policy, learning from diverse models is crucial for designing effective strategies. This chapter examines the US Inflation Reduction Act (IRA) model, the South Korean model, the Swiss model, and the Irish model – each offering valuable insights for policymakers.
The US approach highlights the role of large-scale tax incentives in driving private green investment. South Korea’s model of state-led strategic sectoral support and Switzerland’s emphasis on innovation-driven public and higher education spending demonstrate effective R&D industrial policy examples. Finally, Ireland’s success in attracting Foreign Direct Investment (FDI) through favourable regulatory and tax policies further illustrates another pathway to industrial success. By analysing these models, the chapter aims to extract key lessons that can help the EU navigate economic uncertainty and improve its own industrial policy framework.
3.1 The US Inflation Reduction Act (IRA) Model: Tax Incentives to Boost Private Investment
One of the most prominent and cohesive examples of industrial policy in recent times has not emerged from Europe but rather from the US. The Biden administration’s Inflation Reduction Act (IRA) of 2022 has been described as the most significant piece of climate legislation in US history[1] and ranks among the most ambitious endeavours of the kind globally. The IRA also contains provisions designed to reform taxation, reduce the federal government’s budget deficit, and lower prescription drug prices.
Notably, the IRA is the third in a streak of major legislative initiatives since 2021 aimed at boosting US economic competitiveness, innovation, and industrial productivity, following the Infrastructure Investment and Jobs Act (IIJA) and the CHIPS and Science Act.[2] Focusing on the IRA and its energy-related provisions, its stated objectives are to cement the US’s leadership in domestic clean energy manufacturing and to set the nation on a trajectory to achieve a net-zero economy by 2050, alongside other climate goals.[3]
According to an analysis by McKinsey & Company, corroborated by similar studies from other research centres, including the Congressional Budget Office,[4] the total funding volume for the climate and energy section of the IRA is estimated at just under USD 400 billion through 2031.[5] Excluding tax incentives for consumers and unspecified “federal operations” from the overall sum, the remaining amount is USD 338 billion in incentives for private sector investment in clean energy, transport, and manufacturing. Of this USD 338 billion, USD 216 billion – representing 64 per cent of the total – is allocated as tax credits for corporations, while USD 82 billion (24 per cent) and USD 40 billion (12 per cent) are designated for grants and loans, respectively.
Even to the most untrained eye, it is evident that the IRA’s policy mix heavily favours tax-based incentives over direct grants or loans, in contrast to the EU’s broader approach to state aid. Putting estimates aside, more than two years into the IRA’s implementation, we can now examine real-world data. According to a study by the Rhodium Group and the MIT Center for Energy and Environmental Policy Research, assessing the initial impact of the IRA, federal expenditure on clean technologies during this period amounted to USD 78.4 billion. Of this total, USD 76.2 billion – approximately 97 per cent – was allocated as tax credits, while only USD 2.2 billion – 3 per cent of the overall funding volume – included grants, loans, and loan guarantees.[6] Evidence from the initial two years of policy implementation shows an even greater emphasis on tax incentives with respect to other industrial policy instruments than previously estimated.
The IRA’s industrial policy model contrasts sharply with the EU’s overarching approach to state aid. However, a more accurate comparison between the US IRA and the EU should focus specifically on European green industrial subsidies rather than encompassing all state aid measures. The most notable policy framework for green initiatives in Europe has been the European Green Deal, unveiled in late 2019. Under this framework, the European Commission has introduced various policy measures, ranging from new regulations to stricter carbon pricing mechanisms. However, in its industrial dimension, the financing of the Green Deal is predominantly undertaken by individual Member States rather than through a common EU funding mechanism.[7] This trend has become even more pronounced since February 2023, when the European Commission, responding to perceived threats to EU competitiveness posed by the IRA, introduced the Green Deal Industrial Plan. This plan aims to streamline the regulatory environment and accelerate state aid funding for clean technology investments in Europe through a temporary, ad hoc framework.[8]
The effects of the Green Deal Industrial Plan of 2023 cannot yet be assessed, as state aid data is only available up to 2022. However, national green subsidies to industry in the EU have been growing steadily long before 2023 and even prior to the introduction of the European Green Deal in 2019. Figure 3 illustrates the evolution of total state aid measures since 2000. The blue line represents all state aid, including subsidies aimed at “Environmental protection, including energy savings” – what could colloquially be termed green subsidies. The orange line, by contrast, excludes them.
For simplicity, and to focus on the topic of interest, state aid categorised under “Remedy for a serious disturbance in the economy” – comprising industrial subsidies deployed during the COVID-19 pandemic and to mitigate the effects of the Russian invasion of Ukraine, accounting for over half of all state aid measures – has been excluded from both lines for the years 2020, 2021, and 2022.
What is most striking is that, while the two lines remained virtually parallel during the first 14 years under consideration, indicating that green subsidies had remained relatively stable during this period, the curves began to diverge significantly from 2014 onwards. One can confidently assert that, excluding COVID-19 and war-related subsidies between 2020 and 2022, nearly all of the growth in EU state aid since 2014 has been driven by green subsidies.
The 2019 European Green Deal appears to have had minimal impact on trends in state aid to the private sector, as green subsidies had already begun to rise five years earlier, in 2014. This turning point corresponds to the European Commission’s introduction of new guidelines on state aid for environmental protection and energy. These guidelines introduced, among others, the concept of the “incentive effect,” stipulating that state aid should encourage beneficiaries to modify their behaviour and improve environmental protection, rather than merely compensating them for routine business expenses.[9]
Figure 3: Trends in total state aid (blue line) and total state aid excluding green subsidies (orange line) in the EU-27, 2000–2022 (billions of euros, constant prices)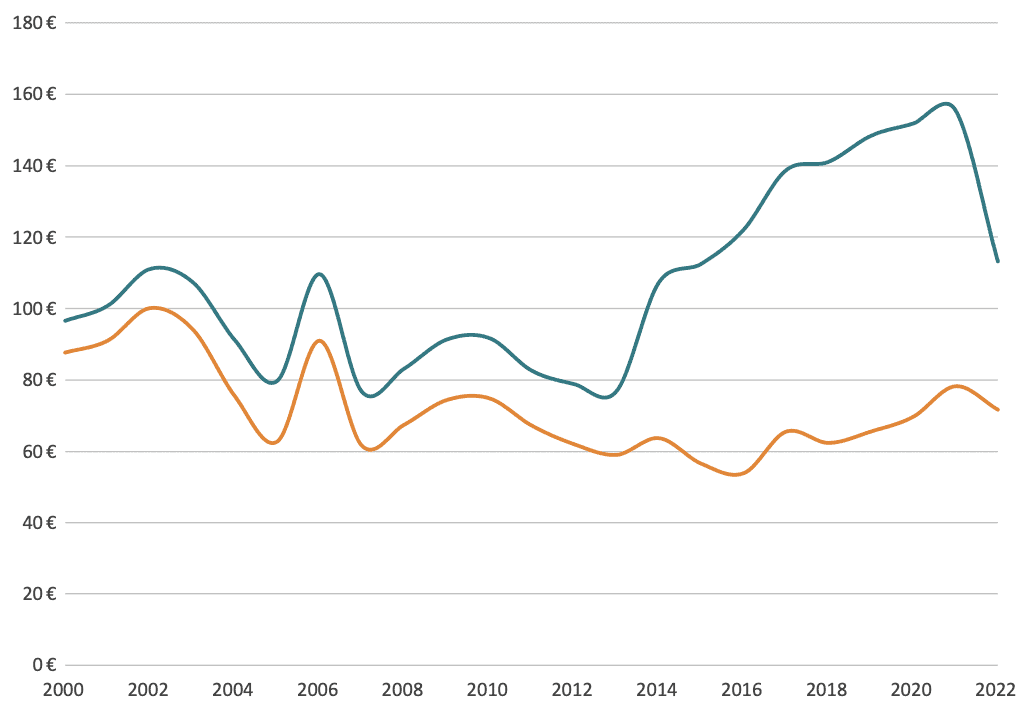 Source: Authors’ calculation based on European Commission Scoreboard State Aid data. Note: Green subsidies refer to state aid measures categorised under “Environmental protection, including energy savings.” State aid measures categorised under “Remedy for a serious disturbance in the economy” have been excluded for the years 2020, 2021, and 2022.
Although not entirely comparable – the IRA is a federal policy, whereas state aid comprises a collection of national interventions – EU green subsidies to industry between 2014 and 2022 amounted to over EUR 600 billion. This is almost twice the USD 338 billion estimated for the IRA during the 2023–2031 period.
Beyond the sheer volume of green industrial funding, let us now examine the nature of these subsidies. For the sake of comparability, we will focus on the two years following the implementation of the IRA – from mid-2022 to mid-2024 – and the two years after the announcement of the European Green Deal in late 2019, namely 2020 and 2021. A narrower comparison between the IRA and the green subsidies authorised after the European Green Deal is particularly relevant, as the European Green Deal also aims to achieve climate neutrality by 2050 and to position the EU as a global leader in the green transition.[10] These objectives are virtually identical to those set out in the IRA.
Figure 4 presents a detailed breakdown of post-IRA and post-European Green Deal assistance to businesses across the four broad categories of industrial policy instruments outlined earlier, measured as a share of GDP. The first, unsurprising yet striking, observation is that over a comparable two-year period, EU green subsidies amounted to nearly three and a half times those allocated by the US relative to the size of their respective economies.
Equally unsurprising is the stark difference in the composition of these subsidies between the two regions. In the US, nearly all subsidies take the form of tax concessions, whereas tax-based incentives account for only 36 per cent of EU green subsidies. Once again, the lion’s share of EU green state aid – constituting 57 per cent of the total – is in the form of direct grants. In fact, the total value of EU grants is twice the entire IRA investment as a share of GDP and remains larger even in absolute terms.
The truth is that state aid in the EU, even in climate-related matters, frequently translates into direct transfers. This trend is expected to intensify further under the Green Deal Industrial Plan of 2023, which introduces additional flexibility for green state aid to businesses, and under the Clean Industrial Deal presented in February 2025, which further relaxes state aid rules, allowing Member States to provide direct subsidies for clean industries.[11]
Figure 4: Distribution of green subsidies funding by industrial policy instrument for EU-27 state aid (2020–21) and for the US IRA (mid–2022 to mid–2024) (percentage of GDP)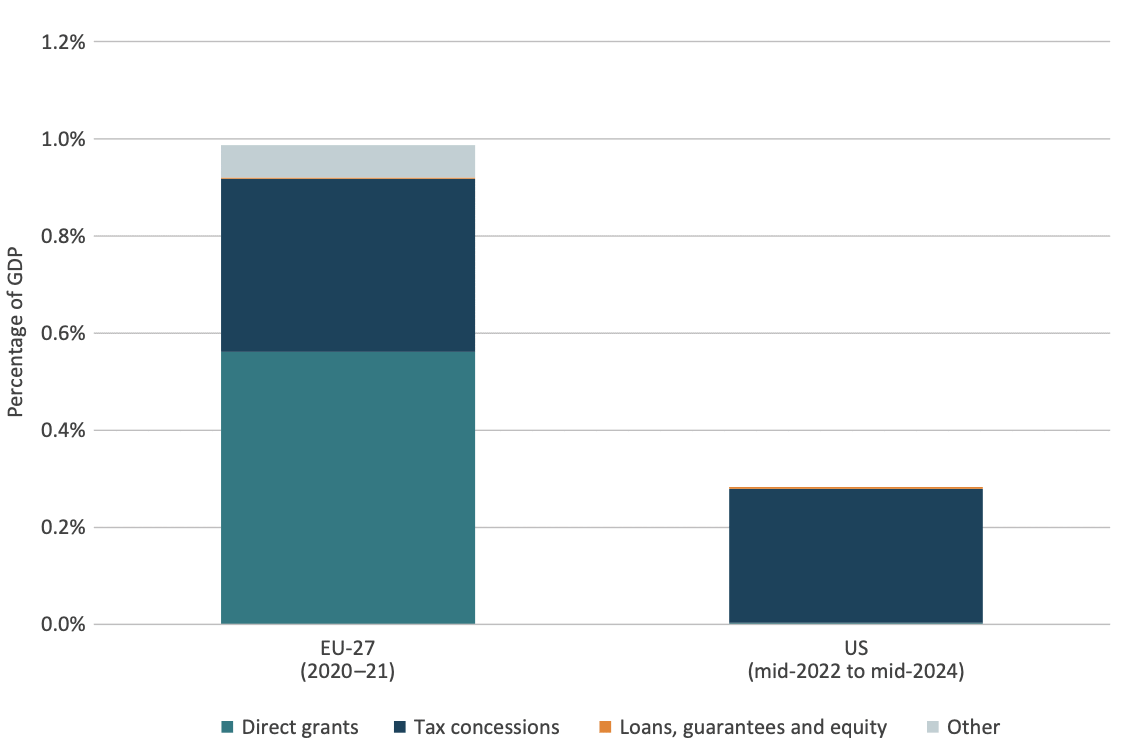 Source: Authors’ calculation based on European Commission Scoreboard State Aid data, Rhodium Group and MIT CEEPR. Note: The four broad categories of industrial policy instruments presented here were developed by ECIPE through the grouping of a more extensive set of items categorised by the European Commission and were also applied to the US IRA.
Significant differences have been demonstrated in the policy approaches adopted by the EU and the US regarding green industrial policy. However, as with all forms of policy, industrial initiatives such as the European Green Deal – and its associated state aid measures – and the US IRA must ultimately be assessed based on their ability to achieve their stated objectives. As mentioned, both policies share the same overarching goals: transitioning to a climate-neutral economy by 2050 and securing global leadership in clean technology production.
Setting aside climate policy considerations, and adopting a more familiar political economy perspective, we turn our attention only to the second of the two shared objectives of the European Green Deal and the US IRA: securing leadership in the green transition.
Focusing first on the US and its production dimension, the two-year evidence from the post-IRA period is markedly unambiguous. Data indicates that between mid-2022 and mid-2024, private investment in clean technologies was estimated to be 5-6 times greater than public investment, totalling USD 493 billion compared to USD 78 billion. This reflects a 71 per cent increase compared to the two years preceding the legislation.[12]
Even more strikingly, investment in manufacturing clean energy and transportation technologies saw the most rapid growth, surging to USD 89 billion during the post-IRA period – over four times the USD 22 billion invested in the two years preceding the IRA’s implementation. This remarkable inflow of private capital highlights the catalytic effect of the IRA’s federal incentives, particularly its tax provisions, in stimulating private investment.[13]
During the post-IRA period, investments in emissions-reducing technologies have accounted for over half of the total growth in US private investment[14] and now represent a record 5 per cent of total US private investment.[15] From a clean tech production perspective, the IRA can be said to have largely delivered on its objectives.
Evaluating the industrial production impacts of the European Green Deal presents a greater challenge. Unlike the IRA, the Green Deal encompasses a diverse array of policies administered across multiple levels of government – Union, national, and regional. In the realm of climate tech startups, as in many other sectors, the EU excels in fostering the early stages of technology developments. However, European clean tech companies encounter a far more challenging venture capital landscape compared to their counterparts in the US and China. Current data reveals that for clean tech scale-up companies, the investment gap stands at approximately EUR 50 billion across six clean technologies.[16]
Changing focus from the climate startup ecosystem to the broader Green Deal Industrial Plan of 2023, the outlook is similarly concerning. Although introduced in response to the IRA, the Plan lacked any new, ad hoc funding mechanisms to bolster clean tech manufacturing. Instead, it relies on individual Member States’ state aid initiatives to fill the gap, much as it has done in the past and is expected to continue doing in the years ahead. The Clean Industrial Deal of early 2025 follows the same logic, as it relies on redirecting existing EU funds rather than creating entirely new financing streams, with national governments playing a key role in direct subsidies.
As the European Green Deal does not constitute a cohesive policy framework akin to the IRA, no dedicated policy assessment studies exist to evaluate its industrial effects. However, total investment in the energy transition can serve as a proxy for the effectiveness of green subsidies in the EU, similar to methods used to assess the industrial impacts of the IRA.
Figure 5 illustrates the evolution of overall energy transition spending – both public and private – in the 2021–2024 period for the EU and the US, based on publicly available data from Bloomberg New Energy Finance (BloombergNEF). On the positive side, the data reveals a steady year-on-year increase in clean energy investment in both regions, with an accelerating pace. However, the concerning news for the EU is that the US has been steadily closing the gap.
While the disparity in total energy transition spending was still significant in 2021, it progressively narrowed over subsequent years. In 2023, both regions experienced substantial increases in low-carbon technologies investment. In the EU, this was driven by government responses to the global energy crisis and the reduction in Russian gas supplies following Putin’s invasion of Ukraine.[17] However, the US witnessed an even greater surge, largely due to the initial impact of clean energy investment legislation – chiefly the IRA.[18],[19]
In 2024, clean technology investment slowed in both the EU and the US following the rapid expansion of 2023. However, the deceleration was more pronounced in the EU than in the US. At present, total energy transition investment in the US is only 11 per cent lower than in the EU in absolute terms – a marginal difference given that the EU injected over EUR 200 billion into green state aid subsidies between 2020 and 2022, compared to less than USD 80 billion allocated under the IRA from mid-2022 to mid-2024.
Figure 5: Total energy transition investment in the EU-27 and the US, 2021–2024 (billions of US dollars)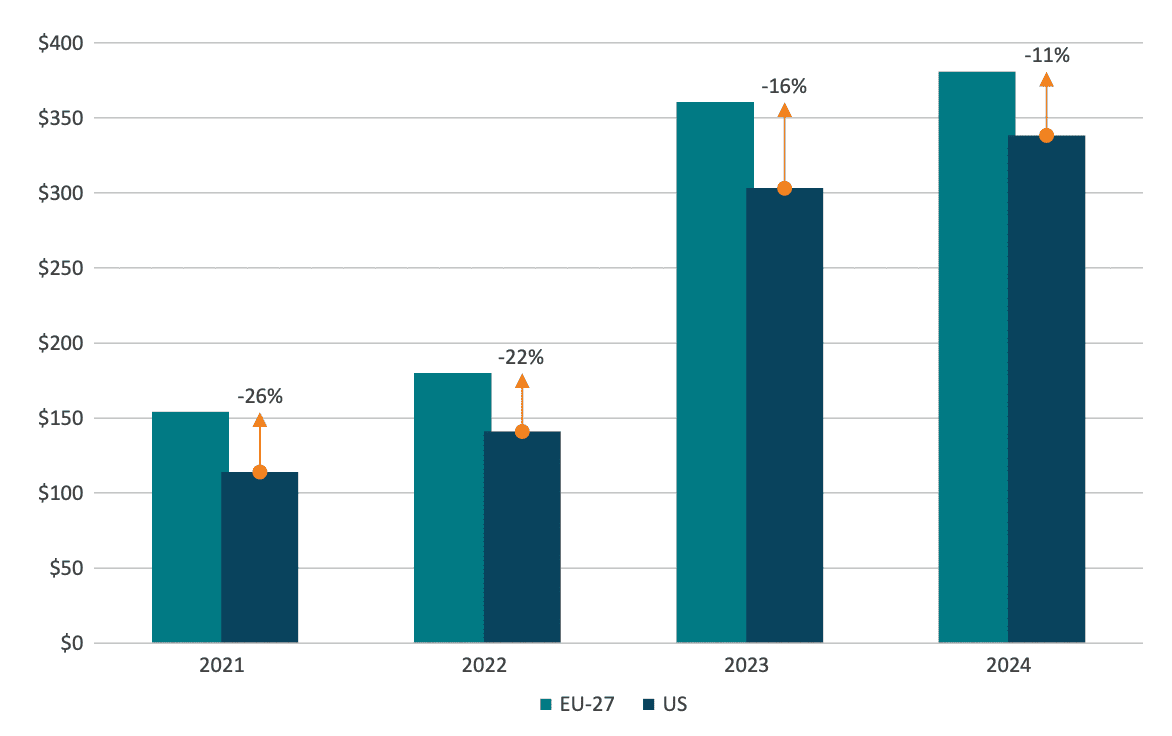 Source: Authors’ calculation based on BloombergNEF Energy Transition Investment Trends 2022–2025[20],[21],[22],[23] data.
The IRA is by no means the panacea for all ills: its actual cost may also exceed initial projections. Yet it still demonstrates a far better cost-effectiveness ratio than comparable European green subsidies. The primary reason for this lies in its different incentive structure. Unlike direct grants, tax credits are only available to companies that are already profitable, encouraging additional private investment rather than replacing it with public funds. In contrast, direct grants risk crowding out private investment, as firms receiving public money have no obligation to invest and generate profits themselves. This incentive structure likely explains the stronger alignment between the IRA and overall higher levels of investment growth in the US compared to the EU. To go back to Emma and her lemonade stand, if she knows her parents will cover her expenses regardless of her sales, she has little motivation to maximise her effort.
Secondly, tax incentives under the IRA are broadly available to any company that meets the eligibility criteria, ensuring a more neutral approach, at least in principle. In contrast, EU state aid schemes tend to be highly selective, favouring specific companies over others. This reflects a longstanding European tendency to pick winners in advance rather than focusing on broader economic outcomes.
Table 1: Main features of the US IRA model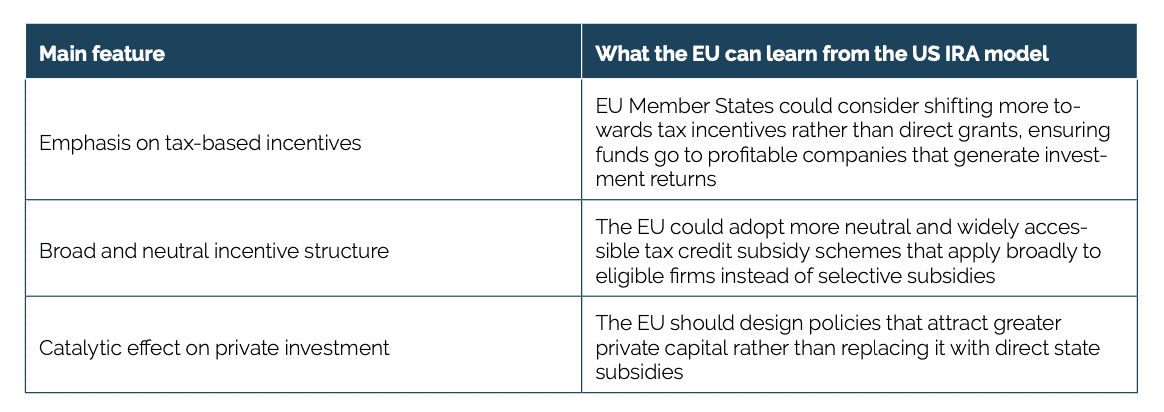
3.2 R&D Industrial Policy: Evidence from Switzerland and South Korea
As mentioned, industrial policy, in its broadest sense, refers to any form of government intervention aimed at reshaping a country’s economic structure. With this definition in mind, it becomes evident that industrial policy extends well beyond the mere implementation of targeted measures, such as the green subsidies discussed earlier. It also encompasses broader efforts to influence the overall composition of a country’s economy. For instance, one aspect of industrial policy is shaping a nation’s technological profile – essentially, determining the balance of high, medium, and low-technology sectors that dominate its industrial base.
It has been extensively demonstrated that one of the principal factors behind the EU’s loss of competitiveness in recent decades is a systemic neglect of innovation.[24],[25] The EU has consistently underspent on R&D compared to its peers. For instance, Switzerland invests 1.6 times more in R&D as a share of GDP, and South Korea allocates 2.5 times more.[26] Compounding this, the EU’s economic structure is disproportionately weighted towards sectors with lower R&D intensity. Mid-tech industries, such as automotive manufacturing, play a more significant role in the EU compared to high-tech, R&D-intensive sectors like ICT production in South Korea[27] or pharmaceutical development in Switzerland.[28] Obviously, sectors with medium – or even low – R&D intensity still feature firms with high R&D intensity: large sectors have thousands and thousands of firms with big differences in their firm size and R&D intensity distribution. However, it is notable that the average sector performance of large industrial sectors in Europe has been weak, let alone stagnant, and has not developed R&D intensities comparable to its peers. This structural bias contributes to the EU’s comparatively lower overall R&D intensity and has led some observers to suggest that the bloc is caught in a “middle technology trap.”[29]
Figures 6a and 6b below illustrate the distribution of privately funded R&D expenditure by industrial sector, first as a share of GDP and then as a share of total spending, for the EU, South Korea, and Switzerland.
Figure 6a reveals a striking trend: business R&D spending in the EU amounts to just over half that of South Korea and only a third of Switzerland’s when measured relative to the size of their respective economies. Figure 6b provides a sectoral breakdown of business R&D expenditure as a share of total spending, offering greater insight into the weight of different industries within each economy. In the EU, as expected, the automotive sector dominates R&D spending, though only with a relative majority. In contrast, in South Korea and Switzerland over 60 per cent of the business R&D expenditure comes from ICT producers and health industries,[30] respectively. Interestingly, when combining the three sectors with a higher technological profile – ICT services, ICT producers, and health industries – the EU’s total barely exceeds 40 per cent of the total R&D expenditure. By comparison, this figure approaches 70 per cent in both South Korea and Switzerland. In other words, the European middle technology trap is in the numbers.
Figure 6a and 6b: Business R&D spending distribution by industrial sector for the EU-27, South Korea and Switzerland as a share of GDP (top) and total spending (bottom), 2023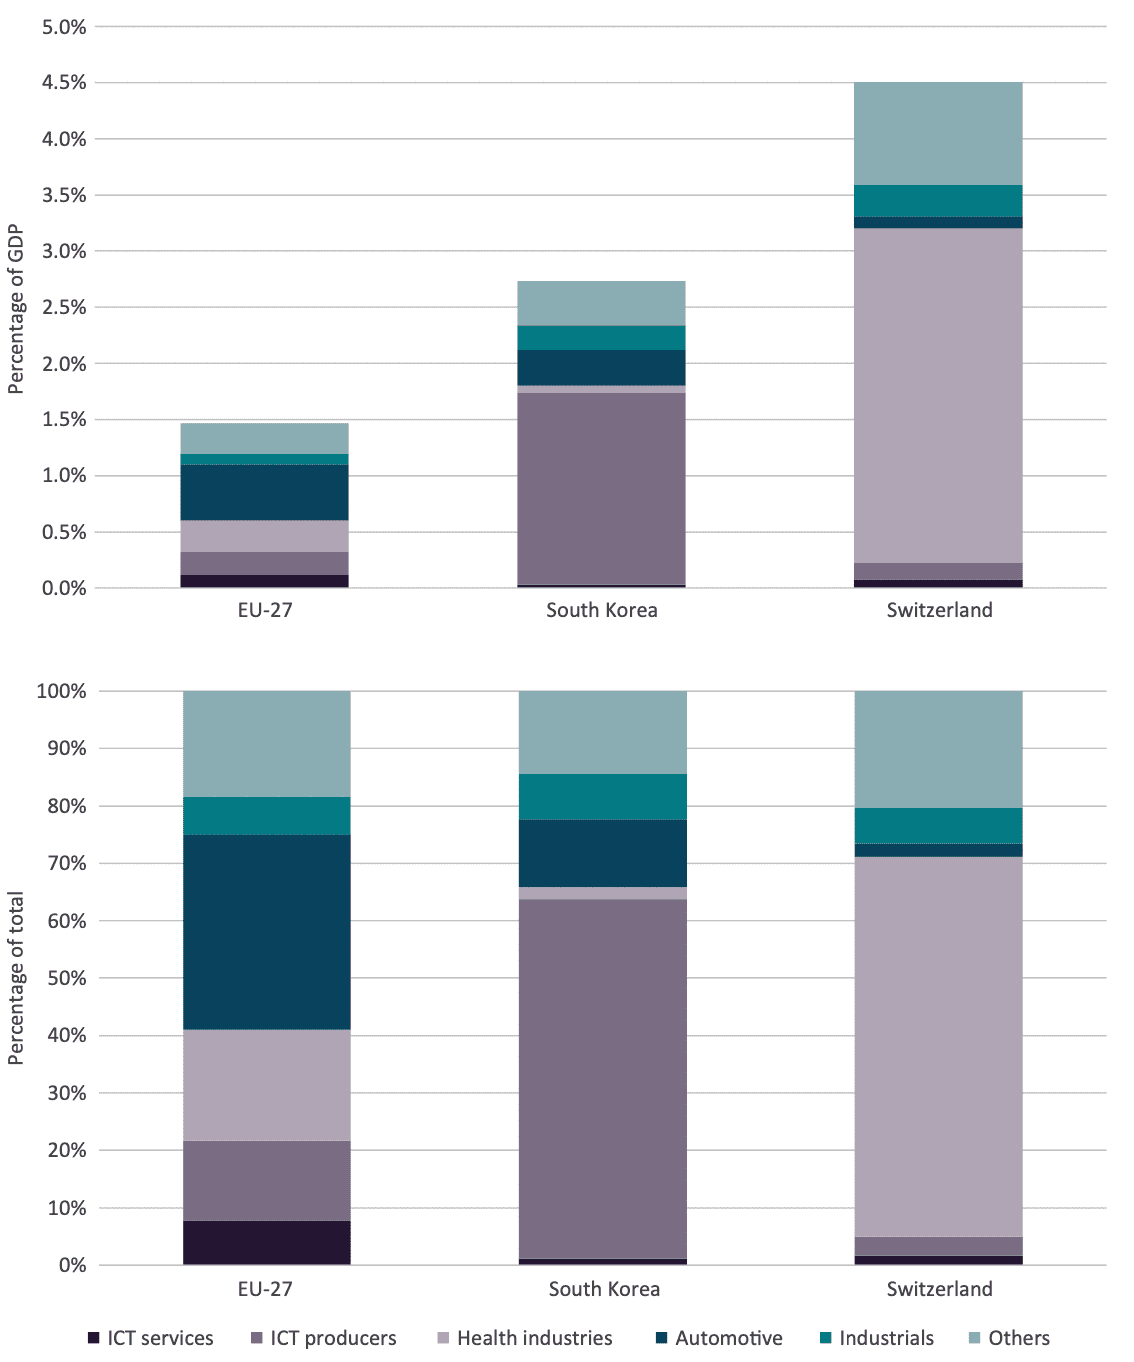 Source: Authors’ calculation based on the 2024 EU Industrial R&D Investment Scoreboard[31].
Moreover, solid evidence reveals that the bulk of R&D underinvestment in the EU occurs in the private sector.[32] However, this does not imply that public sector actors are powerless. On the contrary, they can play a crucial role in fostering or hampering conditions that encourage greater private sector R&D investment and more R&D investment towards higher tech sectors. This is precisely where industrial policy comes into play.
There is a prevailing sense that industrial policy in the EU does little to foster innovation, particularly in high-tech sectors. A closer look at the data confirms that this is more than just a perception. Figure 7 below presents the breakdown of state aid subsidies to the manufacturing sector by technology level across EU Member States for the period 2016–2019.
The findings are striking: in every country analysed, the vast majority of subsidies are allocated to middle technology industries – ranging from medium-low technology sectors such as food product manufacturing, through medium tech industries like rubber and plastic products manufacturing, to medium-high technology manufacturing, including machinery, and motor vehicles. In contrast, only a small proportion of subsidies are directed towards high-tech sectors, such as manufacturers of pharmaceuticals.
Figure 7: Breakdown of state aid subsidies to the manufacturing sector by technology level for EU-27 Member States, 2016–2019 (percentage of total)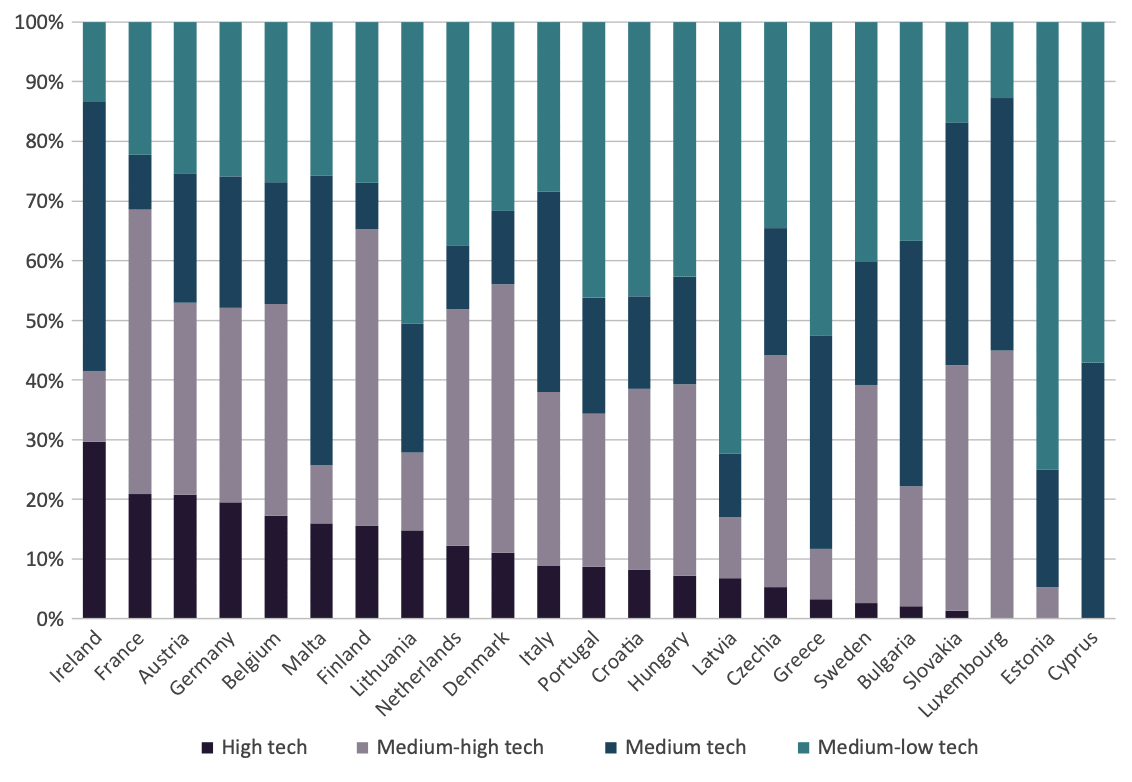 Source: Authors’ calculation based on State Aid Transparency Public Search data.[33],[34]
Note: Data for Poland, Romania, Spain, and Slovenia was not included as it is not available. Technology levels are determined according to the OECD taxonomy of economic activities, which categorises industries based on R&D intensity following the ISIC Rev. 4 / NACE Rev. 2 two-digit classification.
Thus, Europe’s industrial structure is already skewed towards middle technology industries, and state aid policies seem to further reinforce this imbalance. In effect, the EU’s “middle-technology trap” is also a “middle-technology subsidy trap.” But EU policymakers can change this orientation by drawing inspiration from international models. Countries such as South Korea and Switzerland offer distinct yet equally valuable approaches to strategically guiding private R&D investment, fostering innovation, and boosting competitiveness.
3.2.1 The South Korean Model: R&D Incentives for Innovative Industries
South Korea does not significantly diverge from EU Member States in terms of the extensive role its government plays in shaping the economy’s structure. In fact, South Korea stands as one of the most influential and well-documented examples of large-scale industrial policy since at least the 1970s.[35] This is especially evident in the area of R&D. Through targeted government intervention, South Korea has dramatically increased its R&D investment as a share of GDP, rising from levels lower than those of the EU in the 1990s to achieving the second-highest percentage globally, surpassed only by Israel. Notably, this progress has been largely driven by innovation efforts within its private sector, spurred by government initiatives.[36]
One of the most successful examples of South Korean industrial policy had a very specific target: increasing business-level R&D expenditure in technologically advanced sectors. It was called the G7 Programme (G7P). Recognising that the required investments were either too substantial or insufficiently profitable for individual companies to undertake alone, the programme’s objective throughout the 1990s was to boost private sector R&D in select frontier technologies, such as electronics, biotechnology, and energy, in order to close the gap with advanced economies.[37]
The approach centred on the idea that targeted research subsidies, combined with a pooling mechanism, could incentivise private firms to invest in frontier sectors they might otherwise avoid. By providing government subsidies and facilitating collaborative participation of multiple firms in single research projects, the programme improved the risk-reward profile of these investments. What set these projects apart was their focus on technologies with immediate commercial applications and sectors where South Korea already had existing capacities.[38]
The G7P achieved its objectives. South Korea outperformed other nations in the technological classes supported by the G7P, meeting the programme’s primary goals. Within a decade of the programme’s implementation, patenting output in the targeted technological classes had doubled and real exports in these areas had tripled compared to other technology classes. The economy made a transformative leap.[39]
Since the 1970s, South Korea has also implemented R&D tax incentives to encourage domestic R&D, continuously updating these schemes over time.[40] These programmes have also been important in helping transform South Korea into an innovation-driven economy with a high R&D intensity.[41] Over the past two decades, the scale of government tax relief for R&D spending as a share of GDP has almost tripled across most OECD countries, rising on average from 0.04 per cent of GDP in 2000 to 0.12 per cent in 2021.[42] When comparing South Korea with the EU, the magnitude of indirect government support through R&D tax incentives is relatively similar, currently standing at 0.13 per cent and 0.10 per cent of GDP, respectively.[43]
However, a closer examination of the composition of these tax incentives reveals stark variations between the two economies. Figures 8a and 8b highlight these differences. The average rate of R&D tax subsidy per unit of R&D expenditure in South Korea and the EU diverges significantly when factoring in the size of the firm receiving the subsidy and its profit status. In South Korea, while subsidy rates were broadly comparable across size and profit status in the early 2000s, they have evolved in markedly different ways since. R&D tax subsidy rates have doubled for small firms while almost disappearing for larger firms. Moreover, small and medium-sized enterprises (SMEs) in a profit-making position benefit from the highest tax subsidy rates on average, while no difference exists between profit and loss-making large firms.
In contrast, the EU has seen more uniform growth in R&D tax subsidy rates across all firm sizes and profit situations. While SMEs and large firms receive similar levels of subsidy, profitable firms – whether small or large – tend to enjoy marginally more favourable rates. Overall, all businesses in the EU enjoy broadly similar rates of R&D tax subsidy regardless of their size and independently of their profit status. External evidence suggests that this is not just a trend at the aggregate EU level but also applies broadly to virtually all individual EU Member States.[44]
Figures 8a and 8b: Implied tax subsidy rates on R&D expenditures by firm size and profit scenario for South Korea (left) and the EU-27 (right), 2000–2023 (percentage of tax support for R&D)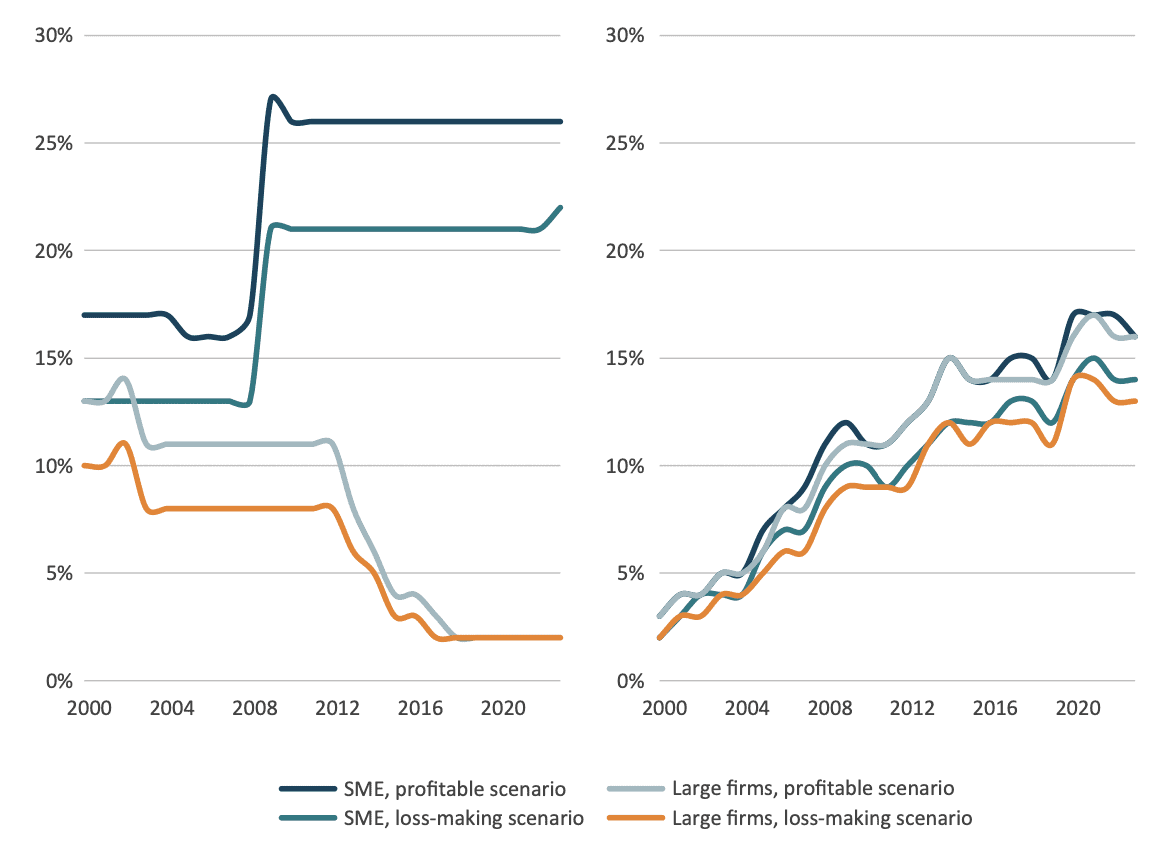 Source: Authors’ elaboration based on OECD R&D Tax Incentives database[45].
The fact that Korean SMEs benefit from an R&D tax subsidy rate that is double that of their European counterparts, while large firms in the EU enjoy similar rates of R&D tax subsidy as their smaller competitors has significant implications for the innovation capacities of the two economies. Research consistently demonstrates that small firms tend to respond more positively to innovation and other business support policies than larger firms.[46] For smaller firms, subsidies, particularly R&D tax incentives, lead to measurable improvements in activity, employment, R&D investment, and patenting.[47],[48] By contrast, large firms often accept subsidies without a corresponding increase in innovative activities.[49]
The example of South Korea shows that existing policies can be refined for greater effectiveness. While both South Korea and the EU have R&D tax incentive schemes in place, these policies deliver much better results in South Korea. The key difference lies in their allocation: South Korea directs the majority of its R&D tax relief expenditure towards SMEs that can derive genuine benefits, whereas in Europe, much of the support is extended to larger, incumbent firms that yield minimal returns on such incentives.
Table 2: Main features of the South Korean model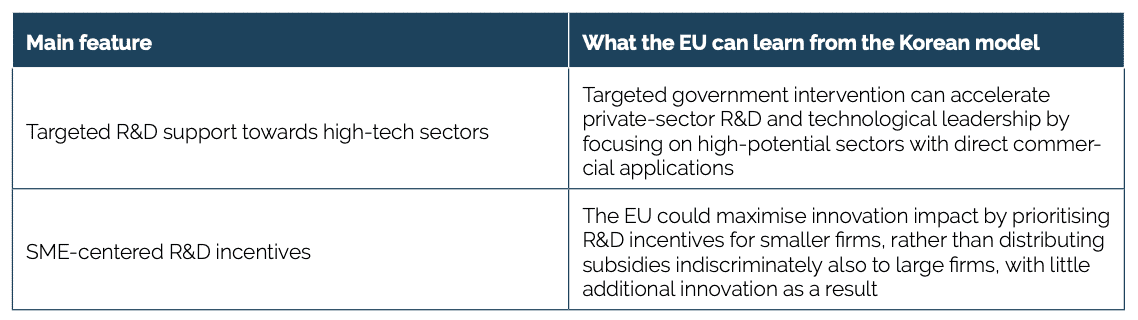
3.2.2 The Swiss Model: A Non-Industrial, Industrial Policy
Like much of Europe, South Korea has developed an industrial policy model that relies heavily on government direction and financial support for businesses. Switzerland, by contrast, presents the EU with an alternative approach to industrial policy – particularly in the realm of R&D – that scarcely resembles industrial policy at all. Rather than directly or indirectly shaping the structure of the economy, the Swiss model depends on a balanced collaboration between government, the private sector, and academia, each fulfilling its role to create optimal conditions for innovation.
As Europe and the US experience a renewed surge in industrial policy, some experts urge the Swiss government to resist joining the escalating international subsidy race. Instead, they advocate for maintaining Switzerland’s proven approach to fostering innovation – the so-called “Swiss way.”[50] But what does this approach entail, and is it truly effective? The answer to the latter part of the question is an undeniable yes. According to the United Nations’ World Intellectual Property Organization’s Global Innovation Index, Switzerland has consistently ranked as the world’s most innovative economy since at least 2011.[51] Examining its R&D model can thus offer valuable insights for EU policymakers and observers.
Compared to other leading economies, Swiss industry benefits from significantly fewer government subsidies. When considering both direct public funding for business R&D and indirect support through tax incentives, Switzerland allocates just 0.03 per cent of its GDP to these measures. This figure is markedly lower than the EU’s 0.19 per cent and South Korea’s 0.35 per cent – six and ten times more, respectively.[52]
Rather than providing subsidies or stimulating innovation through R&D tax credits, Switzerland’s public sector strengthens the nation’s innovation ecosystem by prioritising both basic and applied research. It does so through strategic programmes that foster collaboration between universities and industry.[53] By facilitating the transfer of knowledge and technology from its robust public research sector to private enterprises, Switzerland provides businesses with the essential ingredients for innovation – highly skilled labour, cutting-edge expertise, and the latest technological advancements.[54]
Figures 9a and 9b below illustrate this endeavour as they plot government budget allocations for R&D, as well as higher education expenditure on R&D as a share of GDP, for the EU, South Korea, and Switzerland over the past two decades. Both charts highlight the value Switzerland places on government and university-funded R&D and show how this commitment has grown over time. Public R&D funding in Switzerland now reaches 1 per cent of GDP – lower than in South Korea but significantly higher than in the EU. Meanwhile, higher education R&D spending in Switzerland is nearing the 1 per cent benchmark, more than double that of both the EU and South Korea as a share of GDP. With a total of 2 per cent of GDP dedicated to public sector and university research – compared to 1.8 per cent in South Korea and just 1.2 per cent in the EU – Switzerland has built a strong foundation for innovation, which the private sector can then leverage to drive further advancements.
Figures 9a and 9b: Government budget allocations for R&D (left) and Higher Education Expenditure on R&D (right) for the EU-27, South Korea and Switzerland, 2000–2021 (percentage of GDP)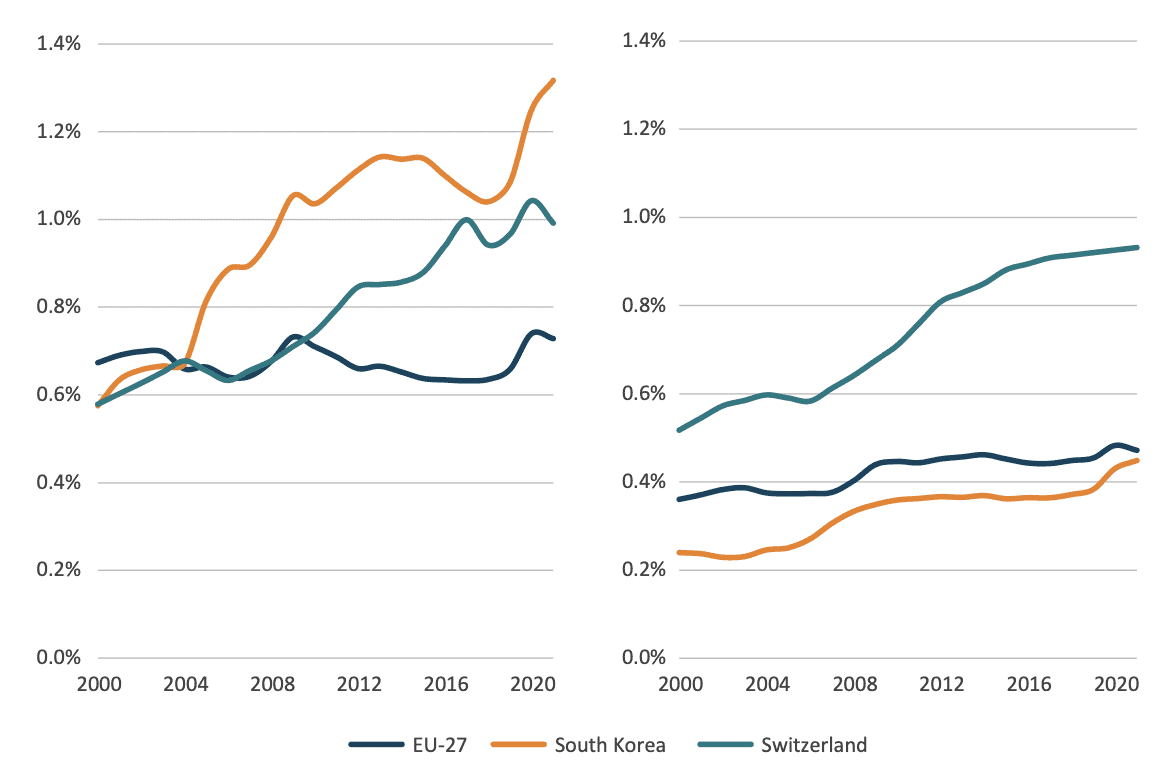 Source: Authors’ elaboration based on OECD data.[55],[56] Note: Some data points for Switzerland were unavailable; therefore, the corresponding lines were plotted by interpolating the existing values.
Swiss industrial policy more closely resembles the approach that dominated from the 1980s to the early 2000s rather than the emerging models seen elsewhere today. By investing heavily in R&D at both government and higher education levels, Switzerland creates the optimal conditions for private sector innovation to thrive independently, without the need for strong state direction or direct incentives.
A crucial pillar of Switzerland’s innovation success is its exceptional human capital. The country has consistently topped the IMD World Talent Ranking since 2014, making it the global leader in nurturing homegrown talent while also attracting skilled workers from abroad.[57] Beyond factors such as the high quality of life, Switzerland’s strength in talent competitiveness is largely driven by the private sector’s strong commitment to employee training and the widespread adoption of apprenticeship programmes, which equip workers with essential skills for the evolving economy.[58]
Switzerland’s system of Vocational and Professional Education and Training (VPET), in particular, is a distinctive and widely admired model that integrates vocational and tertiary-level education in a coherent, flexible framework. It goes well beyond the traditional notion of apprenticeships by offering a broad range of training paths, from initial vocational training in small companies to advanced professional education such as federal diplomas and degrees from professional colleges.[59]
VPET enables young people and adults to gain practical, job-oriented skills while also promoting general education, reflection, and personal development. It is highly permeable, allowing learners to move between vocational and academic tracks, and is closely aligned with labour market needs through strong collaboration between schools, training centres, and businesses. The system’s ability to adapt to economic change and maintain high employment outcomes makes it both prestigious and effective – particularly when compared to similar systems like that of Germany, with Switzerland’s version often viewed as more flexible and better integrated with industry needs.[60]
Table 3: Main features of the Swiss model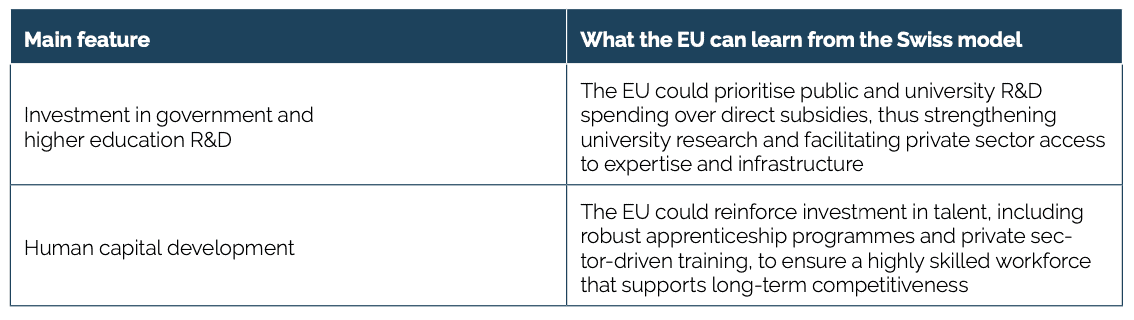
3.2.3 The Irish Model: Attracting FDI
By reshaping the structure of economic activity, industrial policy can also play a crucial role in attracting greater private investment, particularly from abroad. Since the Great Recession of 2007–08, the EU has faced a prolonged period of sluggish inward investment growth, which persists to this day, with significant consequences for productivity and overall economic prosperity.[61] In fact, as shown in Figure 10, the EU’s inward FDI has dropped remarkably in the last years.
Figure 10: The share of inward Foreign Direct Investment (FDI) in volume and relative to GDP in the EU-27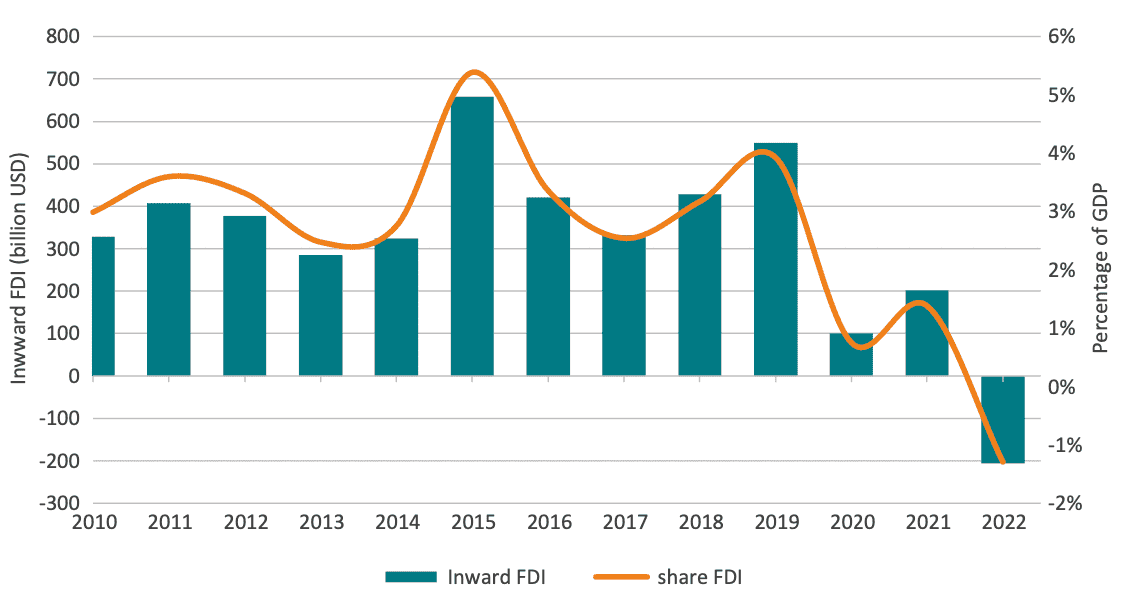 Source: Authors’ calculation based on OECD and Eurostat data.
One notable exception to this trend is Ireland. The Irish economic model has relied heavily on inward FDI and on the allocation of these investments to higher-value-added activities. As a result, these resources have transformed Ireland into one of the most successful, productive, and prosperous economies in the EU.
The relationship between FDI and productivity has been extensively studied in economic literature, with a general consensus that FDI supports productivity growth. Firstly, multinational enterprises (MNEs) tend to operate at the technological frontier, bringing advanced technology, know-how, and management practices that improve the productivity of the host economy.[62] Secondly, FDI can lead to productivity gains in local firms through spillover effects when domestic firms are capable of learning from MNEs.[63] Thirdly, in the long term, FDI can induce productivity gains by integrating local economies into global value chains.[64]
Importantly, the magnitude of these benefits depends on the host country conditions, such as human capital and institutional quality. These are two factors in which Ireland has excelled. Ireland has invested heavily in education, particularly in STEM fields, aligning workforce skills with the demands of MNEs.[65] Moreover, Ireland’s relatively low corporate tax rates, EU membership, and its cultural and linguistic ties to the US have also been instrumental in attracting FDI.[66]
The Irish Central Statistics Office estimates that the stock of FDI in Ireland increased from EUR 141 billion in 2005 to EUR 1,299 billion in 2023,[67] a percentage growth far exceeding its GDP growth during the same period. As a comparison, the stock of FDI in 2005 was equal to 79 per cent of Ireland’s GDP, while in 2023, this proportion had risen to 255 per cent. By contrast, based on Eurostat data, the stock of FDI in the EU in 2023 was EUR 18,098 billion, equivalent to 105 per cent of the EU’s GDP.[68]
It is not only the importance of FDI in the Irish economy that makes the Irish model of industrial policy stand out, but also the composition of this FDI. Ireland has targeted FDI in high-tech industries such as pharmaceuticals, ICT, and financial services, which have generated significant productivity gains and well-paid jobs. Moreover, the Irish profile of FDI is much more focused on these activities than the EU profile, which covers a broader set of economic sectors. The advantage of focusing on fewer sectors is that Ireland, despite being a small economy, has managed to create significant economic clusters with links to local firms in these sectors.
Figure 11 presents the sectoral profile of inward FDI between 2013 and 2022 in Ireland and the EU. The figure shows seven economic sectors, which represent 95 per cent of all inward FDI in the EU and 100 per cent in Ireland. There are some similarities: financial and insurance activities represent a similar share of total FDI; however, there are also differences. Professional, scientific, and technical activities constitute a larger share in the EU than in Ireland, whereas the information and communication sector is more significant for Ireland than for the EU. Notably, the main difference between the EU and Ireland lies in the manufacturing sector.
Figure 11: Net FDI Inward with the rest of the world, by economic activity, EU, Ireland, 2013-2022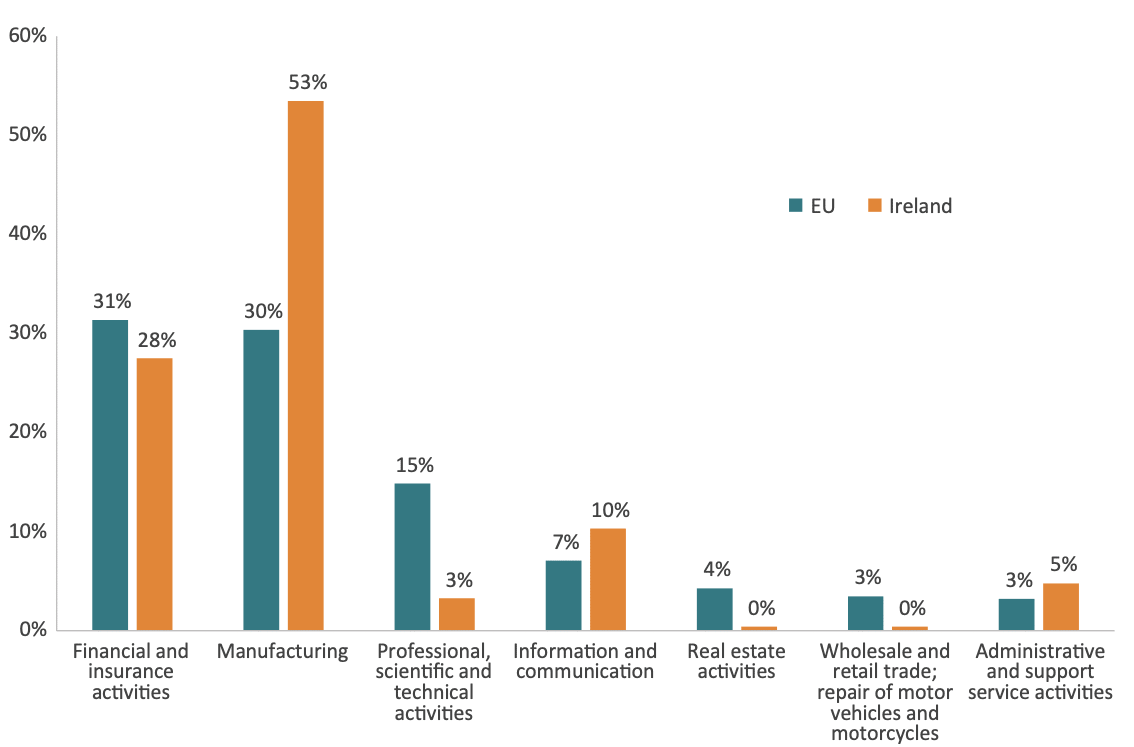 Source: Authors’ calculations based on Eurostat data.
Figure 12 presents the profile of FDI in the manufacturing sector for the EU and Ireland. The differences are striking. First, the vast majority of FDI in the Irish manufacturing sector is directed towards the pharmaceutical sector. In comparison, FDI flows into the EU are distributed across a wider range of sectors, including high-tech industries such as pharmaceuticals, as well as medium and low technology sectors, such as coke and petroleum, food and beverage, and other manufacturing.[69] Overall, just three sectors – financial and insurance services, information and communication, and pharmaceuticals – represent 71 per cent of Irish FDI inflows during the period.
Figure 12: Net FDI Inward with the rest of the world, manufacturing sector, EU and Ireland, 2013-2022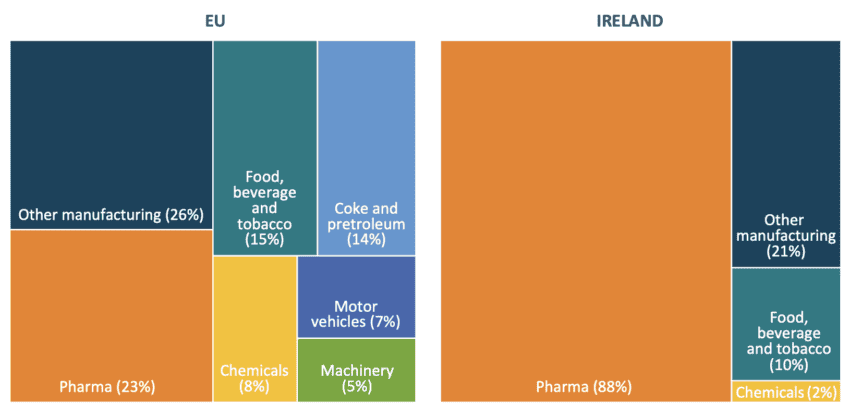 Source: Authors’ calculations based on Eurostat data.
This continuous flow of FDI has contributed to a structural change in the Irish economy, shifting it towards one where manufacturing – specifically pharmaceuticals – and the information and communication sectors have become significantly more prevalent. Between 2011 and 2022, the relative weight of the manufacturing and ICT sector in the Irish business economy went from 52 to 68 per cent while the corresponding figure for the EU remained relatively stagnant, increasingly only slightly from 36 to 37 per cent.[70] This is the core aim of any industrial policy: to shift the structure of production towards one with higher levels of productivity. For Ireland, this transition has been from agriculture to industry, and more recently and in part thanks to FDI, from industry to high-tech industries like pharma and ICT.
Ireland’s FDI-driven industrial transformation has had a tangible impact on national wealth and prosperity. The country now boasts the highest labour productivity per person in the EU[71] and the second-highest GDP per capita.[72] While these figures are partly boosted by multinational firms that produce in Ireland but book a significant share of global profits there,[73] other indicators confirm a genuine rise in economic prosperity and structural transformation. Irish wages remain the third-highest in the EU[74] – an extraordinary achievement for a country once seen as a low-income member of the bloc – and Ireland leads the EU in the share of domestic employment sustained by foreign trade.[75]
Table 4: Main features of the Irish model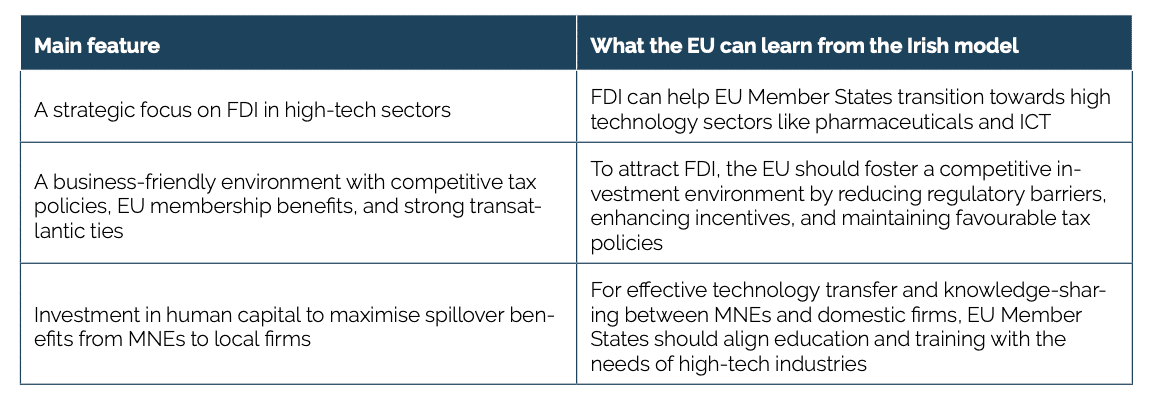
[1] Nilsen, E. (2022, July 28). Clean energy package would be biggest legislative climate investment in US history. CNN. https://edition.cnn.com/2022/07/28/politics/climate-deal-joe-manchin/index.html
[2] McKinsey & Company. (2022, October 24). The Inflation Reduction Act: Here’s what’s in it. https://www.mckinsey.com/industries/public-sector/our-insights/the-inflation-reduction-act-heres-whats-in-it
[3] U.S. Department of Energy. Inflation Reduction Act of 2022. https://www.energy.gov/lpo/inflation-reduction-act-2022
[4] Centre for Economic Policy Research. (2023, October 17). The US Inflation Reduction Act: How the EU is affected and how it should react. https://cepr.org/voxeu/columns/us-inflation-reduction-act-how-eu-affected-and-how-it-should-react
[5] McKinsey & Company. (2022, October 24). The Inflation Reduction Act: Here’s what’s in it. https://www.mckinsey.com/industries/public-sector/our-insights/the-inflation-reduction-act-heres-whats-in-it
[6] Rhodium Group and MIT CEEPR. (2024, August 7). Clean Investment Monitor: Tallying the Two-Year Impact of the Inflation Reduction Act, pp. 15–16. https://rhg.com/wp-content/uploads/2024/08/Clean-Investment-Monitor_Tallying-the-Two-Year-Impact-of-the-Inflation-Reduction-Act-1.pdf
[7] Altomonte, C. and Presidente, G. (2024, February). The hidden cost of uncoordinated European green subsidies, pp. 3–5. IEP@BUPolicy Brief, Bocconi University. https://iep.unibocconi.eu/sites/default/files/media/attach/Policy%20Brief%20-%20The%20Hidden%20Cost%20of%20Uncoordinated%20European%20Green%20Subsidies.pdf
[8] European Commission. The Green Deal Industrial Plan – Putting Europe’s net-zero industry in the lead. https://commission.europa.eu/strategy-and-policy/priorities-2019-2024/european-green-deal/green-deal-industrial-plan_en#paragraph_33968
[9] Official Journal of the European Union. (2014, June 28). Guidelines on State aid for environmental protection and energy 2014-2020. https://eur-lex.europa.eu/legal-content/EN/TXT/HTML/?uri=CELEX:52014XC0628(01)
[10] Verschuur, S. and Sbrolli, C. (2020). The European Green Deal and State Aid: The Guidelines on State Aid for Environmental Protection and Energy Towards the Future. European State Aid Law Quarterly, 19(3), pp. 284–289. https://www.jstor.org/stable/48685810
[11] European Commission. Clean Industrial Deal. https://commission.europa.eu/topics/eu-competitiveness/clean-industrial-deal_en
[12] Rhodium Group and MIT CEEPR. (2024, August 7). Clean Investment Monitor: Tallying the Two-Year Impact of the Inflation Reduction Act. https://rhg.com/wp-content/uploads/2024/08/Clean-Investment-Monitor_Tallying-the-Two-Year-Impact-of-the-Inflation-Reduction-Act-1.pdf
[13] Ibid.
[14] Ibid.
[15] Gaffney, M., King, B. and Larsen, J. (2025, January 9). Preliminary US Greenhouse Gas Estimates for 2024. Rhodium Group. https://rhg.com/research/preliminary-us-greenhouse-gas-estimates-for-2024/
[16] Cleantech for Europe. (2024, June 7). Policy Update: The EU Green Deal’s Legacy. https://www.cleantechforeurope.com/policy/policy-update-the-eu-green-deals-legacy
[17] International Energy Agency. (2024). World Energy Investment 2024. https://iea.blob.core.windows.net/assets/60fcd1dd-d112-469b-87de-20d39227df3d/WorldEnergyInvestment2024.pdf
[18] Ibid.
[19] BloombergNEF. (2024, January 30). Energy Transition Investment Trends 2024: Tracking global investment in the low-carbon transition, p. 6. https://assets.bbhub.io/professional/sites/24/Energy-Transition-Investment-Trends-2024.pdf
[20] BloombergNEF. (2022, January). Energy Transition Investment Trends 2022: Tracking global investment in the low-carbon energy transition. https://assets.bbhub.io/professional/sites/24/Energy-Transition-Investment-Trends-Exec-Summary-2022.pdf
[21] BloombergNEF. (2023, January). Energy Transition Investment Trends 2023: Tracking global investment in the low-carbon energy transition. https://assets.bbhub.io/professional/sites/24/energy-transition-investment-trends-2023.pdf
[22] BloombergNEF. (2024, January 30). Energy Transition Investment Trends 2024: Tracking global investment in the low-carbon transition. https://assets.bbhub.io/professional/sites/24/Energy-Transition-Investment-Trends-2024.pdf
[23] BloombergNEF. (2025, January 30). Energy Transition Investment Trends 2025: Tracking global investment in the low-carbon transition. https://assets.bbhub.io/professional/sites/24/951623_BNEF-Energy-Transition-Trends-2025-Abridged.pdf
[24] Dugo, A. and Erixon, F. (2024, July). A Strategy for a Competitive Europe: Boosting R&D, Unleashing Investment, and Reducing Regulatory Burdens. ECIPE Policy Briefs. https://ecipe.org/publications/strategy-for-competitive-europe/
[25] Abdi, I., Dugo, A., Erixon, F. and Tähtinen, L. (2025). The 8 percent approach: A big bang in resources and capacity for Europe’s economy and defence. ECIPE Occasional Papers. https://ecipe.org/publications/big-bang-resources-capacity-eu-economy-defence/
[26] OECD-MSTI. (2022). Gross Domestic Expenditure on R&D (GERD) – Percentage of GDP. https://data-explorer.oecd.org/vis?lc=en&tm=msti&snb=1&vw=tb&df%5bds%5d=dsDisseminateFinalDMZ&df%5bid%5d=DSD_MSTI%40DF_MSTI&df%5bag%5d=OECD.STI.STP&df%5bvs%5d=&pd=2021%2C2022&dq=KOR%2BJPN%2BGBR%2BUSA%2BEU27_2020%2BCHN%2BTWN.A.G.PT_B1GQ..&to%5bTIME_PERIOD%5d=false
[27] Dugo, A. (2024, October). South Korea Versus Japan: What Can the EU Learn From the Two Countries?. ECIPE Blog. https://ecipe.org/blog/south-korea-japan-what-can-eu-learn/
[28] Dugo, A. (2024, December). Sweden vs Switzerland: A Heavyweight Champions Fight on Innovation. ECIPE Blog. https://ecipe.org/blog/sweden-vs-switzerland-champions-fight-on-innovation/
[29] Fuest, C,, Gros, D., Mengel, P.-L., Presidente, G. and Tirole, G. (2024, April). EU Innovation Policy – How to Escape the Middle Technology Trap?. EconPol Policy Report. https://iep.unibocconi.eu/sites/default/files/media/attach/2Report_EU%20Innovation%20Policy_upd_240514.pdf
[30] Health industries include pharmaceuticals, biotechnology, medical equipment, healthcare equipment and services as well as healthcare providers.
[31] European Commission, Joint Research Centre, Nindl, E., Napolitano, L., Confraria, H., Rentocchini, F., Fako, P., Gavigan, J. and Tübke, A. (2024, December 18). The 2024 EU Industrial R&D Investment Scoreboard – Scoreboard panel 2003–2023. https://iri.jrc.ec.europa.eu/sites/default/files/contentype/scoreboard/2025-02/Scoreboard_panel_2024.xlsx
[32] Abdi, I., Dugo, A., Erixon, F. and Tähtinen, L. (2025, March). The 8 percent approach: A big bang in resources and capacity for Europe’s economy and defence. ECIPE Occasional Papers. https://ecipe.org/publications/big-bang-resources-capacity-eu-economy-defence/
[33] European Commission. State Aid Transparency Public Search. https://webgate.ec.europa.eu/competition/transparency/public?lang=en
[34] The data from the State Aid Transparency Public Search does not seem to account for all state aid measures authorised by the European Commission but only for a fraction of them.
[35] Choi, J. and Levchenko, A. A. (2021, September). The Long-Term Effects of Industrial Policy. NBER Working Paper No. w29263. https://ssrn.com/abstract=3926944
[36] Dugo, A. (2024, October). South Korea Versus Japan: What Can the EU Learn From the Two Countries?. ECIPE Blog. https://ecipe.org/blog/south-korea-japan-what-can-eu-learn/
[37] Jaramillo, L. F. and Kim, C. (2024, October 29). Innovation Spurred: Evidence from South Korea’s Big R&D Push. Center for Development Economics and Policy, Columbia University. https://cdep.sipa.columbia.edu/sites/default/files/content/Jaramillo.pdf
[38] Ibid.
[39] Ibid.
[40] Li, Y., Uribe Frias, J. A., Shin, K., Castro, L. and Rogers, J. D. (2024, May 1). A case study on Korea’s R&D tax incentives: Principles, practices, and lessons for developing countries, p. 57. Washington, D.C.: World Bank Group. https://documents1.worldbank.org/curated/en/099443505132416377/pdf/IDU1eafcf1f5151081421f1965913c696d1e3c75.pdf
[41] Ibid, p.11.
[42] OECD. R&D tax incentives. https://www.oecd.org/en/topics/sub-issues/rd-tax-incentives.html
[43] Ibid.
[44] Mengden, A. (2024, July 2). Tax subsidies for R&D expenditures in Europe, 2024. Tax Foundation. https://taxfoundation.org/data/all/eu/rd-tax-incentives-europe-2024/#:~:text=This%20implied%20tax%20subsidy%20rate,not%20receive%20preferential%20tax%20treatment.
[45] OECD R&D Tax Incentives database. (2024). INNOTAX Portal | Monitoring Tax Support for R&D and innovation. https://stip.oecd.org/innotax/
[46] Bloom, N., Van Reenen, J. and Williams, H. (2019). A toolkit of policies to promote innovation. Journal of Economic Perspectives, 33(3), pp. 163–184. https://pubs.aeaweb.org/doi/pdfplus/10.1257/jep.33.3.163
[47] Dechezleprêtre, A., Einiö, E., Martin, R., Nguyen, K.-T. and Van Reenen, J. (2016). Do tax incentives for research increase firm innovation? An RD design for R&D (Working Paper No. 22405). National Bureau of Economic Research. https://www.nber.org/papers/w22405
[48] Criscuolo, C., Martin, R., Overman, H. G. and Van Reenen, J. (2019). Some causal effects of an industrial policy. American Economic Review, 109(1), pp. 48–85. https://pubs.aeaweb.org/doi/pdfplus/10.1257/aer.20160034
[49] Ibid.
[50] Gersbach, H. and Wörter, M. (2024, February 7). Maintaining the “Swiss way” of promoting innovation. ETH Zürich. https://ethz.ch/en/news-and-events/eth-news/news/2024/02/maintaining-the-swiss-way-of-promoting-innovation.html
[51] Dugo, A. (2024, December). Sweden vs Switzerland: A Heavyweight Champions Fight on Innovation. ECIPE Blog. https://ecipe.org/blog/sweden-vs-switzerland-champions-fight-on-innovation/
[52] OECD. R&D tax incentives. https://www.oecd.org/en/topics/sub-issues/rd-tax-incentives.html
[53] Gersbach, H. and Wörter, M. (2024, February 7). Maintaining the “Swiss way” of promoting innovation. ETH Zürich. https://ethz.ch/en/news-and-events/eth-news/news/2024/02/maintaining-the-swiss-way-of-promoting-innovation.html
[54] Ibid.
[55] OECD. (2021). Government budget allocations for R&D (GBARD) – Percentage of GDP. https://data-explorer.oecd.org/vis?fs[0]=Topic%2C1%7CScience%252C%20technology%20and%20innovation%23INT%23%7CResearch%20and%20development%20%28R%26D%29%23INT_RD%23&pg=0&fc=Topic&bp=true&snb=9&vw=tb&df[ds]=dsDisseminateFinalDMZ&df[id]=DSD_RDS_GOV%40DF_GBARD_NABS07&df[ag]=OECD.STI.STP&df[vs]=1.0&dq=.A.._T…XDC.&pd=2015%2C&to[TIME_PERIOD]=false
[56] OECD. (2021). Higher Education Expenditure on R&D (HERD) – Percentage of GDP. https://data-explorer.oecd.org/vis?lc=en&tm=msti&snb=1&vw=tb&df[ds]=dsDisseminateFinalDMZ&df[id]=DSD_MSTI%40DF_MSTI&df[ag]=OECD.STI.STP&df[vs]=&pd=2000%2C2021&dq=CHE%2BKOR%2BEU27_2020.A.H.PT_B1GQ..&to[TIME_PERIOD]=false&ly[cl]=TIME_PERIOD&ly[rw]=REF_AREA
[57] IMD World Competitiveness Center. (2024). World Talent Ranking 2024. IMD Business School. https://imd.widen.net/s/msmhrf8kgk/20240916-wcc-talent-report-2024-clean
[58] Ibid.
[59] Wettstein, E., Schmid, E., and Gonon, P. (2017). Swiss Vocational and Professional Education and Training (VPET): Forms, Systems, Stakeholders. Bern: Bildungsverlag.
[60] Ibid.
[61] Crescenzi, R. and Ganau, R. (2025). Inward FDI and regional performance in Europe after the Great Recession. Cambridge Journal of Regions, Economy and Society, 18(1), pp. 167–192. https://doi.org/10.1093/cjres/rsae038
[62] See Javorcik, B. S. (2004). “Does Foreign Direct Investment Increase the Productivity of Domestic Firms? In Search of Spillovers Through Backward Linkages.” American Economic Review, 94(3), 605–627. Markusen, J. R., & Venables, A. J. (1999). “Foreign Direct Investment as a Catalyst for Industrial Development.” European Economic Review, 43(2), 335–356.
[63] Blomström, M., & Kokko, A. (1998). “Multinational Corporations and Spillovers.” Journal of Economic Surveys, 12(3), 247–277.
[64] Grossman, G. M., & Helpman, E. (1991). “Innovation and Growth in the Global Economy.” MIT Press. Rodrik, D. (2013). “The Past, Present, and Future of Economic Growth.” Global Citizen Foundation Working Paper.
[65] Barry, F., & Bradley, J. (1997). “FDI and Trade: The Irish Host-Country Experience.” The Economic Journal, 107(445), 1798–1811. O’Malley, E. (1998). “The Revival of Irish Indigenous Industry 1987–1997.” ESRI Quarterly Economic Commentary.
[66] Barry, F., & O’Mahony, C. (2004). “FDI and the Irish Economy.” World Economy, 27(7), 1037–1053.
[67] Source: Central Statistics Office (Ireland). Foreign Direct Investment Annual 2023 available at: https://www.cso.ie/en/releasesandpublications/ep/p-fdia/foreigndirectinvestmentannual2023/and Foreign Direct Investment 2005 available at https://www.cso.ie/en/media/csoie/releasespublications/documents/economy/2005/fdi_2005.pdf
[68] FDI measure as a stock while GDP is a flow. The comparison between FDI stock and GDP is to get a sense of the magnitude of FDI in Ireland and the EU rather than the contribution of FDI to GDP. That would be a different question.
[69] The sector other manufacturing includes: C15 – Manufacture of leather and related products; C23 – Manufacture of other non-metallic mineral products; C27 – Manufacture of electrical equipment; C31 – Manufacture of furniture; C32 – Other manufacturing; C33 – Repair and installation of machinery and equipment
[70] Authors’ calculations based on Eurostat data. For the period 2005-2020, value added at factor costs from Annual enterprise statistics for special aggregates of NACE Rev.2 activities. For the period 2021-2022, value added from Enterprise statistics by size class and NACE Rev.2 activity.
[71] Source: Eurostat, Labour productivity per person employed and hour worked (EU27_2020=100). Available at: https://ec.europa.eu/eurostat/databrowser/bookmark/8dfcea91-50ad-441a-900d-f803a086b354?lang=en
[72] Source: Eurostat, Purchasing power adjusted GDP per capita. Available at: https://ec.europa.eu/eurostat/databrowser/view/sdg_10_10/default/bar?lang=en
[73] The Central Bank of Ireland estimated that Ireland should instead rank between the 8th and 12th position in the EU if the relevant parts of per capita income are considered. Honohan, P. (2021). Is Ireland really the most prosperous country? Central Bank of Ireland
[74] Source: Eurostat, Average full time adjusted salary per employee. Available at: https://ec.europa.eu/eurostat/databrowser/view/nama_10_fte__custom_13597179/bookmark/bar?lang=en&bookmarkId=c29eed24-377e-4763-aaf0-0419906d2ecd
[75] Cernat, L. (2025). Trade, jobs and technological change: What to expect in the next five years? ECIPE Policy Briefs. https://ecipe.org/publications/trade-jobs-technological-change-next-five-years/
4. Conclusion: Lessons for European Industrial Policy
The analysis of different industrial policy models reveals that Europe’s current approach, which relies heavily on state aid and direct grants in particular, may not be the most effective way to stimulate long-term economic competitiveness. While industrial policy remains an essential tool for national economies, its design and implementation are critical to ensuring its success.
A key takeaway from this study is that successful industrial policies worldwide share certain characteristics:
- They are targeted towards specific economic outcomes rather than favouring selected companies;
- They prioritise innovation and R&D rather than short-term financial assistance;
- They create incentives for private-sector investment rather than substituting it;
- They align with broader economic policies to reinforce competitiveness rather than distorting markets.
The EU’s current trajectory – focused on large-scale subsidies with a preference for direct grants – stands in contrast with these principles. The recently presented Clean Industrial Deal essentially reiterates the same policies put forth in all other preceding industrial policy strategies in recent years. There is no reason to believe this time things will be different.
What could really change things would be to draw lessons from other industrial policy models that could help the EU design a more effective and balanced approach. Table 5 summarises the main features of the different industrial policy models discussed in this paper:
Table 5: Overview of industrial policy models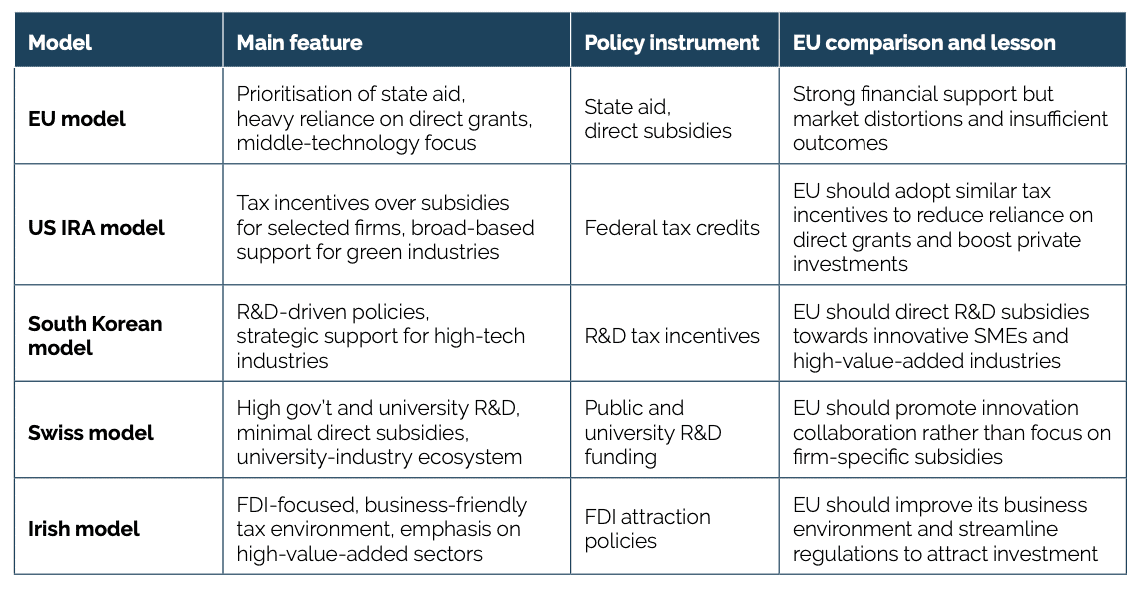 As Europe continues to redefine its industrial policy, it must carefully assess whether its current trajectory aligns with its long-term competitiveness goals. Industrial policy should not simply serve as a reactive tool in times of crisis but as a well-designed strategy that fosters sustainable economic growth. By learning from successful global models, the EU can refine its industrial policy framework to support innovation, investment, and long-term prosperity.