A Forward-Thinking Approach to Open Strategic Autonomy: Navigating EU Trade Dependencies and Risk Mitigation
Published By: Matthias Bauer Oscar du Roy Vanika Sharma
Subjects: EU Trade Agreements European Union
Summary
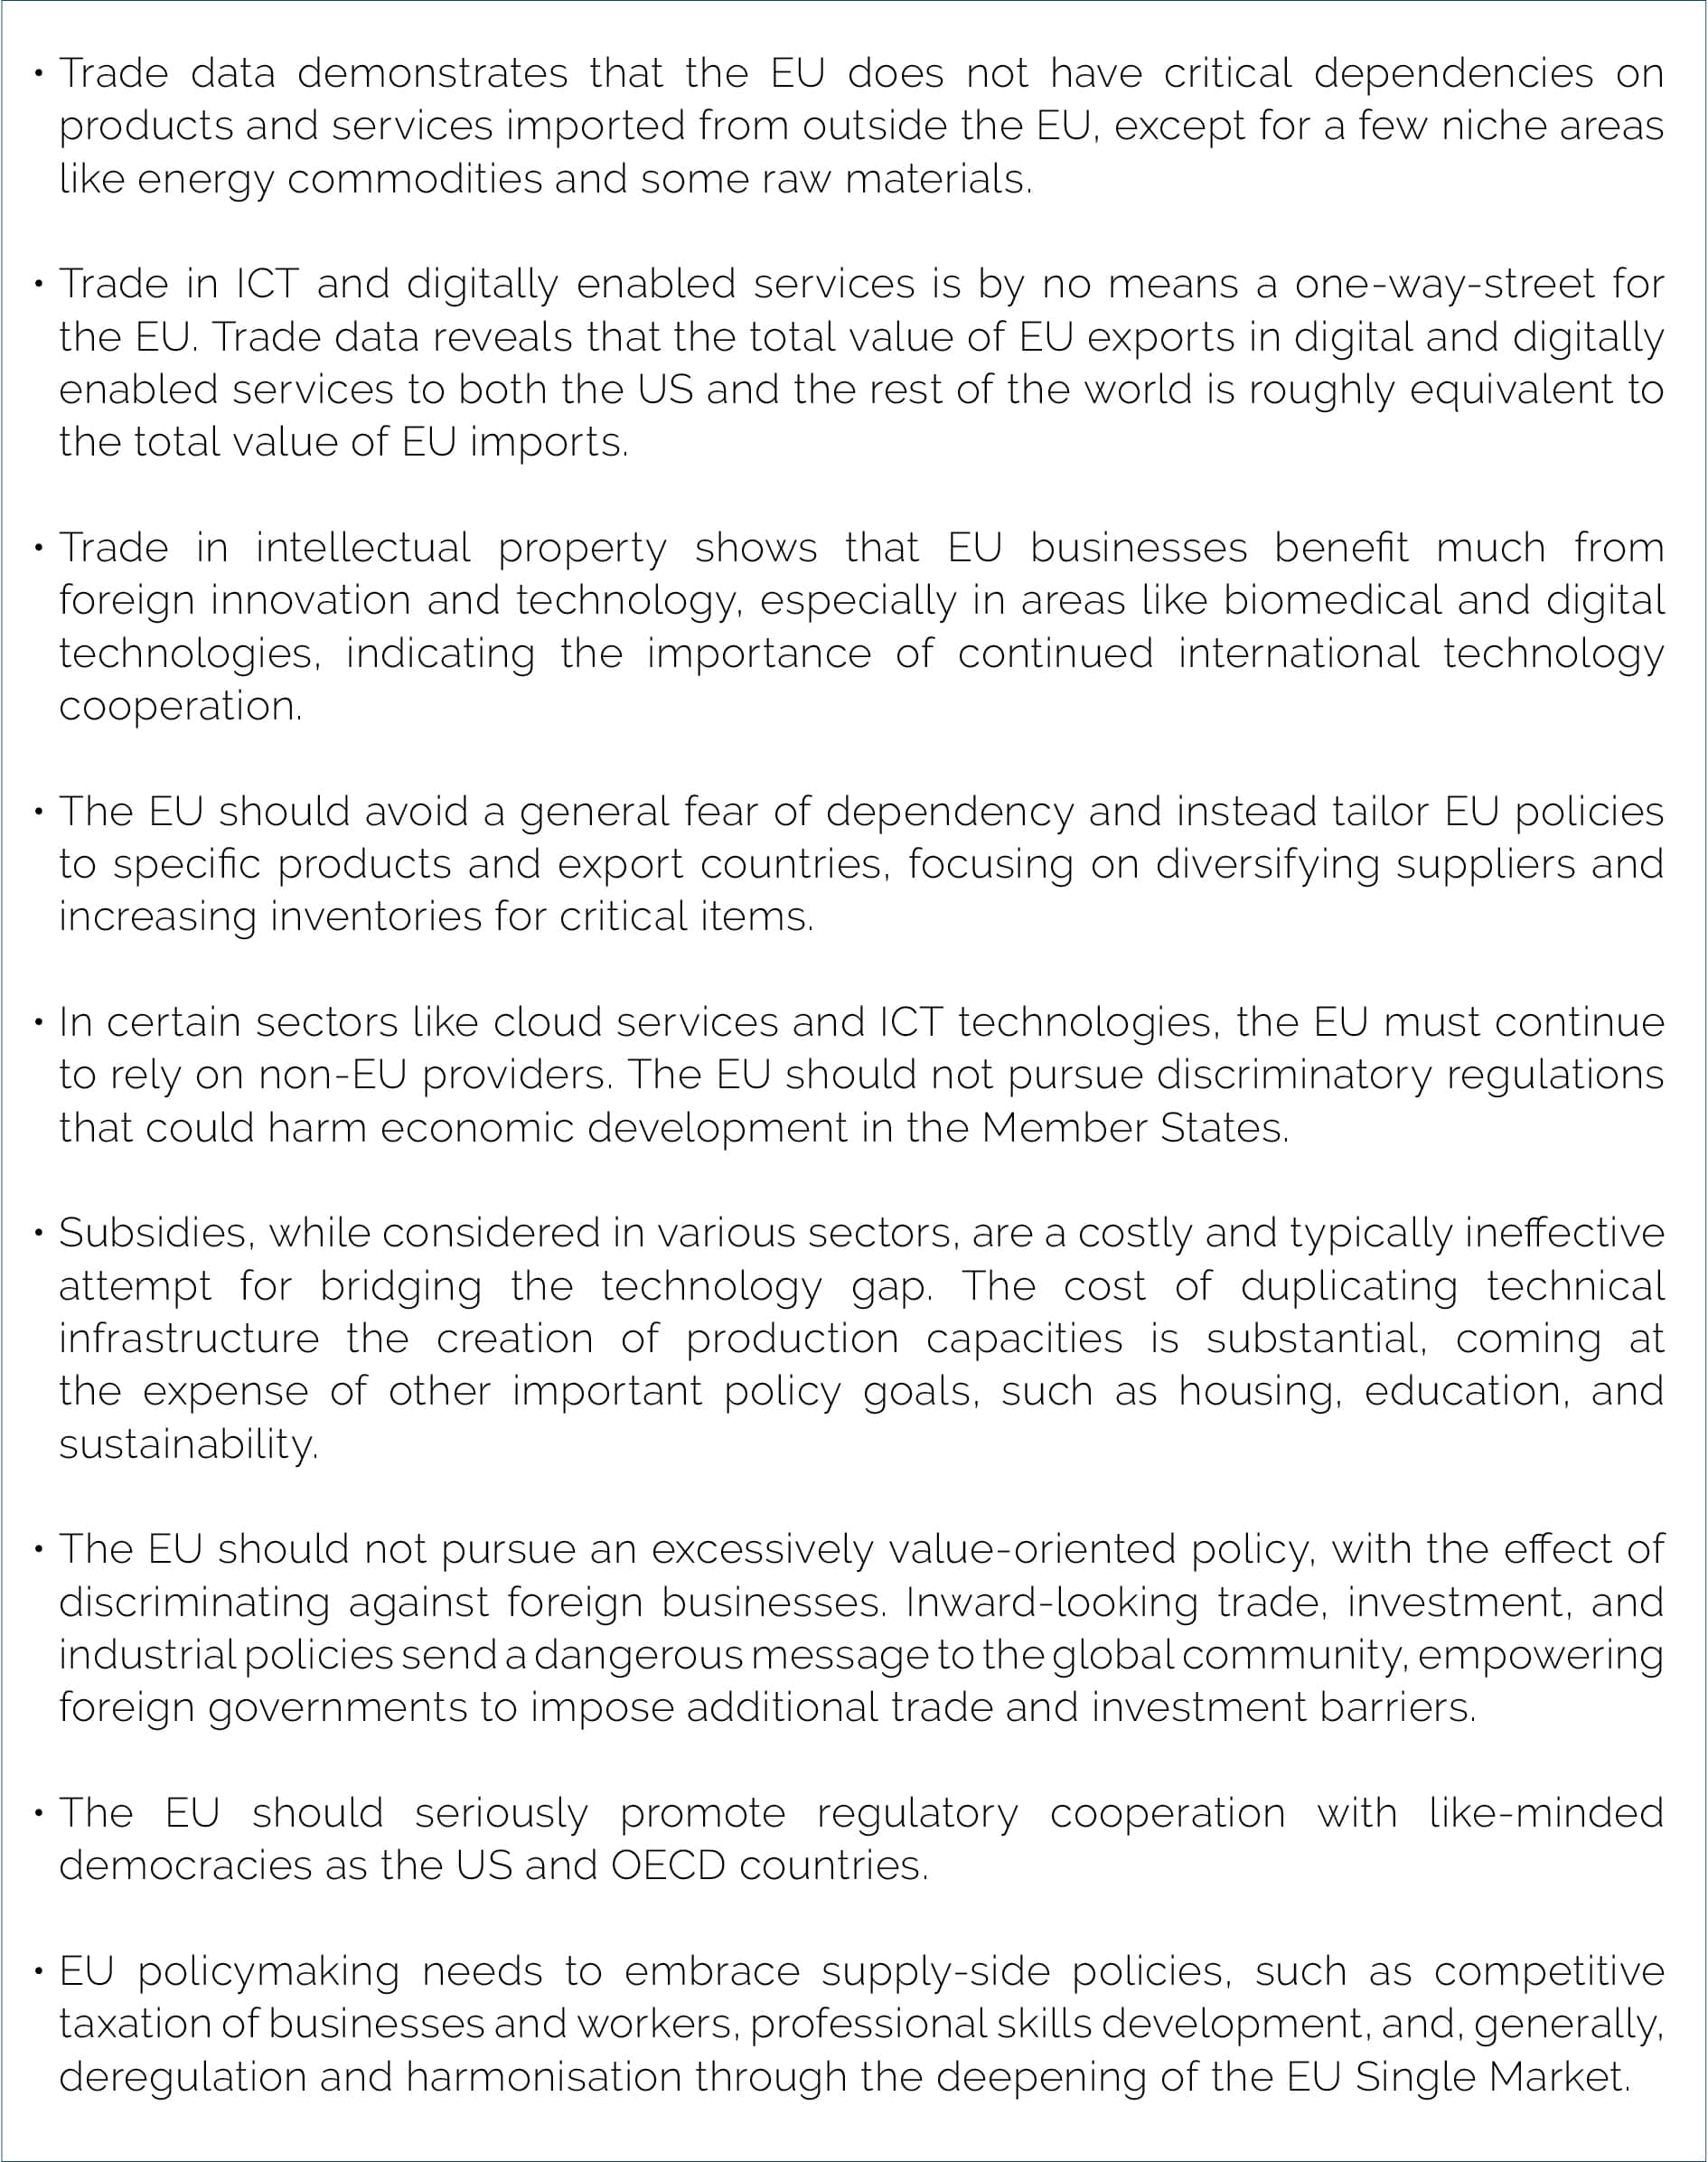
For the EU, fostering economic interdependence is a more proactive and forward-thinking approach than resorting to defensive measures like eliminating alleged economic dependencies through restrictive regulations, as such actions would negatively impact Member States’ economies.
The European Commission and some Member State governments keep pushing for “EU Open Strategic Autonomy”. Several EU laws have already been infused with the concept, resulting in a broad spectrum of EU interferences in production, trade, and investment in the Member States. With the “Resilient EU2030 Report on Open Strategic Autonomy”, the Spanish Presidency of the Council of the EU in September 2023 presented a new roadmap for how to further reduce external dependencies and strengthen EU technological leadership.[1] Similarly, implementing the EU’s Economic Security Strategy initiative, the European Commission presented a list of 10 critical technology sectors aiming to reduce potential economic dependencies and the risk of economic coercion.[2]
This paper shows that EU claims about trade dependencies are not supported by trade data. Except for only few products, such as minerals and energy commodities, there are no critical dependencies on products and services imported from outside the EU. Regarding technology leadership, financial transfers for intellectual property rights indicate that EU businesses and public sectors institutions are benefiting much from advanced foreign technologies and innovation. Many if not most of these technologies are crucial for the EU’s international competitiveness, and they cannot easily be replaced by native EU production. At the same time, the EU is a significant exporter of technologies, including ICT and digitally enabled services that are not easily replaceable by non-EU countries. Policymakers should acknowledge the presence of these mutually beneficial interdependencies, as they can act as a hedge against risks like policy-induced disruptions in value chains and economic coercion.
EU policymaking needs to recognise that trade and investment interdependencies, which include advanced technologies, are unavoidable. Trade interdependencies are critically important for maintaining competitive economies and high living standards in the EU. To mitigate potential risks, the EU should promote trade and investment relationships with trustworthy and like-minded partners, such as the US and OECD countries. EU policymakers should leverage trade interdependencies by increasing the competitiveness of EU exports, which act as a safeguard against dependency and the risk of economic coercion. Rather than limiting imports, the EU and Member State governments should initiate supply-oriented structural reforms to enhance the capacity and efficiency of production factors within the EU, which would ultimately bolster Europe’s export performance.
Key takeaways
[1] Spanish Presidency of the Council of the European Union (2023). Resilient EU2030: a roadmap for strengthening the EU’s resilience and competitiveness. 15 September 2023. Available at https://spanish-presidency.consilium.europa.eu/en/news/the-spanish-presidency-presents-resilient-eu2030-roadmap-to-boost-european-union-open-strategic-autonomy/.
[2] See European Commission (2023). Communication on European Economic Security Strategy”. 20 June 2023. Available at https://eur-lex.europa.eu/legal-content/EN/TXT/PDF/?uri=CELEX:52023JC0020. Also see European Commission (2023). Commission recommends carrying out risk assessments on four critical technology areas: advanced semiconductors, artificial intelligence, quantum, biotechnologies, press release, October 2023. Available at https://ec.europa.eu/commission/presscorner/detail/en/ip_23_4735.
1. Introduction
The EU Strategic Agenda for 2019-2024 outlines the imperative for the EU to enhance its ability to independently safeguard its interests, uphold European values, the European way of life, and contribute to shaping the global future.[1] The European Council Conclusions from October 2020, emphasised the necessity of attaining “strategic autonomy” while simultaneously maintaining an open economy.[2] And with its 2022 trade policy communiqué on “Open Strategic Autonomy”, the European Commission reconsidered the EU’s trade and investment priorities to better and more assertively drive a process towards “fairer and more sustainable globalisation”.[3]
It is difficult to present a clean taxonomy of the EU’s strategic autonomy policies. After all, stressing the need for economic resilience, technological sovereignty or geopolitical influence has aspired a promising way of political storytelling to restore (lost) trust in EU institutions and gain support for EU-level policymaking. In the broad field of economic policymaking, we can broadly distinguish policy initiatives based on four central concerns:[4]
- EU interventions seeking industrial and trade policy objectives through direct interventions in favour of EU businesses, such as reducing perceived dependencies on non-EU suppliers, underinvestment in R&D, and industrial modernisation, where interventions are generally geared to conferring advantages to EU businesses over those from outside the EU.
- EU interventions aimed at correcting proclaimed market failures (primarily) in the EU, including perceived market power and collective action problems (environmental impacts), but also ethical concerns related to fundamental rights.
- EU interventions intended to correct proclaimed market failures related to production and processing methods with extra-territorial reach, including value chain resilience and environmental standards.
- Contingent EU interventions in response to trade measures or behaviour by non-EU governments, including responses to perceived trade restrictive or distortive policies, or actions sought to remedy what the EU perceives to be a shortcoming in the multilateral toolkit.
For each category, relevant EU policy initiatives are outlined in Table 1 below. Most, if not all of these EU policies are motivated by the objective to create EU resources or, generally, to become less dependent on non-EU supply of goods, services, and technology.
Table 1: (Broad) taxonomy of strategic autonomy policies and proposed initiatives by major category
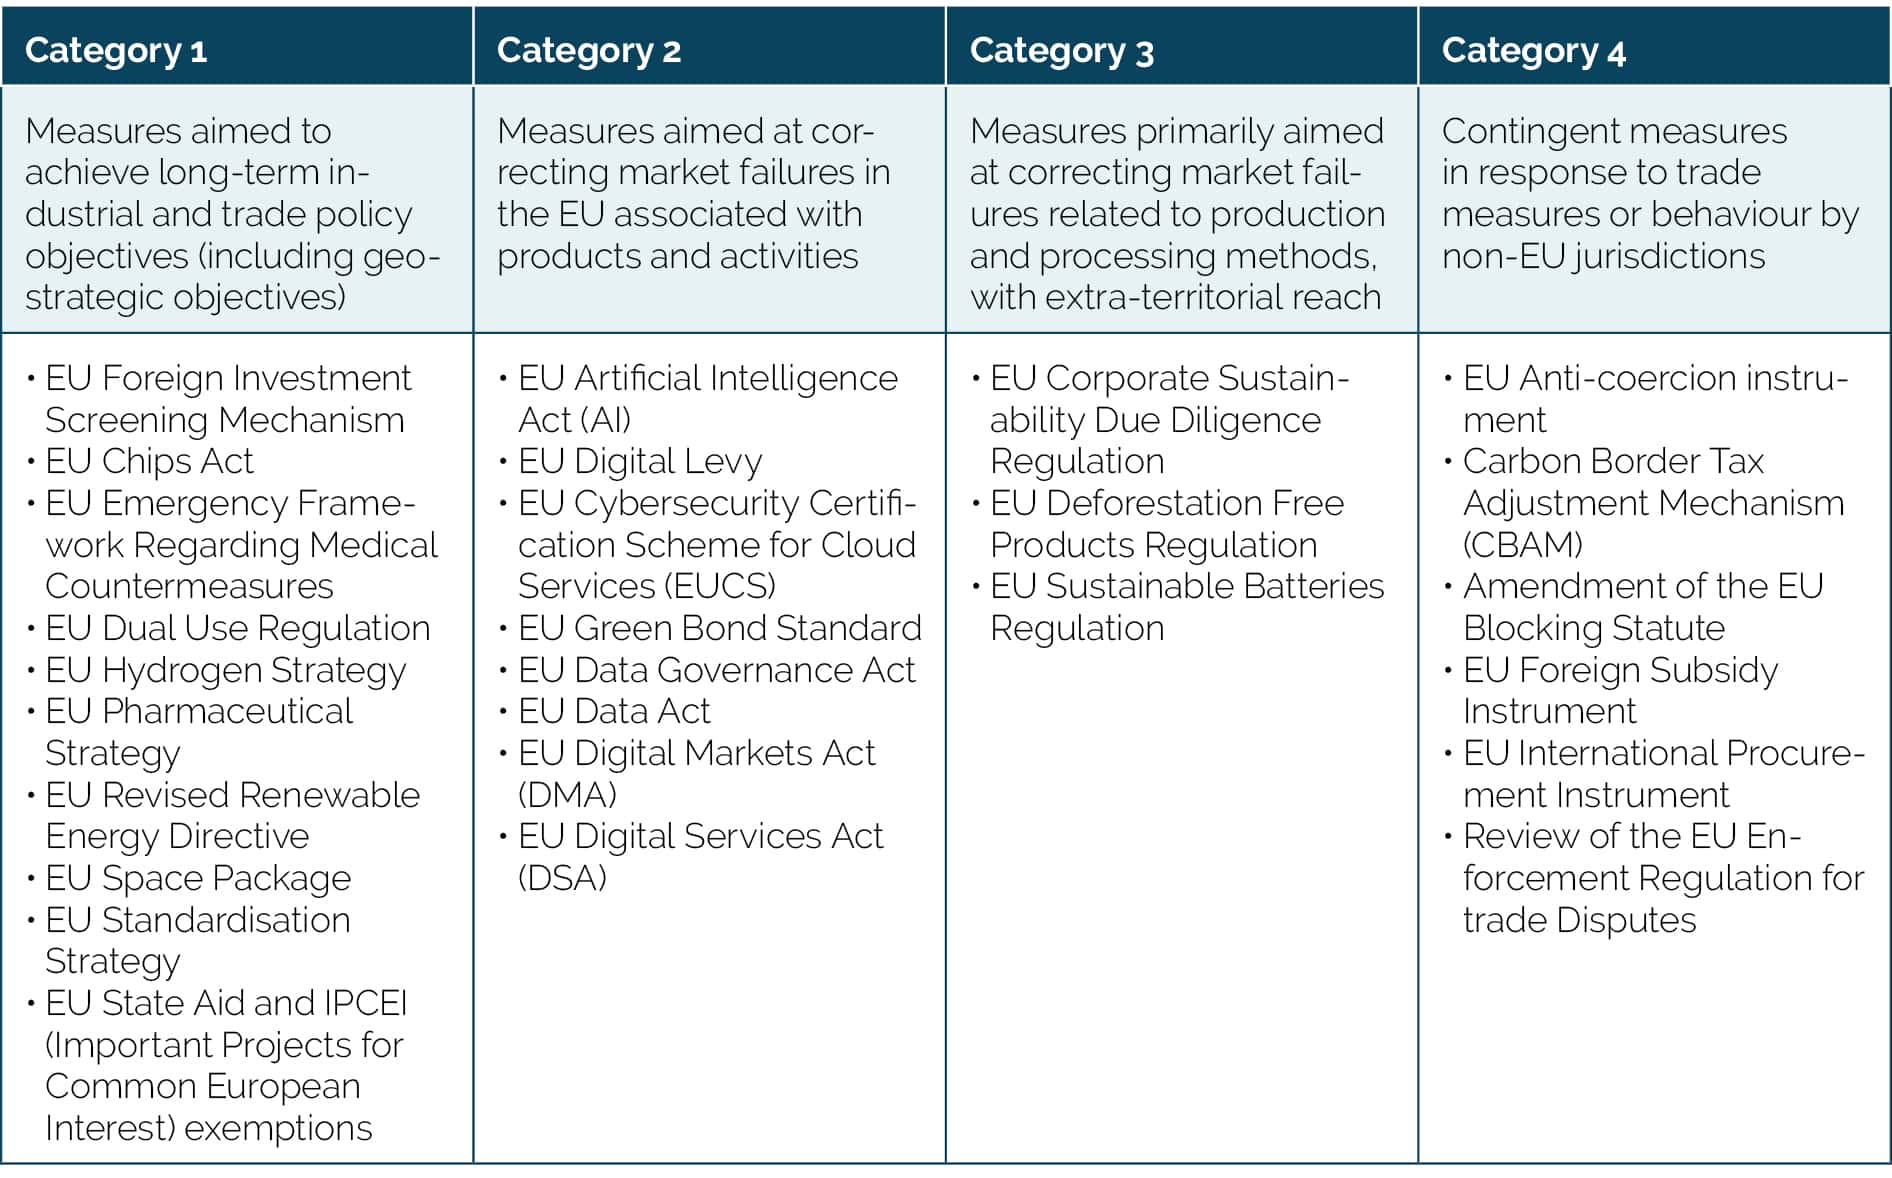
Source: Frontier Economics and ECIPE. It should be noted that these categories cannot be clearly delineated from each other. Some measures in category 1 include measures intended to address perceived market failures related to R&D. Some measures in category 2 also seek to enhance the competitive position of EU industries, while some category 3 measures can have extra-territorial reach. Also, some measures in category 4 can help address prevailing market failures such as asymmetric information about the extent of state aid and negative externalities caused by greenhouse gas emissions.
New EU initiatives, first and foremost the EU Economic Security Strategy of June 2023, suggest that the EU could in the future increasingly rely on defensive, more inward-oriented economic policies. The strategy sets out a set of ambitious policy objectives that are widely accepted. However, it also points to several perceived risks identified by the European Commission to threaten Europe’s competitiveness and reduce the EU’s resilience to shocks and coercive measures by non-EU governments. These risks include:
- Supply Chain Risks: Risks related to price surges, unavailability, or scarcity of critical products, especially those related to the Green Transition, energy supply, and pharmaceuticals.
- Infrastructure Security Risks: Risks related to physical and cyber-security of critical infrastructure, including the potential for disruptions or sabotage in areas like pipelines, power generation, and electronic communication networks. These could compromise the secure and reliable provision of goods, services, and data security in the EU.
- Technology Security and Leakage Risks: Risks associated with technology security and technology leakage, including espionage or illicit knowledge leakage. These risks could undermine the EU’s technological advancements, competitiveness, and access to leading-edge technology. Products include dual-use technologies like Quantum, Advanced Semiconductors, and Artificial Intelligence, as they could enhance military or intelligence capabilities in potentially adversarial countries.
- Economic Coercion Risks: Risks of weaponisation of economic dependencies, where third countries may use trade or investment measures to coerce the EU, its Member States, or businesses into changing their policies.
Building on the objectives of the Economic Security Strategy, the European Commission recently presented a list of 10 critical technology sectors, for which the Commission is planning to conduct a systematic risks analysis.[5] Amongst them are sectors such as advanced semiconductor, AI technologies, and quantum computing technologies as well as biotechnologies.
While the outcomes of these sector reviews remain to be seen, the stated objective of the Commission is to develop and implement “any precise and proportionate measures to promote, partner or protect on any of these technology areas, or any subset thereof.”[6] While the EU’s Economic Security Strategy is explicitly underpinned by the principles of proportionality[7], previous policies suggest that disproportionate, discriminatory and costly measures cannot be ruled out. As outlined in Section 4, for example, the economic costs of “strategic autonomy policies” are significant, depriving the EU, especially smaller EU Member States, of potential economic growth and, as such, economic development. Costly and typically inefficient measures include subsidies and other isolationist policies, such as import tariffs, discrimination against foreign suppliers in public procurement, and non-tariff trade barriers, of which many come on the heels of calls for more national, economic, technological, and cyber security.
The recent “Resilient2030” report has highlighted certain misconceptions, which also serve as a cautionary signal that some EU policymakers may support new policies that seek to isolate the EU from global competition or to exclude non-EU companies from EU markets. The Resilient2030 report also largely builds on the EU’s Economic Security Strategy. The report, which was prepared by the Spanish Presidency of the Council of the EU outlines a “comprehensive, balanced and forward-looking approach to ensure the EU’s Open Strategic Autonomy and global leadership by 2030.”[8] It identifies several strategic vulnerabilities in key sectors, including technology, digital services, and raw materials. Nine lines of EU initiatives in sectors deemed “strategic” are intended to improve the resilience and global competitiveness of the EU in these strategic industries.[9] The actions proposed by the Spanish Council Presidency include, amongst others, the expansion of native EU production capacities, the monitoring foreign ownership in strategic sectors, contingency plans for shortages, expanding trade with like-minded countries, and a rebalancing of the EU’s economic relations with China.
Even though the authors explicitly emphasise that economic cooperation with “non-like-minded states” should be put to the test, opponents of free trade and economic globalisation could see themselves encouraged to adopt a new policy of economic isolation of the EU. What is remarkable about the report of the Spanish Presidency is that it explicitly questions foreign ownership structures of companies operating in the EU. But it is not just this novelty that is out for discussion. The authors of the report are also critical of the role non-EU companies play in advancing economic development in the EU, claiming that “[t]he presence of foreign companies also poses a challenge to the industrial development of the EU. There is a substantial body of research that demonstrates that the dominance exerted by big tech, energy and food companies in the US has resulted in less innovation, higher prices for consumers, lower wages for workers and reduced entrepreneurial activity. The danger now is that this same pattern could happen in the EU, at a time when these things are more necessary than ever.”[10]
The literature cited by the authors of this report is by far not representative.[11] It is selective and biased. It entirely disregards the efficiency gains, scaling effects, research and knowledge transfers, innovation, as well as the employment opportunities and consumer welfare that especially large companies bring about through their imports and investments in the EU. Such claims also negate the empowerment of individual entrepreneurs and SMEs in the EU, which benefit from numerous economic opportunities through the availability of products and services.
By denouncing the “presence of foreign companies”, the report of the Spanish Presidency implicitly calls into question the political rationale underlying 60 years of European economic integration and the liberalisation of international trade. Disapproving “big tech, energy and food companies in the US” neglects the advance state of technology, productivity, and prosperity.[12] To the authors’ credit, they seem to recognise some benefits from the presence of foreign companies, such as the significant advantages of foreign companies, particularly in job creation and innovation, maintaining commercial reciprocity with countries like the US.
Given the potentially substantial cost associated with implementing new EU policies aimed at enhancing resilience and autonomy, it is crucial to restrict these policies exclusively to critical areas where empirical evidence unequivocally reveals substantial risks to Europe’s “economic security,” while considering key political attributes of EU partner countries. At the same time, the European Commission’s avowed commitment to proportionality mandates that EU policymaking should employ a rational cost-benefit analysis to pursue only the measures deemed essential on matters of economic security and resilience.
This paper shows that EU trade dependencies are actually very low and where they exist, they are essentially negligible. We also argue that policymakers should not be blind to economic interdependencies, or “commercial reciprocity”, as stated in the Spanish Presidency report. EU trade and investment is not a one-way street. European firms are intricately woven into global production and distribution networks, which essentially function as a safeguard against actions by non-EU governments aimed at harming the European economy. And we argue that those calling for an “EU versus the rest of the world” approach should distinguish between Europe’s long-standing trade and security partners, on the one hand, and authoritarian regimes on the other. Authoritarian regimes, due to their inherent characteristics, do not adhere to the rule of law and the principles of a market-driven economy and can indeed exert substantial influence over their companies operating within the EU. Accordingly, the EU should have different approaches for its long-standing trade and security partners, with which it shares common values, and for authoritarian regimes, which may not share these values and could potentially wield adverse influence over EU governments, as addressed by the EU Anti-Coercion Instrument adopted in October 2023[13], and companies operating within the EU.
The paper is organised as follows. In Section 2, we closely examine trade in goods and services data to assess the magnitude of trade dependencies frequently cited by EU policymakers and extensively referred to in the context of recent EU policy initiatives. Section 3 provides an account of investment data showing how deeply European companies are integrated into the global economy, especially with advanced economies and like-minded partners. Based on our findings, we discuss implications for the debate about the future course of the EU’s open strategic autonomy in Section 4.
[1] Council of the European Union (2019). A new strategic agenda for the EU – 2019 – 2024. Available at https://www.consilium.europa.eu/en/eu-strategic-agenda-2019-2024/.
[2] European Council conclusions, 1-2 October 2020. Available at https://www.consilium.europa.eu/en/press/press-releases/2020/10/02/european-council-conclusions-1-2-october-2020/.
[3] European Commission (2020). EU Open Strategic Autonomy and the Transatlantic Trade Relationship. Available at https://www.eeas.europa.eu/delegations/united-states-america/eu-open-strategic-autonomy-and-transatlantic-trade-relationship_en.
[4] This broad classification is inspired by discussions with Frontier Economics. ECIPE commissioned Frontier Economics, a consultancy, with a study to estimate the costs of the EU’s strategic autonomy agenda. The study will be released in autumn 2022.
[5] See European Commission (2023). Communication on European Economic Security Strategy”. 20 June 2023. Available at https://eur-lex.europa.eu/legal-content/EN/TXT/PDF/?uri=CELEX:52023JC0020. The Commission recommends carrying out risk assessments on four critical technology areas: advanced semiconductors, artificial intelligence, quantum, biotechnologies. 3 October 2023. Available at https://ec.europa.eu/commission/presscorner/detail/en/ip_23_4735. Also see Annex to the Economic Security Strategy: List of 10 critical technology areas for the EU’s economic security.
[6] European Commission (2023) Recommendation on critical technology areas for the EU’s economic security for further risk assessment with Member States. See Recommendation 15. 3 October 2023. Available at https://defence-industry-space.ec.europa.eu/system/files/2023-10/C_2023_6689_1_EN_ACT_part1_v8.pdf.
[7] To ensure that measures are commensurate with risks and precisely target goods, sectors, or industries to mitigate unintended consequences on the European and global economy.
[8] Spanish Presidency of the Council of the European Union (2023). Resilient EU2030: a roadmap for strengthening the EU’s resilience and competitiveness. Available at https://spanish-presidency.consilium.europa.eu/en/news/the-spanish-presidency-presents-resilient-eu2030-roadmap-to-boost-european-union-open-strategic-autonomy/.
[9] The list includes digital services, and raw materials and semi-processed goods in four critical sectors: energy, digital-tech, health and food.
[10] Spanish Presidency of the Council of the European Union (2023). Resilient EU2030: a roadmap for strengthening the EU’s resilience and competitiveness. 15 September 2023. Available at https://spanish-presidency.consilium.europa.eu/en/news/the-spanish-presidency-presents-resilient-eu2030-roadmap-to-boost-european-union-open-strategic-autonomy/.
[11] Ibid. See footnote 137 of the report: American tech giants are making life tough for startups. (2018, June 2) The Economist, https://www.economist.com/business/2018/06/02/american-tech-giants-are-makinglife-tough-for-startups; Bräuning, F., Fillat, L F., and Joaquim, G. (2022) Cost-price relationships in a concentrated economy. Federal Reserve Bank of Boston Research Department, https://www.bostonfed.org/publications/current-policy-perspectives/2022/cost-pricerelationships-in-a-concentrated-economy.aspx. De Loecker, J., Eeckhout, J., and Unger, G. (2020) The rise of market power and the macroeconomic implications. The Quarterly Journal of Economics 135(2), 561-644. doi:10.1093/qje/
qjz041; Akcigit, U., and Ates, S T., (2023) Ten facts on declining business dynamism and lessons from endogenous growth theory. American Economic Journal: Macroeconomics 13(1), 2021: 257-98. doi:10.1257/mac.20180449).
[12] See ECIPE (2023). If the EU was a State in the United States: Comparing Economic Growth between EU and US States. Available at https://ecipe.org/publications/comparing-economic-growth-between-eu-and-us-states/?_gl=1*d1k90x*_up*MQ..*_ga*MTAyOTE5MjMxMi4xNjk0NzcwNzkx*_ga_T9CCK5HNCL*MTY5NDc3MDc5MS4xLjAuMTY5NDc3MDc5MS4wLjAuMA.
[13] European Council (2023). Trade: Council adopts a regulation to protect the EU from third-country economic coercion. 23 October 2023. Available at https://www.consilium.europa.eu/en/press/press-releases/2023/10/23/trade-council-adopts-a-regulation-to-protect-the-eu-from-third-country-economic-coercion/.
2. Dependencies in EU Trade in Goods and Services
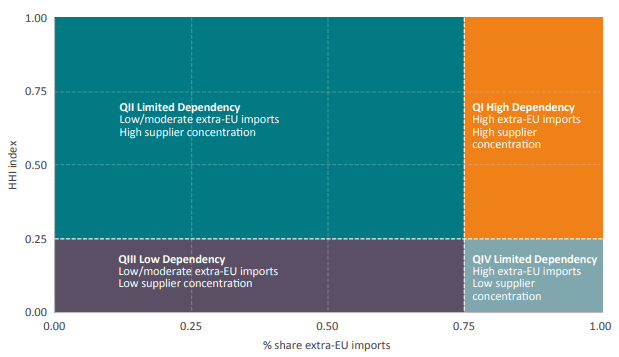
In an earlier ECIPE publication,[1] we developed a framework for classifying EU import dependencies. In this framework, EU imports are defined as dependent when the imported product fulfils two conditions simultaneously. The first condition is that EU imports from outside the EU represent a considerable share of EU’s production which is proxied as the sum of intra-EU imports. These are the goods that EU Member States buy and sell among themselves and by definition is also equal to intra-EU exports – and EU exports to outside the EU (extra-EU exports). The second condition is that the goods that the EU buys mostly from outside the EU must be supplied by only a few countries.
To define the first condition, EU imports from outside the EU must be equal to or higher than 75% of EU total imports and extra-EU exports. This threshold is seen as sufficient, as EU companies below 75% still produce 25% of the EU total imports and extra-EU exports which means that EU businesses have the know-how to produce that product and can scale up production in the event of a crisis. And keep in mind that imports and exports are just one part of the supply of a product: European countries also produce for their own domestic consumption. Hence, imports within the EU and exports outside the EU are lower than EU production since part of EU production is not sold to other EU and non-EU countries but consumed in the EU country where it is produced. So, this indicator underestimates EU production capacity.
The second condition is measured through the Herfindahl–Hirschman Index (HHI). In our framework, when the HHI is equal to or larger than 0.25, the imported product qualifies as dependent. This threshold of 0.25 is also used in competition policy to define a market in which production is highly concentrated on a few suppliers. When calculating the HHI, we include the market share of intra-EU imports and extra-EU exports, but we only sum the square of the market share in EU total imports and extra-EU exports of non-EU countries since we want to identify those products in which the EU is dependent on non-EU countries.
In the scope of this paper, a similar framework will be used to analyse trade in goods as well as trade in services of the EU to identify dependencies. A similar analysis was also conducted by the European Commission[2], and the results have been used to motivate more defensive industrial and trade policy However, our analysis differs from the Commission in four important aspects:
- We use a higher level of product disaggregation. Our analysis assesses dependency in close to 9,000 product categories while the European Commission focuses on 5,000 product categories.
- We account for EU production that is exported outside the EU directly in our two indicators by including extra-EU exports into the first and the second indicator.
- The third difference are the thresholds that define a product as dependent, and the indicators used to measure trade dependency. Our first indicator (the value of EU total imports and extra-EU exports coming from outside the EU) is set at 75% while the European Commission uses a threshold of 50% and excludes the EU production that is exported outside the EU. It appears that the Commission’s thresholds were intentionally chosen to make dependency appear larger, without regard to country diversity of supply and economic and innovation dynamics. Our second indicator, the HHI, is a proxy for market concentration and uses a threshold of 0.25 when the European Commission used a threshold of 0.4 and does not consider intra-EU imports and extra-EU exports in its calculation of the HHI.
- We use two indicators while the European Commission uses an additional indicator for a product to qualify as dependent. We believe this additional indicator – which defines a product as dependent when EU exports are lower than EU imports – is problematic for two reasons. First, given the aggregation in trade statistics, there are different types of products included in each product category. As a result, the imported and exported products within one product category are not necessarily the same products. The second reason is that, conceptually, we disagree with the idea that there is a problematic dependence just because EU imports are greater than EU exports.[3]
Figure 1 visualises the model. In quadrant one, we include those goods with high extra-EU imports and high concentration of suppliers. In quadrant two, we include goods with low or moderate extra-EU imports and high concentration of suppliers. In quadrant three, we include goods with low or moderate extra-EU imports and low concentration of suppliers. Finally, in quadrant four, we include goods with high extra-EU imports and low concentration of suppliers. To summarise, quadrant one includes goods that qualify as trade dependent while quadrant three includes goods where the EU has low dependency. Goods in quadrant two and four have limited dependency because EU imports from outside the EU are relatively low or because the EU has a large pool of external suppliers from which to buy the imported goods.
Figure 1: Import dependency conceptual framework
1.1. Calculating EU Trade Dependencies in Trade in Goods
We gather more than 124,000 observations of EU imports from close to 9,000 product categories in 2022 to assess in which products the EU is dependent on other countries. In that year, the EU imported a total of EUR 7 trillion, 42% was imported from outside the EU (i.e. extra-EU imports) and 58% was imported from within the EU (intra-EU imports), and exported a total of EUR 6.7 trillion. The result of our analysis is presented in Figure 2.
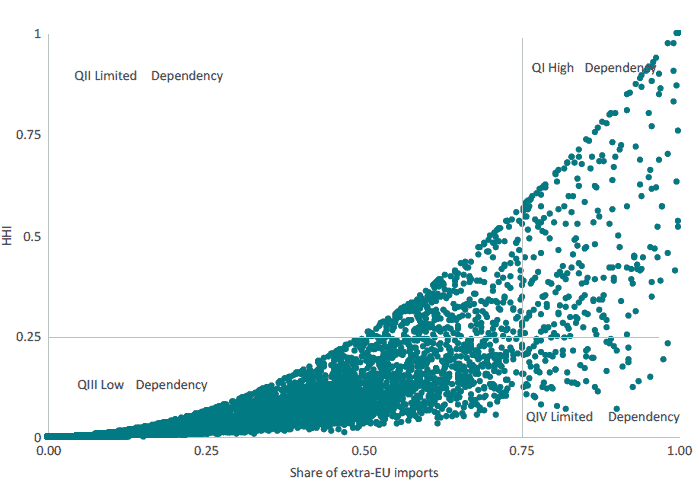
Figure 2 shows that 282 products representing 0.82% (EUR 58 billion) of EU total import values can be defined as dependent in our framework (quadrant one). Table 1 in the Annex lists all the 282 products, their import values, and main supplying country to the EU.
Similarly, there were 8,220 products with extra-EU import values worth EUR 2.2 trillion in quadrant three where the share of EU imports of the products was below 75% and the HHI index was also under 0.25. These represent 31% of the EU’s total imports in value. In quadrant two, where the share is less than 75% and HHI is greater than 0.25, there were 291 products representing 1.1% of EU total value of imports. Finally, in quadrant four, with the share of EU imports greater than 75% and HHI less than 0.25, there were 82 products worth 5.7% of EU total value of imports.
Figure 2: EU import dependency in goods (2022)
Source: Author’s Calculations, Eurostat
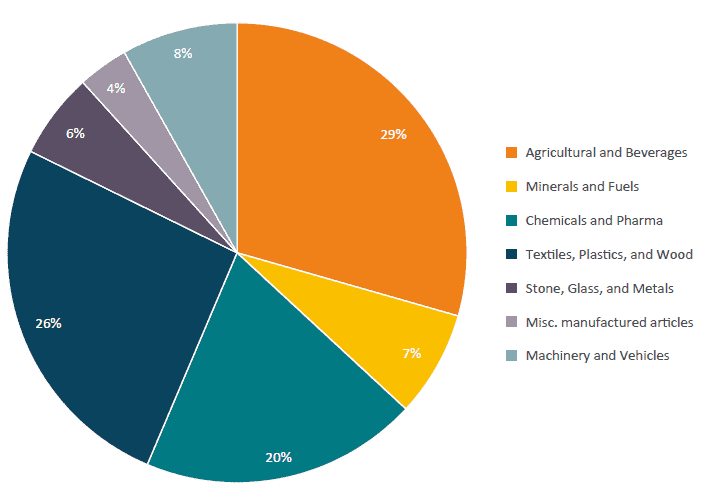
If we focus our attention on quadrant one which shows the products where the EU is dependent on other countries, Figure 3 shows that some of these products are not critical to the EU economy, either because they can be easily substituted or because the economy can operate without them. These are, for example, agriculture and beverages, textiles, plastic and wood products, and a mix of manufacturing products like artificial flowers, wigs, or watches. In other cases, like minerals, fuels, or some spirits, products qualify as dependent because they are only extracted – and imported – from certain geographical areas. Other goods belonging to the chemical and pharmaceutical or the stone, glass, and metals industry such as insulin and quartz could be more difficult to replace. As can be seen in Figure 3, minerals and fuels, chemical and pharmaceuticals, and machinery and vehicles represent 35% of the product categories and the 59% in value of extra EU imports from the 282 product categories defined as dependent.
Figure 3: EU Imports of dependent products (QI) by economic sector (2022)
Source: Author’s Calculations, Eurostat
Figure 4 and Figure 5 show the largest suppliers of these 282 product categories in terms of the share of import values and the share of product categories. The most important countries behind these 282 products were China (82 products and EU import value of EUR 8.6 billion), Russia (7 products and EU import value of EUR 7.3 billion), and the United States (31 products and EU import value of EUR 4.7 billion). The EU is also dependent on the imports of certain products from Switzerland, the United Kingdom, Indonesia, Morocco, Philippines, India, South Korea, Malaysia, Turkey, Canada, and Guinea. As mentioned above, Table 1 in the Annex includes the full list of the 282 product categories and the country name of the most important supplier for each product category.
Figure 4: Share of EU imports value of dependent products (QI) in 2022 by country
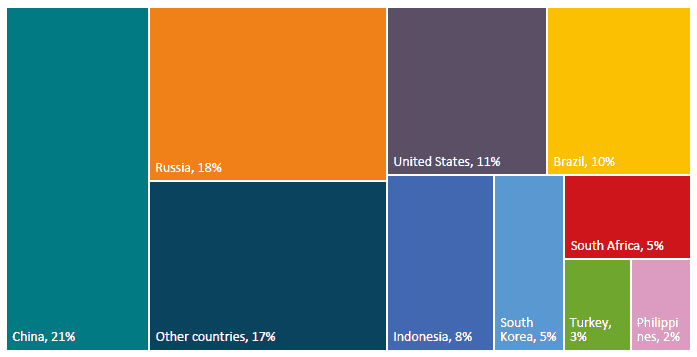
Figure 5: Share of number of dependent products (QI) in 2022 by country
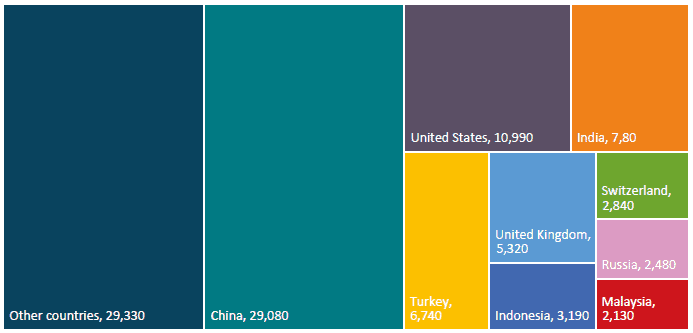
China stands out for two reasons. Firstly, China is the largest source of goods on which the EU is dependent. Secondly, according to some analysts, China is willing to utilise its dominant position in the production of certain goods, as well as the size of its economy, to reach its political goals. The actions taken by the Chinese Government against Lithuania as a response to the strengthening of diplomatic ties between Lithuania and Taiwan are a good example.
Nonetheless, the threat of the Asian giant is also relative. As mentioned, the EU is dependent on the production of goods coming from China in 82 product categories with import values from China that represent 0.3% of EU imports from abroad. Table 2 in the Annex presents these 82 products in more detail. The table includes many agricultural goods like bamboo and ginseng as well as textiles such as silk that can hardly be considered vital for the European economy. At the same time, the EU is also dependent on Chinese chemicals and pharmaceutical ingredients, rare earths like scandium and some machinery that could impact the European economy to a greater extent.
Russia also stands out as one of the main countries on which the EU is dependent for some products. In numbers, the EU depends on Russia for the supply of 7 products, 2% of the 282 product categories, but 18% in terms of the import value of these 282 products. These products are mostly gas and fuels, accounting for 87% of the EU’s dependent import values on Russia.
2.2. Calculating EU Trade Dependencies in Trade in Services
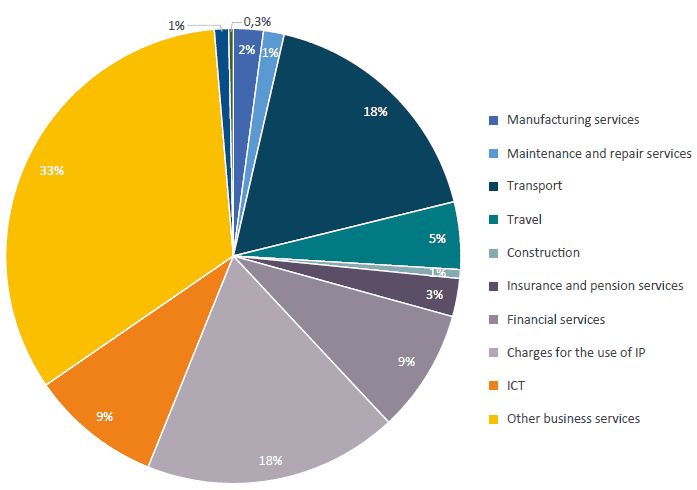
We look at 12 services categories at the most aggregated level[4] in 2021 to assess in which service categories the EU is dependent on other countries. In that year, the EU imported a total of EUR 1.8 trillion, 50% was imported from outside the EU (i.e. extra-EU imports) and 50% was imported from within the EU (intra-EU imports), and exported a total of EUR 2 trillion. Looking closer at the services categories (Figure 6), we find that other business services were the largest imports from outside of the EU making up 33% of EU imports from abroad. This was followed by charges for the use of IP and transport services at 18%.
Figure 6: Share of import of service categories from outside the EU (2021)
Source: Author’s Calculations, Eurostat
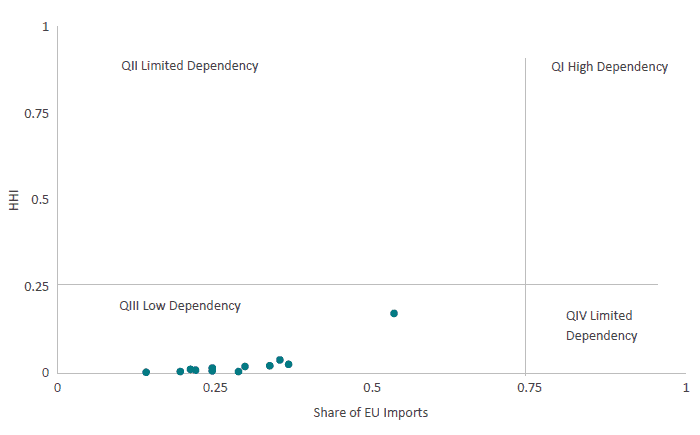
The result of our analysis is presented in Figure 7, which demonstrates that none of the services categories can be defined as dependent in our framework (quadrant one). The graphical representation of the analysis, however, provides additional transparency as to what would happen if we changed the thresholds that define a service category as dependent. For instance, if our first indicator (the share of EU total imports and extra-EU exports coming from outside the EU) changes from 75% to 50%, and the second indicator (HHI) changes from 25% to 15%, the number of services deemed as dependent will increase to one, i.e. services on charges for the use of IP. EU imports from abroad for this category were worth EUR 170 billion with the United States being the largest supplier (74% market share).
All service categories lie in QIII of the current framework, i.e., they face low dependency. However, as can be seen from the graph, the indicator value for services on charges for the use of IP is an outlier and has much higher values for both indicators. It has a value of 53% for indicator 1 and a value of 0.17 for indicator 2. These findings suggest that both EU businesses and public sector institutions are reaping substantial benefits from advanced (patented) foreign technologies and innovations. A considerable portion of these technologies is indispensable for the EU’s global competitiveness and cannot be readily substituted with domestically produced alternatives. Some policymakers would call them “critical”. However, contrary to energy commodities, for examples, the EU also plays a vital role as a major exporter of advanced patented technologies, including ICT and digitally enabled services that are not easily replaceable by countries outside the EU. As recently analysed by the European Intellectual Property Office (EUIPO), taking both goods and services trade into account, between 2017– 2019, 80.5% of EU extra-EU imports and 80.1% of extra-EU exports were generated by IP-intensive industries.[5] Also, the trade surplus in IP-intensive industries was EUR 224 billion, contributing more than three quarters of the total EU trade surplus
Figure 7: EU import dependency in services (2021)
Source: Author’s Calculations, Eurostat
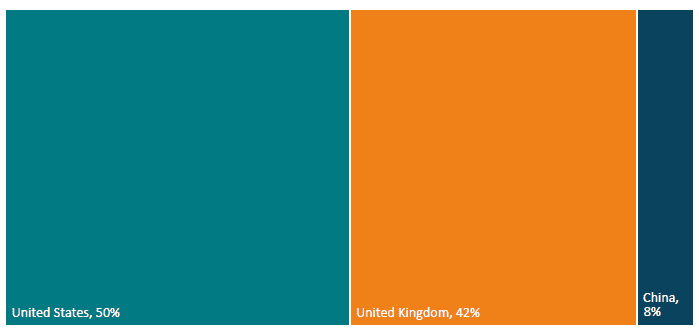
Figure 8 and Figure 9 show the largest suppliers of the service categories in terms of the share of import values and the share of product categories. The most important countries behind the 12 services were United States as the largest supplier for 6 of the services and providing imports worth EUR 285 billion to the EU. This was followed by the United Kingdom supplying 5 service categories to the EU worth EUR 48 billion and China supplying one service category to the EU worth EUR 4.4 billion. However, the total import value of services supplied by these three countries accounted for only 35% of EU import values of services from abroad. This further corroborates our findings on low risk of dependency in services imports of the EU.
Figure 8: Share of EU import value of services in 2021 by country
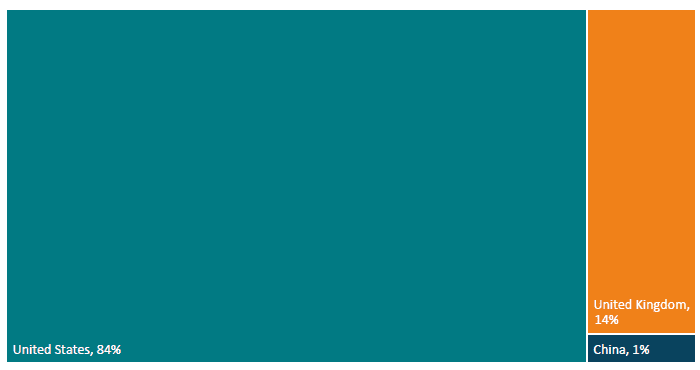
Figure 9: Share of number of services in 2021 by country
The threat of dependency on China or Russia is significantly lower in the case of EU imports of services. This is because, not many services fall in the category of high dependency and China and Russia do not stand out as large suppliers to the EU in imports of services. Only for one service category, China was the largest supplier. This was in EU imports of manufacturing services. Even then, EU imports from China in this category were worth EUR 4.4 billion and only accounted for 22% of EU imports of manufacturing services from abroad.
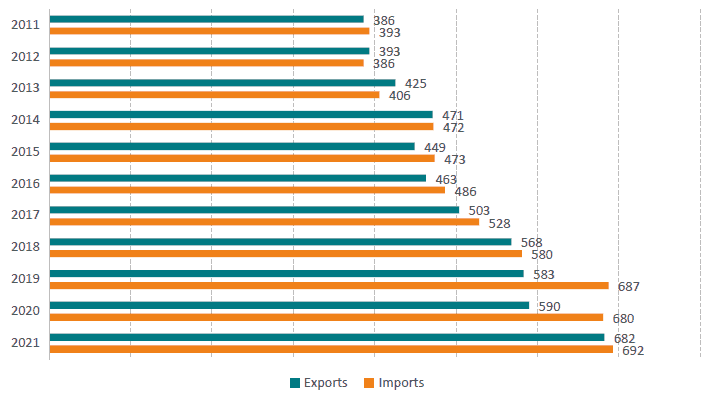
In the EU’s political discourse, it repeatedly emerges that the EU is a digital laggard. This is actually true in some technology areas, e.g., in advanced cloud services and computing capacities. However, numerous EU-based companies excel in digital exports, deriving advantages from imported technologies and services, thus contributing to balanced digital trade overall. Trade data demonstrates that the EU has been and still is a strong exporter of digital and digitally enabled services to the rest of the world. The data also demonstrates that total EU exports of ICT and digitally enabled services roughly matches the value of total EU imports of ICT and digitally enabled services (see Figure 10). This applies to both intermediate consumption, i.e., B2B trade, and final consumption. In 2022, for example, EU imports of “ICT, media, computers, business, and financial services” for intermediate consumption – e.g., inputs by a process of production – from non-EU countries amounted to approx. EUR 515 billion. EU exports amounted to approx. EUR 471 billion (see Figure 11).
Figure 10: Extra EU digital and digitally enabled services trade, in billion USD
Source: Eurostat. Note: the digital and digitally enabled services include: insurance and pension services (SF), financial services (SG), charges for the use of intellectual property (SH), telecommunications, computer and information services (SI), other business services (SJ), and personal, cultural, and recreational services (SK).
Figure 11: EU trade in digital and digitally enabled services for intermediate consumption and final consumption, in million EUR
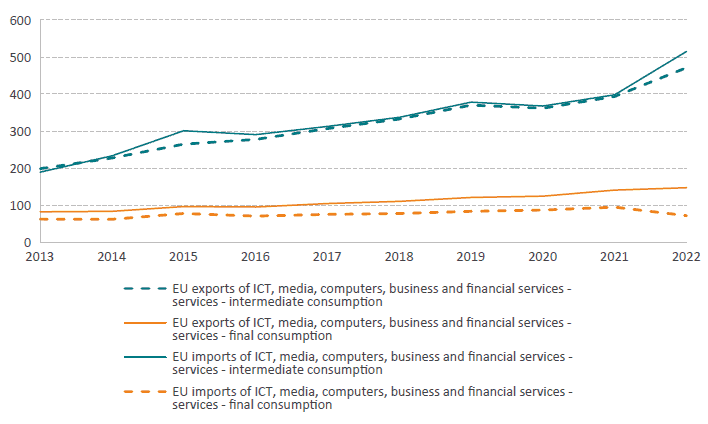
Source: Eurostat, International trade in services and (BPM6). Note: 2022 data is provisional.
The US is frequently seen as a systemic competitor in technology and the digital economy, with concerns over the excessive dominance of US companies and their perceived negative impact on European economies, as outlined in the Resilient2030 report by the Spanish Council Presidency.[6] Despite showing a trade deficit in international cloud services trade, however, trade in ICT and digitally enabled services is not a one-way-street for the EU. Recent trade data reveals that the total value of EU exports in digital and digitally enabled services to the US is roughly equivalent to the total value of EU imports from the US. In other words, contrary to popular notions, EU exports of ICT services to the US nearly match US exports of digital services to the EU (Figure 12).[7]
Figure 12: EU27-US trade in ICT services by sub-category, 2020-2022, in billion USD
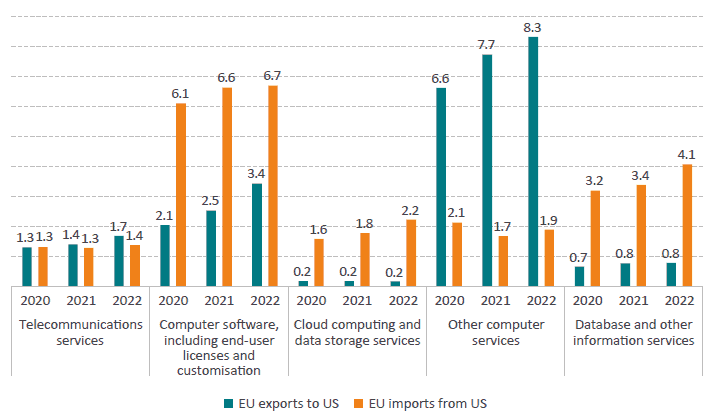
Source: US Bureau of Economic Analysis (BEA). Note: due to relatively low bilateral trade values, news agency services, which statistically is a component of ICT services, have been excluded from the data.
[1] See ECIPE (2022). Should the EU Pursue a Strategic Ginseng Policy? Trade Dependency in the Brave New World of Geopolitics. Available at https://ecipe.org/wp-content/uploads/2022/04/ECI_22_PolicyBrief_TradeDependency_05_2022_LY02.pdf?_gl=1*eqnmsl*_up*MQ..*_ga*ODkwNzQwMzAyLjE2OTg5MDc4MDc.*_ga_T9CCK5HNCL*MTY5ODkwNzgwNy4xLjAuMTY5ODkwNzgwNy4wLjAuMA.
[2] European Commission (2021). Strategic dependencies and capacities. Commission Staff Working Document. Available at https://ec.eu- ropa.eu/info/sites/default/files/swd-strategic-dependencies-capacities_en.pdf.
[3] Due to much more limited data on services trade, we pursue a different approach for the analysis of trade dependences in EU services trade.
[4] At higher levels of disaggregation, data was missing. There was also not sufficient data for 2022, which is why the data for 2021 has been analysed.
[5] EUIPO (2022). IPR-intensive industries and economic performance in the European Union. Available at https://euipo.europa.eu/tunnel-web/secure/webdav/guest/document_library/observatory/documents/reports/IPR-intensive_industries_and_economic_in_EU_2022/2022_IPR_Intensive_Industries_FullR_en.pdf.
[6] Spanish Presidency of the Council of the European Union (2023). Resilient EU2030: a roadmap for strengthening the EU’s resilience and competitiveness. Available at https://spanish-presidency.consilium.europa.eu/en/news/the-spanish-presidency-presents-resilient-eu2030-roadmap-to-boost-european-union-open-strategic-autonomy/.
[7] In trade statistics, “other computer services” is a category encompassing diverse services related to computer and information technology. These services include IT consulting, maintenance, data processing, software development, web-related services, training, and research and development activities. They are essential for businesses and organizations to leverage technology effectively. See, e.g., UNCTAD Manual for the Production of Statistics on the Digital Economy 2020. Available at https://unctad.org/system/files/information-document/tdb_ede4_2020_nonpaper01_en.pdf.
3. EU Investment Interdependencies
FDI data shows that European companies are heavily involved in the global economy and would have much to lose if international trade were increasingly distorted or restricted by non-EU governments inspired by EU policies.
FDI statistics demonstrate the extent to which the EU is integrated in global commerce, mostly with other advanced economies. The US is both the largest contributor of inward FDI in the EU and the largest recipient of investment from EU Member States (29% and 25% respectively, see Table 2). Also, contrary to popular notions, the EU FDI in the US exceeds US FDI in the EU. The US invests mainly in the EU in computer and electronics and transportation sectors. Large foreign participation in domestic EU sectors is also to be found in financial services and manufacturing sectors such as petroleum and chemical industries.[1] Finally the share of FDI exposure from China and Hong Kong is relatively small, around 3%, for both inward and outward positions (see Table 3).
It is important to note that investments to and from offshore financial hubs can distort countries’ reported investment shares because of special purpose entities (SPEs) that are set up abroad for tax reasons, among other purposes. Their operations mainly focus on channelling transactions between entities outside the country where they are headquartered, and the problem is that ultimate investor countries are invisible in FDI statistics. If in turn FDI are restated in terms ultimate investor, inward FDI from the US double, and those from China would triple.[2] Overall the implications of ownership structures and intermediation of transactions highlight the complexity of the global financial linkages between firms and countries.
Table 2: Top 20 partner countries for FDI stock (average FDI, 2016-2021)
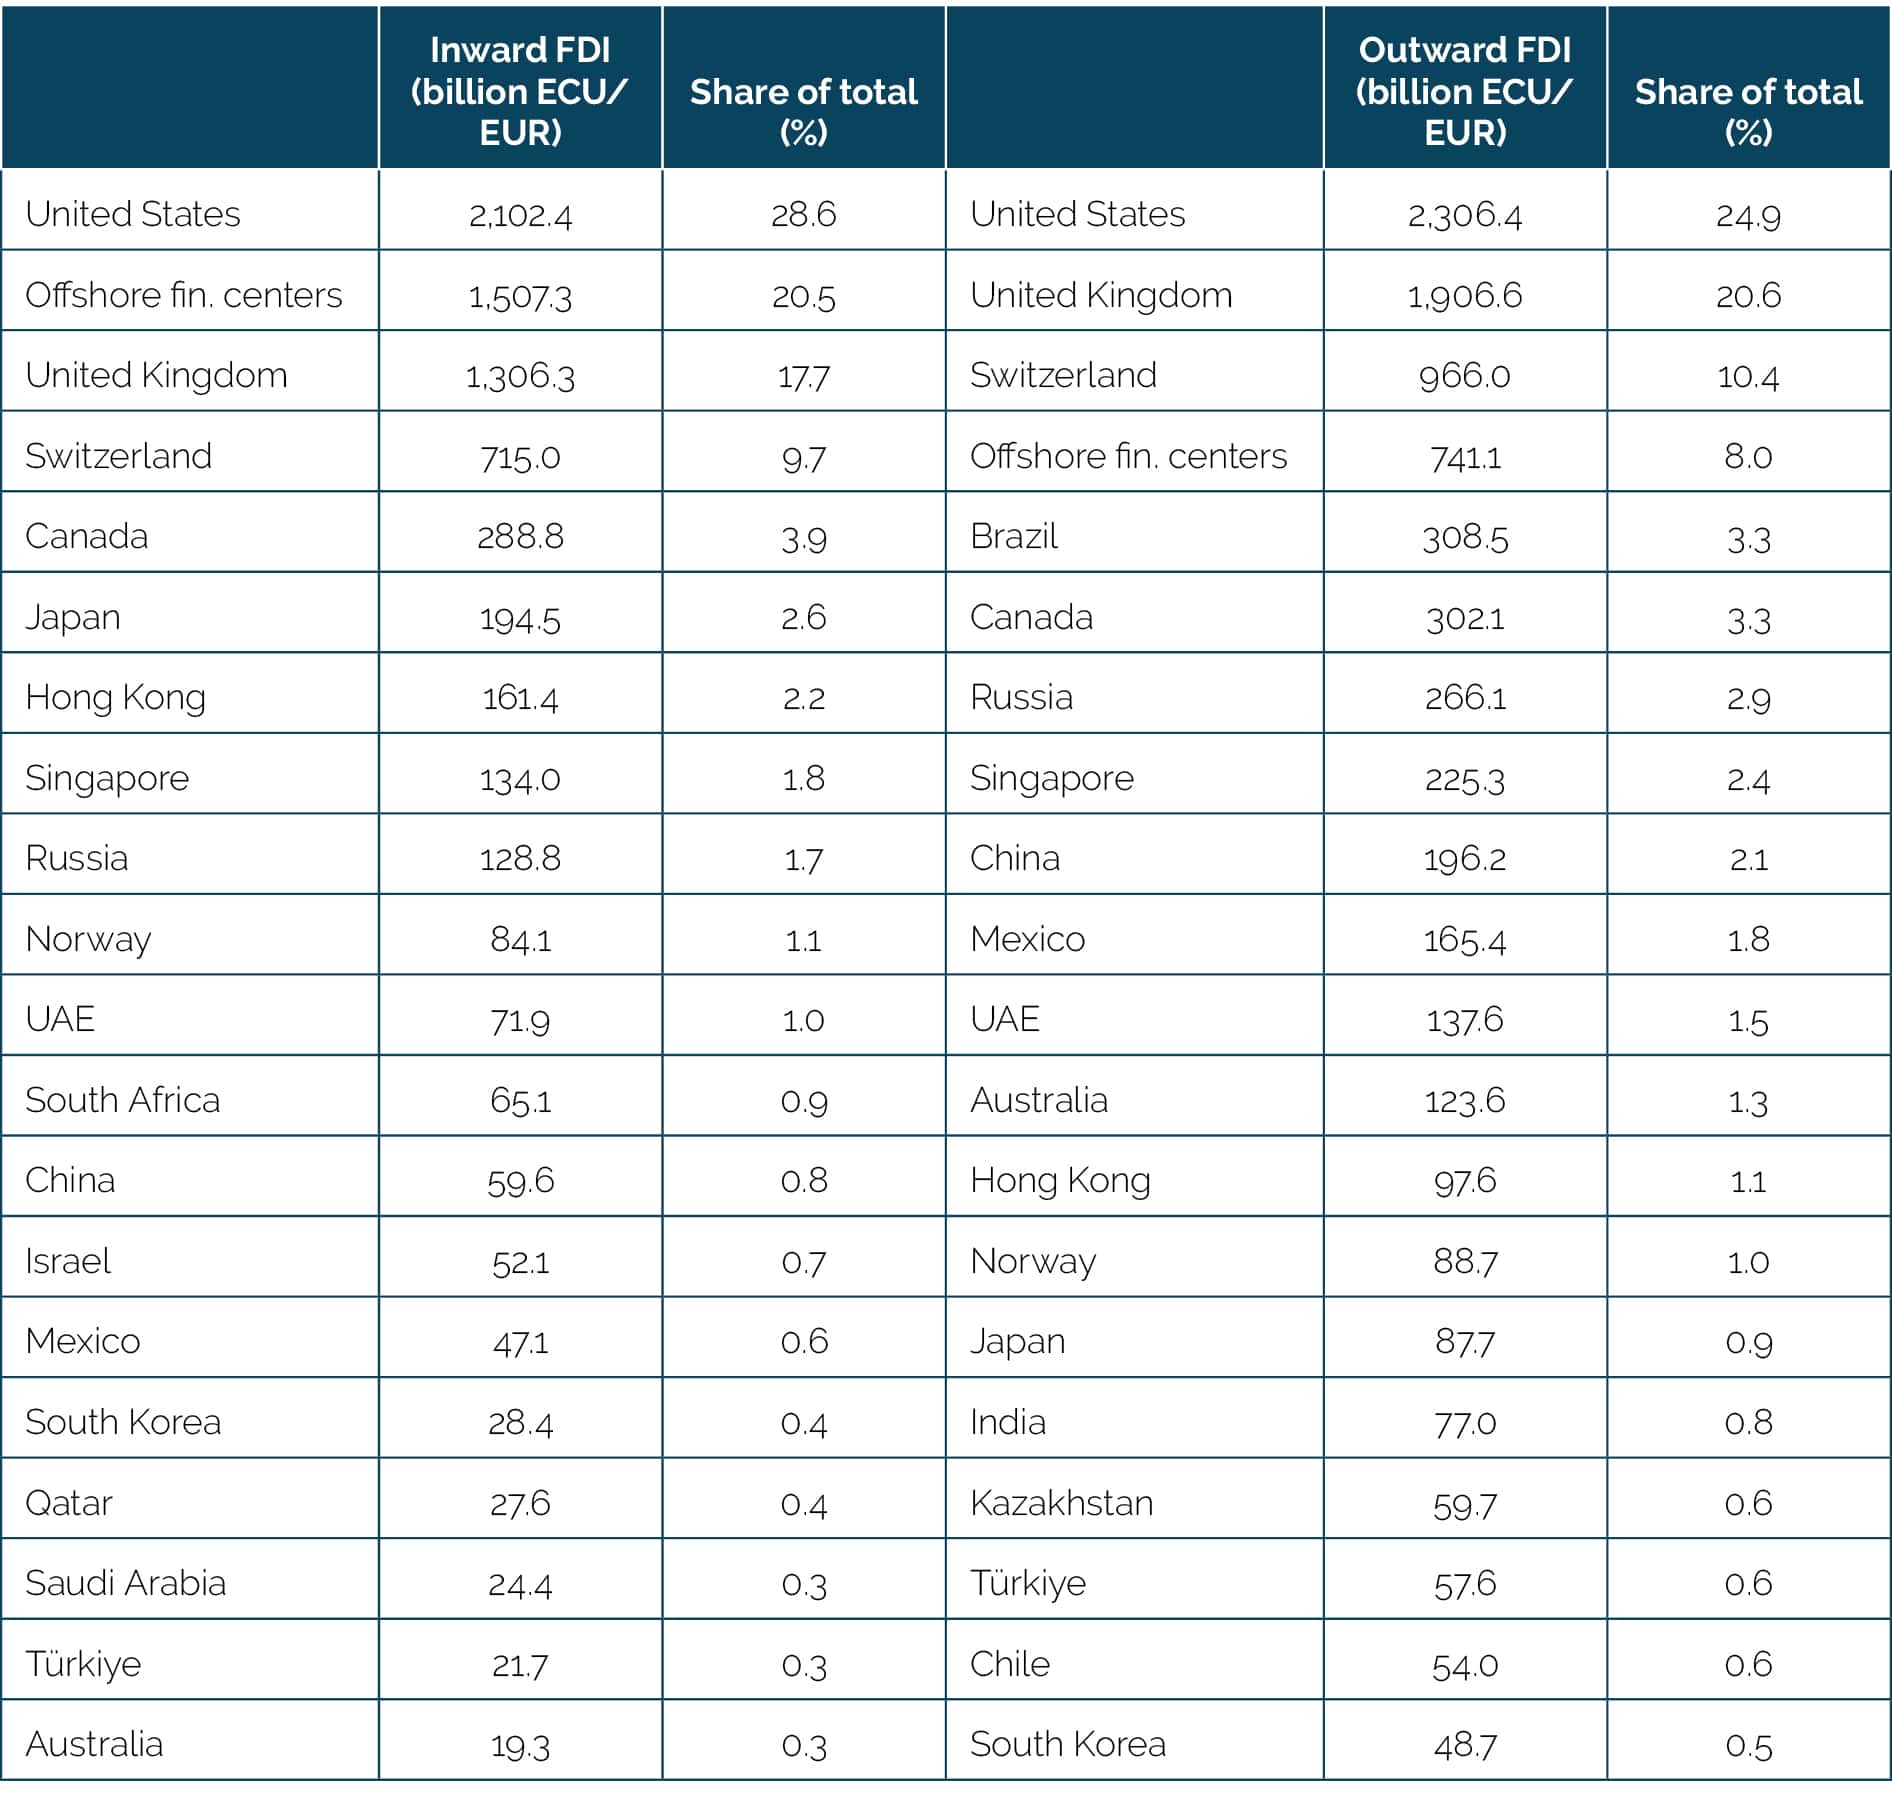
Source: Eurostat.
Table 3: Inward and outward FDI position of the EU, in billion euros
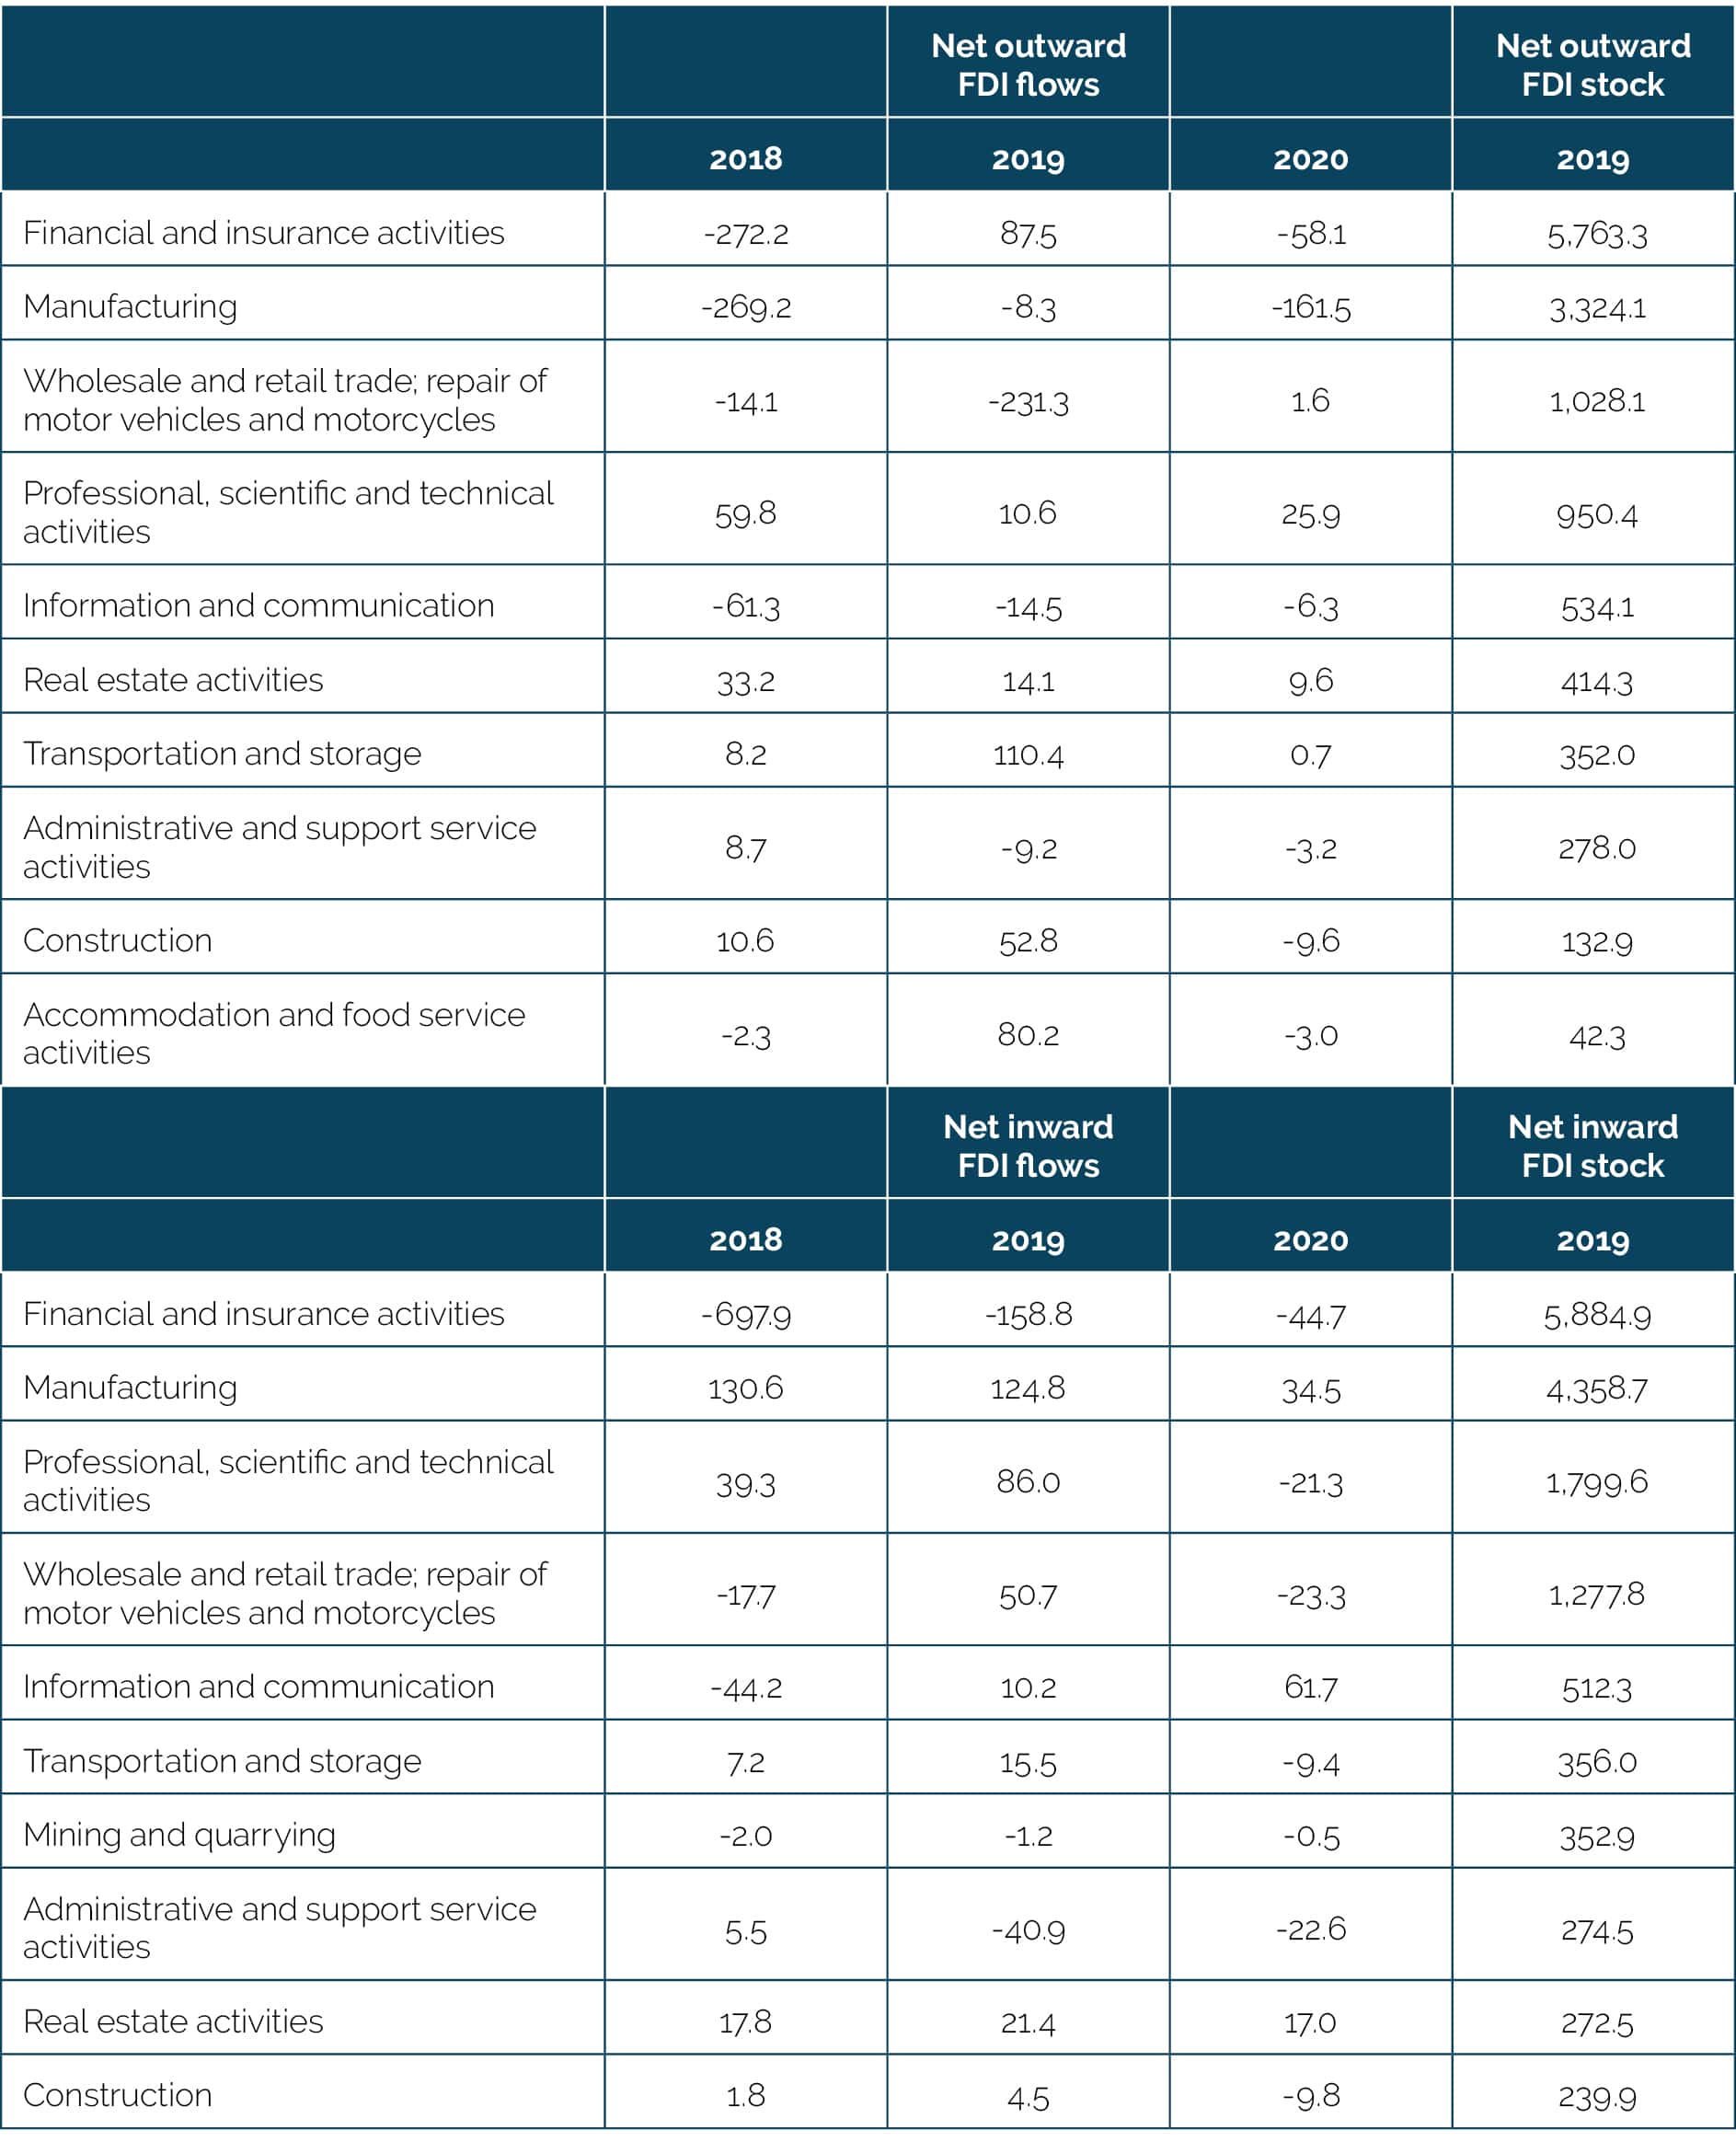
Source: Eurostat. Note: The sectors are ranked according to the FDI stock position.
FDI is an important driver of international trade, which, due to significant intra-firm trade, is only partly covered by official trade statistics. Trade and investment statistics mostly focus on cross-border transactions between countries and sectors. Since the 1980s, with the advent of global value chains (GVC) and the internationalisation of production networks, a growing share of global trade has taken place between multinational enterprises (MNEs) and their affiliates across borders (intra-firm), vertically and horizontally. In contrast, arm’s length trade refers to cross border transactions for goods and services between independent firms. Although intra-firm is a well-known phenomenon in business strategy decisions, there is a systematic lack of aggregated data that prevents any quantification of global patterns of such trade. As a result, the sparse empirical literature on the subject tends to mainly focus on the US, Japan, and part of OECD countries without any consistent research at the EU level.
Given the latter has strong economic linkages with other advanced countries, some results are nonetheless worth highlighting to understand the characteristics and determinants of such trade. For example, Lanz and Miroudot (2012)[3] find that intra-firm manufacturing exports in 9 OECD countries represent 16% of total exports and more strikingly that intra-firm trade accounts for one third of the world trade under certain assumptions. Moreover, the authors find that a greater proportion of intra-firm trade takes place between advanced economies, notably among OECD countries, that are more capital and skilled-labour intensive. In the US, R&D and management consulting services account for the largest shares of exports and imports in intra-firm services. Focusing on EU-US trade linkages, Lakatos and Fukui (2013)[4] explore the role of multinationals in intra-firm trade, which accounted for 50% of EU-US trade in goods in 2012. Nonetheless there is significant variation at the EU level regarding US related party trade. For instance, such trade is greatest in countries such as Belgium and the Netherlands for US intra-firm exports (50% and 45% respectively), and lowest with Greece (6%) and Latvia (2%). Also transatlantic intra-firm trade in goods is largely concentrated a few sectors such as chemical, machinery, and electronic products. Between 2002 and 2012, for example, intra-firm exports of US companies to the EU for chemicals increased from 27% to 36%.
[1] See, e.g., ECB. (2023). The EU’s Open Strategic Autonomy from a central banking perspective. Available at https://www.ecb.europa.eu/pub/pdf/scpops/ecb.op311~5065ff588c.en.pdf.
[2] Also see ECB. (2023). The EU’s Open Strategic Autonomy from a central banking perspective. Available at https://www.ecb.europa.eu/pub/pdf/scpops/ecb.op311~5065ff588c.en.pdf.
[3] Lanz, R., and Miroudot, S. (2011). Intra-Firm Trade: Patterns, Determinants and Policy Implications. OECD Trade Policy Papers 114, DOI: 10.1787/5kg9p39lrwnn-en. Available at https://ideas.repec.org/p/oec/traaab/114-en.html.
[4] USITC (2013). EU-US Economic Linkages: The Role of Multinationals and Intra-Firm Trade. Available at https://www.usitc.gov/publications/332/rn201311b.pdf.
4. Implications for Europe’s Debate on Open Strategic Autonomy
The data presented above shows that there are no critical dependencies on products and services imported to the EU. At the same time, European companies are heavily involved in the global economy and would have much to lose if international trade was increasingly distorted or restricted by non-EU governments inspired by EU policies.
There are only very few “dependencies” in some niche markets, such energy commodities, and certain raw materials. In addition, charges for intellectual property rights indicate that EU businesses rely heavily on foreign innovation and technology, ranging from biomedical innovation to green and digital technologies. However, the conclusion should not be that the EU should break away from foreign supply or try to limit competition from abroad. Any policy intervention should be tailored to the specific product and the specific export country.
Given the small size of the EU imports in which the EU can be considered dependent, it is not advisable to base Europe’s new industrial and trade policies on a general fear of dependency and apply new policies in many sectors or even horizontally (as in the case of investment monitoring or data localisation). Many of these products are easy to substitute and the economy can function without them. For the select few products where dependency is an economic concern, the EU can reduce dependencies by improving the diversity of suppliers, increasing inventories (stock-piling) and offering incentives.
In some services and technology areas, such as cloud services and computing capacities, the EU will continue to rely on non-EU providers. However, it is not accurate to claim the presence of one-sided dependencies in the realm of cloud and digital services. As demonstrated by the data above (Figures 10 to 12), EU companies exhibit robust digital and digitally enables services exports, contributing to balanced digital trade – and as such economic interdependence – with both the US and the rest of the world. Also, as recently estimated by an ECIPE study, industrial policy support under the guise of discriminatory cybersecurity arrangements, which would exclude non-EU cloud services providers from operating in the EU, would lead to significant losses in Member States’ aggregate economic activity and drive a big wedge between economic growth in the EU and the growth of non-EU economies.[1] Smaller EU countries would be disproportionately impacted by GDP losses compared to larger countries. In the most restrictive scenario with broad critical sector coverage, short-term losses in aggregate GDP would be most pronounced in Cyprus (-10.2%), Luxembourg (-9.3%), Malta (-8.5%), the Netherlands (-5.8%), Belgium (-5.4%), Denmark (-4.9%), Ireland (-4.7%), and Sweden (-4.6%). The largest EU economies, Germany, France, Italy, the Netherlands, and Spain would generally experience the highest absolute losses in economic output.
Subsidies have recently been considered in many sectors, including technology development general and the creation of production capacities in tech-intensive industries, such as semiconductors and batteries. Subsidies, however, are complex and costly. While subsidies might work for well-understood products, such as agricultural commodities and active pharmaceutical ingredients, incentivising EU research and production of high-technology solutions, including large-scale data infrastructure and advanced chipsets, are unlikely to lead to success if the aim is to keep pace with the rapidly advancing innovation and global technology competition. Also, several EU Member State governments have recently expressed concerns and urged caution in relaxing EU state aid rules to support, for example, the green industry, fearing it could harm competition within the EU.[2]
The EU is already experiencing a technology gap, which has been growing over the past decade.[3] Corporate data reveals that the EU’s underperformance in technology development, investment, and international competitiveness is largely caused by European businesses struggling to successfully grow and invest in international markets. A recent analysis of corporate data conducted by McKinsey (2022) shows that between 2014 and 2019, large European companies with more than USD 1 billion (EUR 930 million) in annual revenue were on average 20% less profitable than their US counterparts. Also, European businesses’ revenues have grown 40% less than those of US companies, and European businesses spent about 40% less on corporate R&D (see Figure 7)[4] Also, as analysed by the European Commission, the EU holds a much lower number of both larger and smaller R&D investors than the US, in the four high-tech sectors that are key to the aggregate EU R&D intensity gap vis-à-vis the US.[5] The amount of additional investment to duplicate infrastructure and capacities would be enormous. Obviously, this would come at the expense of other important policy goals, such as housing, education, sustainability, etc.).
Generally, subsidies accommodated by trade controls and discriminatory regulation cannot substitute for the benefits that Europeans and others draw from trade and technological openness. Take imported cloud services. Cloud services have become a crucial component of Europe’s economy, fostering collaboration, competitiveness, and innovation. They offer equal access to global data and resources, benefiting businesses of all sizes. Additionally, cloud solutions are transforming public services and enhancing government efficiency. Industry forecasts indicate that cloud services and transversal cloud-based technologies like AI applications, quantum, and edge computing will experience consistent growth in innovation and are increasingly finding broader applications across various industries. Overall, the global market for IT services is highly competitive and dynamic, with global cloud service providers competing against a broad range of IT service providers of varying scale, including on-premises hardware vendors, private and co-located data centre providers and software providers.
Leaving aside raw material shortages, in the long-term supply-side measures are the most effective for improving production capacity, especially for technology-intensive goods and services and help gain the required well qualified professionals. EU policymaking should therefore prioritise supply-side measures, such as competitive taxation, skills development, deregulation, and harmonisation, while promoting regulatory cooperation with like-minded countries rather. The EU and Member State governments must abstain from adopting excessively value-oriented policies that by design or implicitly discriminate against foreign businesses.
The political obsession with trade dependencies belies the need for bold but unpopular structural reforms. Strategic autonomy still is a defensive strategy that conveys an unintended message to the global community. Measured by many initiatives in the realm of economic and technology policymaking, the EU’s strategic autonomy agenda is a backward-looking endeavour. It risks becoming a blueprint for economic nationalism, globally – a justification for governments outside Europe, especially developing countries, to erect new trade and investment barriers on their own. EU policymakers not only risk alienating Europe economically by reducing the openness and exposure of EU industries to international competition and innovation. They also risk isolating the EU politically by pushing a regulatory agenda that will in many cases not be mirrored by major partner countries, such as the larger group of economically developed OECD countries. With new subsidies, discriminatory industrial policymaking and the inflated use of values as an excuse for unique EU action, the EU is paving the way for more government intervention and fewer binding rules in the global economy.
The EU’s strategic autonomy paradigm and the many policies it defends are rooted in a broader set of geopolitical clashes questioning the role of government in society. Most of the EU’s strategic autonomy ambitions are inherently guided by a “European Union First” impulse. It manifests itself in the assumption that EU law-making is somehow superior to – or at least different from – law-making in other parts in the world, including countries that have shared values and common interests.
This sense of superiority encompasses values underpinning policy choices in economic, trade and technology policymaking. Given the persistent issues in the EU’s Single Market[6], strategic autonomy aspirations represent a relapse to old policy making, that of EU Member States independently designing and enforcing rules without considering the economic and political costs of regulatory fragmentation and the risk of economic disaggregation.
Shielding Europeans from foreign competition, however, is what many EU policy initiatives aim to achieve. This is risky for many reasons. European companies are deeply integrated into international markets and value chains, and they have by and large been able to deepen their internal integration as well as to re-orient themselves towards higher skilled and higher value-added service activities.[7] They contribute to global prosperity through international trade and investment. At the same time, European welfare is dependent on global welfare and prosperity growth. EU policies whose intention or effect is to distort, or event break up international value chains undermine economic development and prosperity in the EU.
The costs of the policies outlined in Table 1 are high. New initiatives towards “European standards” and the management of “EU value chains” would also disproportionally impact small EU Member States. A recent study from the Kiel Institute for the World Economy, for example, focuses on increasing market access barriers in the EU and regulatory heterogeneity (regulatory decoupling).[8] The authors investigate the trade impacts from preferential public procurement rules, tax breaks, other subsidies for EU suppliers, as well as import quotas and bans on selected goods. Large countries with a high exposure to international trade, such as Germany and France, would indeed suffer high absolute losses in domestic production and trade. At the same time, small countries, such as Ireland, Malta, Belgium and the Baltics, would be more strongly affected in relative terms, with losses being largest if non-EU countries were to mirror EU policies or retaliate. Small businesses in the EU will find it harder to do business in non-EU countries if governments increase market access barriers through new regulation of regional standards that are difficult to comply with (prohibitive). Negative impacts from regulatory diffusion and retaliation, which accumulate over time, are usually ignored in EU impact assessments.
A study by Frontier Economics and ECIPE[9] also finds the costs of strategic autonomy policies to be significant. It is highlighted that, if implemented, “these initiatives are likely to impose costs on EU imports and exports, which would reduce EU living standards”. Depending on the stringency of the measures involved and the degree of retaliation by EU trading partners that are confronted with EU trade measures, real income would fall by several billion euros annually, with the highest reduction in income and welfare being estimated for scenarios in which retaliation by partners’ kicks in. The negative effects on trade and economic activity result from the fact that the EU’s own measures depress extra-EU imports and exports, causing, for example, annual losses in total exports between some USD 30 billion and USD 65 billion. It is highlighted that certain EU policy inventions may increase trade within the EU, but this increase would be insufficient to compensate for lost trade with jurisdictions outside the EU including the US and OECD countries. In essence, it is stated, the policy measures envisioned under strategic autonomy collectively act as an EU law-induced tax on Europe’s trade with the rest of the world.
The EU’s economic strength and international openness are the prime roots driving its high living standards, resilience, and global geopolitical influence. EU Member States can look back on decades of robust economic growth, but the rates of growth have been poor for a long time. The consequences are now increasingly visible: China is not only catching up but surpassing in many industries. In the transatlantic relationship, the EU risks becoming the junior partner, driven by its profound and rising technology, productivity, and income gap vis-à-vis the United States. In fact, if EU Member States were states in the US, many of them would belong to the group of poorest states. And if the growth trend continues, the prosperity gap between the average European and American in 2035 will be as big as between the average European and Indian today.[10]
EU policymakers have paid little attention to these developments. In fact, the EU’s economic discourse is strangely distant from the ambition to get back to high rates of economic growth. Although the EU Commission is aware of some global trends, the EU’s structural weaknesses are downplayed. At the same time, attempts are being made in many areas to use defensive measures to prevent competition from abroad, especially in technology-driven industries.[11]
Many of these attempts are justified by making references to “European values”. The recurring references to European values, however, create the perception that people outside Europe have different values that could threaten Europeans’ way of life. This perspective centres around the idea that EU trade and technology regulation presents a fundamental choice between European values, on the one hand, and the freedom to do business with non-Europeans on the other. Some EU policymakers advocate for measures like data sovereignty, aiming to convey the impression that Europe needs to isolate itself from the rest of the world to achieve greater digital autonomy. However, true digital sovereignty in Europe relies on citizens and firms having access to key technology services and the ability to understand, use, and modify these services in line with fundamental rights.
Importantly, Europe’s desire to protect citizens and support businesses is not unique, as many OECD countries, including EU member states, have ratified the Universal Declaration of Human Rights and are considering laws in areas of interest to the EU. These countries have also established numerous committees and working groups that cover various policy areas, including trade and technology regulation. Instead of trying to set global standards on its own, the EU should pursue closer market integration and regulatory cooperation with trusted international partners like the G7 and OECD countries. This approach aligns with the EU’s self-interest in advocating for a rules-based international order with open markets, rather than disintegrating from partner countries. The potential consequences of new trade restrictions, increased policy fragmentation, and economic disintegration would come at a high cost for Europeans. With poor economic indicators and low rates of economic growth, coupled with the shifting global economic landscape towards Asia, defensive, isolationist or outright protectionist policies would ultimately diminish its influence and make it a junior partner in international fora.
[1] ECIPE (2023). The Economic Impacts of the Proposed EUCS Exclusionary Requirements: Estimates for EU Member States. Available at https://ecipe.org/publications/eucs-immunity-requirements-economic-impacts/?_gl=1*1p9f6nf*_up*MQ..*_ga*MTI3MDI2NjcwMi4xNjk3ODE3Mjc2*_ga_T9CCK5HNCL*MTY5NzgxNzI3Ni4xLjAuMTY5NzgxNzI3Ni4wLjAuMA.
[2] Euractiv (2023). Eleven EU countries urge “great caution” in loosening state aid rules. 15 February 2023. Available at https://www.euractiv.com/section/economy-jobs/news/eleven-eu-countries-urge-great-caution-in-loosening-state-aid-rules/.
[3] See, e.g., EU industrial R&D investment scoreboard reports. Available at https://iri.jrc.ec.europa.eu/scoreboard.
[4] McKinsey (2022). Securing Europe’s competitiveness – Addressing its technology gap. September 2022. Available at https://www.mckinsey.com/~/media/mckinsey/business%20functions/strategy%20and%20corporate%20finance/our%20insights/securing%20europes%20competitiveness%20addressing%20its%20technology%20gap/securing-europes-competitiveness-addressing-its-technology-gap-september-2022.pdf. Also see McKinsey (2023). The economic potential of generative AI The next productivity frontier. Available at https://www.mckinsey.com/capabilities/mckinsey-digital/our-insights/the-economic-potential-of-generative-AI-the-next-productivity-frontier#/.
[5] European Commission Joint Research Centre (2020). The EU vs US corporate R&D intensity gap: Investigating key sectors and firms. Available at https://joint-research-centre.ec.europa.eu/system/files/2020-03/jrc120008.pdf.
[6] See, e.g., ECIPE (2022). European strategic autonomy – What role for Europe’s fragmented single market? Available at https://ecipe.org/blog/european-strategic-autonomy-single-market/. Also see ECIPE (2023). What is Wrong with Europe’s Shattered Single Market? – Lessons from Policy Fragmentation and Misdirected Approaches to EU Competition Policy. Available at https://ecipe.org/publications/europes-shattered-single-market-eu-competition-policy/.
[7] IW Cologne (2022). Global value chains of the EU member states. Available at https://www.iwkoeln.de/studien/galina-kolev-thomas-obst-policy-options-in-the-current-debate.html. For an earlier data-intensive analysis, also see ECB (2013). Global value chains – a case for Europe to cheer up. Available at https://www.ecb.europa.eu/home/pdf/research/compnet/policy_brief_3_global_value_chains.pdf?fcccc5651bee912e1698e1019c8b3969.
[8] Kiel Institute for the World Economy (2021). Pursuit of economic autonomy can be costly for EU countries, 30 July 2021. Available at https://www.ifw-kiel.de/publications/media-information/2021/pursuit-of-economic-autonomy-can-be-costly-for-eu-countries/.
[9] Frontier Economics and ECIPE (2022). Measuring the impacts of the EU’s approach to opens strategic autnomy. Available at https://ecipe.org/wp-content/uploads/2022/11/Strategic-Autonomy-Impacts.pdf.
[10] See ECIPE (2023). If the EU was a State in the United States: Comparing Economic Growth between EU and US States. Available at https://ecipe.org/publications/comparing-economic-growth-between-eu-and-us-states/?_gl=1*d1k90x*_up*MQ..*_ga*MTAyOTE5MjMxMi4xNjk0NzcwNzkx*_ga_T9CCK5HNCL*MTY5NDc3MDc5MS4xLjAuMTY5NDc3MDc5MS4wLjAuMA.
[11] Prominent examples are the EU Digital Markets Act, the EU Data Act, the EU AI Act and the EU Cloud Cybersecurity Framework (EUCS).
5. Conclusions
The EU’s claims regarding trade dependencies are greatly overstated. Our analysis reveals that only 282 products, representing just 0.82% of EU total imports, can be classified as “dependent”. However, not all of these products can be deemed crucial for the EU economy, as some, like exotic items such as live camels and bamboo, have very limited importance for Europe’s economy. Conversely, products like minerals, fuels, and certain chemical and pharmaceutical items, such as insulin, are considered “dependent” due to their geographic sourcing and potential difficulty in replacement. Accordingly, EU policymaking should only address a very narrow list of sensitive products to overcome critical dependencies. EU’s services imports generally exhibit low dependencies overall. However, the exception lies trade in intellectual property, indicating a substantial reliance on foreign innovation across various EU industries. FDI and trade data shows that European companies are heavily involved in the global economy and would have much to lose if international trade were increasingly distorted or restricted by non-EU governments inspired by EU policies.
In certain technology-intensive sectors, such as cloud services and digital technologies, EU economies and their development will remain “reliant” on non-EU providers in the foreseeable future. EU policymakers should generally avoid adopting discriminatory measures that could negatively impact economic development in the EU. While subsidies have been under consideration across multiple sectors, they are a costly and typically inefficient means for closing the EU’s technology and productivity gap. The enormous amount of additional investment needed to duplicate technical infrastructure and production capacities would come at the expense of other important policy priorities, such as housing, education, sustainability.
The EU’s current pursuit of open strategic autonomy is based on misconceptions about economic dependencies and potential harms, which may lead to inward-looking trade, investment, and industrial policies that could hinder international cooperation and economic growth, especially in small EU Member States. The EU and Member State governments must abstain from adopting excessively value-oriented policies that by design or implicitly discriminate against foreign businesses. With poor economic indicators and low growth rates, coupled with the shifting global economic landscape towards Asia, the EU risks diminishing its influence and becoming a junior partner in international fora.
To tackle low growth and inflation (stagflation) and close the EU’s profound technology gap, the EU Member States must pursue supply-side policies while increasing cooperation with like-minded countries such as the US and the larger group of OECD countries. EU policymaking should prioritise competitive taxation, skills development, deregulation, and harmonisation, while promoting regulatory cooperation with like-minded countries.
Annex
Table 4: List of 282 product categories in which the EU is dependent on the rest of the world (2022)

Table 5: List of 82 product categories in which the EU is dependent on China (2022)
