The EU’s Trade with Emerging Markets: Climbing the Value-added Chain and Growing IP Intensity?
Published By: Matthias Bauer Fredrik Erixon
Subjects: EU Trade Agreements Regions Sectors
Summary
International trade is a powerful force of societal transformation. Trade agreements not only stimulated trade; they have improved the quality and integrity of domestic economic and political institutions. This view on trade as a force of institutional development and societal transformation has been reinforced in the recent decade when the routes to the world market for developing countries have been through global supply and value chains of multinational firms. In this paper, we examine whether the trade profile of fast-growing emerging economies reflects the broader theory that has underlined thinking about trade: when these countries grow, do they expand their import from developed countries in the direction of high value-added goods in order to get access to technology and knowledge that they cannot produce as efficiently at home?
We find that the EU has seen strong growth in patent-intensive sector exports. Europe’s aggregate trade performance with key emerging economies has confirmed the expectation about the composition trade between an advanced economy and an emerging economy. Accordingly, the EU has by a high degree of certainty been able to climb the value-added chain through trade with emerging economies. However, the pattern of trade is not always as expected, or predicted by theories of comparative advantage. Trade in the EU’s major patent-intensive sectors – chemicals, pharmaceuticals, and motor vehicles – has generally evolved in a positive fashion in the period studied. However, recent years have witnessed a deterioration of EU exports in theses sectors.
In many instances, these deteriorations are not the result of the EU’s industrial mix. The under-performance in EU exports can be ascribed to local factors that artificially depress EU corporate competitiveness in those markets. In countries like Brazil, India and South Africa, these factors tend to be very strong and show a clear upward potential for the EU in improving the gains it can reap from trade in patent-intensive sectors. As a consequence, EU trade policy should focus on those sectors that show a strong potential export and import performance, but where other factors than economic competitiveness have caused trade under-performance in the past.
1. Introduction
International trade is a powerful force of societal transformation. Time and again through modern history, countries have begun a process of economic development by stepping into the global market for trade and investment. Greater integration with other markets has provided new economic opportunities, both for real business and for policy makers desiring to better domestic policy framework for economic and regulatory policy. Apart from promoting trade, trade agreements have improved the quality and integrity of domestic economic and political institutions, leading to greater economic benefits outside the field of cross-border trade.
The importance of trade for economic development is widely acknowledged, but there has been a wing of the argument that has seen it through the exclusive prism of export. This school of thought – pointing to export powerhouses such as China and, before that, the Asian Tiger economies – has suggested the role of trade for economic development is largely a story about exports, in essence by scaling up competitive production and selling abroad. That view has been powerful in trade politics, but has always been at odds with the economics and real experiences of trade. The process of trade and economic development is dependent on import as much as on export – and importing technology or other competitive input products have been necessary for countries to enable exports, let alone improving the efficiency of production. For economies like Brazil and China, about three quarters of their import are intermediary goods. Similarly, good access to foreign capital and a flow of inward investment have always been critical elements of development, in early stages as well as when countries have moved into middle-income status. Making themselves an attractive destination for investments, aspiring countries have also needed to ensure good conditions for imports.
This view on trade as a force of development and societal transformation has been reinforced in the recent decade when the routes to the world market for developing countries have been through global supply and value chains of multinational firms. The fragmentation of value chains has expanded trade and investment, and made it more important for emerging economies to get their policies to reflect good global economic standards.
In this paper, we aim to discuss the nexus of policy standards and volumes of trade, especially the volumes of imports. A number of countries like the BRICS or MINTS have experienced a decade of very fast economic expansion, manifested in general economic growth as well as in the indicators of economic integration with other parts of the world. The question we want to examine in this paper is whether the trade profile of fast-growing emerging economies reflects the broader theory that has underlined thinking about trade: when these countries grow, do they expand their import from developed countries in the direction of high value-added goods in order to get access to technology and knowledge that they cannot produce as efficiently at home? One can also look at it the other way around: has the growth of emerging markets shifted the export profiles of developed regions to the emerging regions? Does their export growth especially manifest itself in products with a higher share of technology, knowledge and value-added?
Basic trade theory on specialisation prompts the view that there should be a shift in the pattern of exports: an entity like the European Union should have seen a relatively faster expansion of one type of products relative to others in its exports to emerging economies. Related to that is the larger political defence in developed regions in their trade with emerging economies: even if imports from emerging economies have grown faster than exports (leading to a shift in the trade balance), the exports that have grown are goods that generate high value-added growth that in turn can provide for more and higher-paying jobs. In this paper, we also aim to examine this sensible political proposition.
The paper is structured as follows. Chapter 2 gives a long overview of trade and economic expansion in emerging economies, and how they have integrated with the EU, in the past ten years. Chapter 3 analyses headline numbers of trade in the in the “ideas economy”, or trade that usually has a higher value-added content. Chapter 4 dives a bit deeper into general trade data in patent-intensive sectors to analyse whether patent reforms have made an impact on EU exports in its top patent-intensive goods. Chapter 5 provides quantitative analysis to examine how the shifts in the trade patterns between the EU and emerging economies reflects structures of production – and whether trade expansion has happened in those sectors you would expect on the basis of basic trade theory and the popular perception about what trade that should grow in trade relations with emerging economies. The chapter is centred around a shift-share analysis of trade in patent-intensive and less patent-intensive sectors. Importantly, it looks at two periods of trade in order to capture the direction of change in recent years. Chapter 6 concludes the paper.
2. Trade Performance – EU-BRICS/MINTS
2.1 General Trade-policy Development
The past decades have witnessed a rapid expansion of trade in emerging markets. On the back of past openings to the global economy, many countries have helped to grow their economies by integrating themselves with regional and global trade patterns. General economic conditions have been favourable, especially in the period leading up to the crisis when most parts of the world enjoyed a “Goldilocks” macro-economic environment. For most emerging markets, the crisis years have been good too. The decline in key export markets like Europe and the United States certainly had an impact, but most of all only through slowing down growth in trade rather moving into stagnation. While there is evidence now suggesting a structural shift in especially the way Asian countries trade with Europe, regional trade in emerging regions like Asia is about to take another giant leap forward as the region grows less dependent on intermediary trade and more dependent on final goods trade.[1]
While trade in emerging markets has been in good health, emerging markets trade policy – or commercial policy more generally – is another story. The past years have witnessed a considerable decline in reform appetite and less willingness to continue a process of reforms to reinforce an economic strategy of growth and development. The BRICS countries are a case in point.
After half a century of import-substituting policies, Brazil transitioned from a closed to a world integrating economy in the late 1980s. However, the country has had little to no trade liberalisation and structural reform since mid-1990s. Trade and FDI liberalisation have not improved with the Lula da Silva and Dilma Rousseff administrations.
Trade liberalisation in Russia started in 1990s, but took a new turn following President Putin’s second term. Politicised and selectively-applied measures related to economic regulations have increased in the past decade along with state control on internal and external trade. Following entry into the WTO, Russian trade and commercial policies have seen selected reforms. Yet, it remains a fairly closed economy and the recent economic standoff with Europe and the United States has reinforced levels of protection. Russia is now subject to trade sanctions, and employs such sanctions itself.
India moved towards ending the “licence raj” in 1980s, but its opening up to the world economy only started in 1991. However, trade liberalisation and related structural reforms have stalled since the Congress-led government took charge in 2004. The current Modi government is expected to move the country away from bureaucracy and its complex system of duty exemptions and investment regulations, but it remains to be seen if such reforms are launched and if they encourage trade and enhance market access.
Reforms in China have started ahead of all the BRICS. Trade and FDI liberalisation have been ongoing since 1978. Since its accession to the WTO in 2001, China’s trade with the EU and the rest of the world has grown very rapidly. By some measures, it surpassed in 2014 the US in becoming the world’s largest trading nation. However, further trade liberalisation has stalled in recent years, mainly in services. Investment restrictions have also increased in order to support domestic sectors and state-owned enterprises. New reform programmes have been designed, but few actual trade reforms have emerged as a consequence of them.
Highly protected under apartheid, South Africa opened up to the world economy in mid-1990s following its transition to a multiracial democracy. A quick burst of unilateral trade and FDI liberalisation followed by a Free Trade Agreement (FTA) with the EU in 2000. However, remaining protectionism and domestic regulatory barriers have proved an obstacle to domestic and foreign investment. The current government has reinforced barriers and generally deteriorated the climate of doing business in the country.
The picture does not look much better in the second-tier group of emerging economies – so-called MINTS countries like Mexico and Indonesia. Trade and FDI liberalisation started in the mid-1980s in Mexico, followed by the NAFTA agreement in 1994 and an FTA with the EU in 2000. Both trade and FDI liberalisation have been critical in growth of exports as well as foreign investment in the country. However, the problem with Mexico has been its inability to reform domestic regulatory barriers to complement its trade liberalisation.
Indonesia considerably opened up to the world economy in the late 1980s and early 1990s, followed by an IMF structural package in 1998. However, there has been a reform slowdown ever since. Although overall protection has not increased, domestic regulations have increased business costs in the country and discrimination remains a strong tenet in the actual conduct of trade policy.
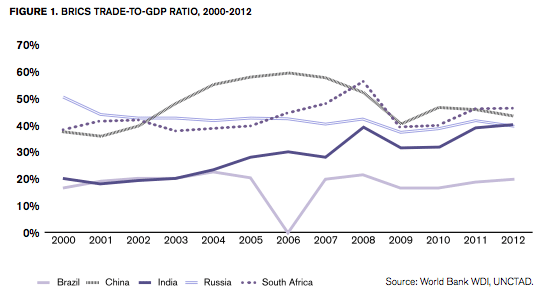
Despite stalling trade and FDI liberalisation, trade has been critical to BRICS integration into the world economy in the past decade. Despite some volatility, it has also been growing. India’s trade-to-GDP ratio has rapidly grown from below 20% in 2000 to above 40% in 2012. South Africa is another country with a relatively high trade-to-GDP ratio at around 50%, which is the highest of the BRICS. China’s trade-to-GDP ratio has been declining in recent years due to the global financial crisis, but it is still above India, Brazil and Russia at 45%, which is high for a country with a big population. However, Russia has had declining trade-to-GDP ratio from above 50% in 2000 to 41% in 2012, and it has continued downward because of falling commodity process and recent trade sanctions. Of all the BRICS, Brazil is the least sensitive to changes in the global trading economy with the lowest trade-to-GDP ratio of the BRICS at 20%.
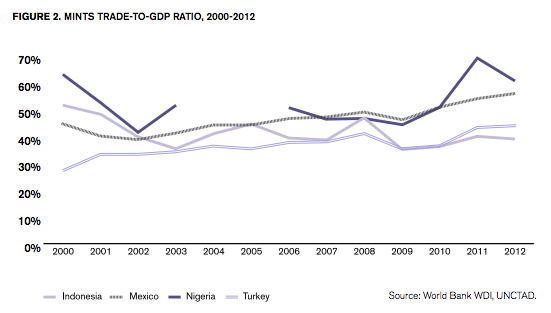 Nigeria and Mexico both have trade-to-GDP ratios at above 60%, while Turkey’s trade-to-GDP ratio grew from 30% in 2000 to about 50% in 2012. In contrast, Indonesia’s trade-to-GDP declined from close to 60% in 2000 to just above 40% in 2012. In general, MINTs enjoy a higher level of trade openness compared to the BRICS, at least when measured in real economic terms. That should not be surprising: small countries usually have a larger trade sector than big countries. For countries like Nigeria, the actual levels of trade largely reflect the development of global commodity prices, which is volatile.
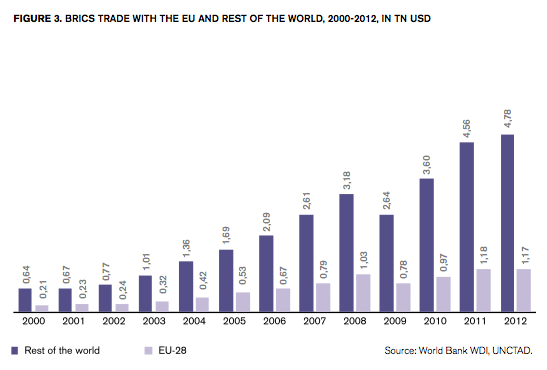
Despite declining trade-to-GDP ratios in some BRICS countries in recent years, a relatively steady liberalisation has resulted in increased trade volumes and higher shares in total global trade in the past decade. However, as Figure 3 shows, the EU has not been able to take full advantage of this situation as BRICS country trade with the rest of the world has grown much faster than trade with the EU. Although EU trade with BRIC countries has grown from around 200bn USD in 2000 to over 1tn USD in 2012 (a plus of 457%), this growth has been slower than BRICS trade with the rest of the world. BRICS trade with rest of the world grew from just over 600bn USD in 2000 to about 5tn USD in 2012 (a plus of 647%).
This pattern of trade expansion is not exclusive to the BRICS group. MINTs trade with the EU and the rest of the world has grown at a somewhat lower rate in the past decade. In 2012, as the Figure 4 shows, MINTs total trade with EU stood at 300bn USD compared to a mere 87mn USD in 2000 (a plus of 245%). MINTs trade with the rest of the world increased from 470bn USD to 1.39tn USD (a plus of 196%).
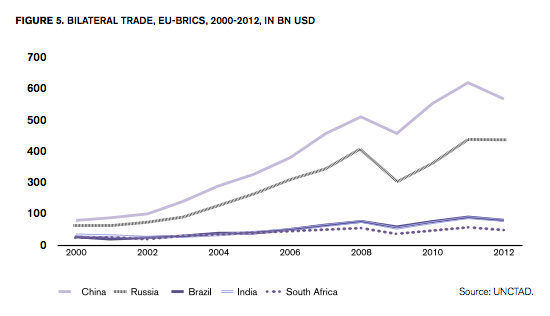
None of this is evidence of policy problems in the EU’s trade relations with these countries. Bilateral trade between BRICS as a group and the EU has been growing in line with the increase in their share of world trade, and Europe’s share of world trade has naturally declined. However, the general pattern for the entire BRICS group masks important differences. India, Brazil and South Africa have experienced a growth of trade with the EU that has been slow. Trade between the EU and China and Russia have, on the other hand, expanded rapidly. In 2000, BRICS had a similar level of bilateral trade with the EU, each country’s trade at a level between 50bn and 100bn USD. In 2012, while EU trade with Brazil, India and South Africa still stands at around 100bn USD each, EU-Russia and EU-China trade have grown to 420bnUSD and 600bn USD respectively. The determinants of trade between the EU and China and Russia, respectively, are different. Proximity is a strong determinant in Europe’s trade with Russia, which is clearly is not in the case of China. For China, Europe’s trade expansion has largely been driven by supply chains and demand for particular types of goods. Notably, almost 50% of Europe’s export to China comes from Germany.[2]
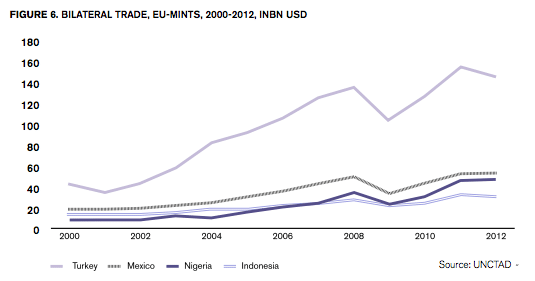
Taking account of the MINTs group, Turkey is, unsurprisingly, the outstanding performer as its trade with the EU has increased from around 45bn USD in 2000 to 160bn USD in 2012. EU trade with Mexico, Nigeria and, to a lesser extent, Indonesia has also been growing, but not by much if compared to Turkey. Indonesia has merely managed to double its trade with the EU from 15bn USD in 2000 to just over 30bn USD in 12 years.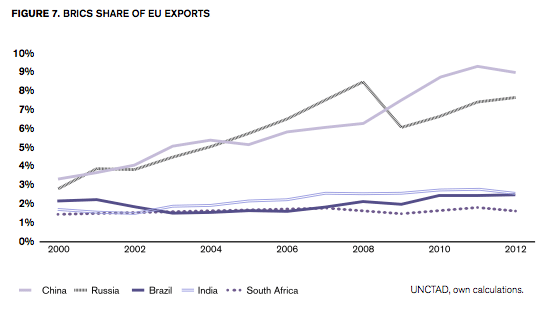 Russia and China have been two of the largest markets for EU exports in the past decade. Russia’s share of EU exports grew from just over 2.5% in 2000 to well over 7% in 2012, while China’s share of EU export grew from 3% in 2000 to 8.5% in 2012. In contrast to China and Russia, EU exports to other BRICS have not moved much, certainly not in line with the general growth of trade in these countries – or in line with increasing domestic demand. From 2000 to 2012, Brazil’s and South Africa’s shares in EU exports grew by a mere 0.3% and 0.2% in that order. Similarly, India’s share in EU exports just grew from around 1.5% in 2000 to little over 2% in 2012.
The growth of EU exports to MINTs has been far below potential. In the 12 years from 2000 to 2012, Turkey and Nigeria’s share in EU exports have had little growth at below 0.5%, while EU exports to Indonesia and Mexico have not grown at all. An FTA between the EU and Mexico was concluded in 2000, but it has had little impact on EU exports when measured as share of total exports.
2.2 Capital goods trade
Aggregate volumes of trade is one thing, the profile of trade is another. In this section we will look closer at what type of trade has grown between the EU and fast-growing emerging markets.
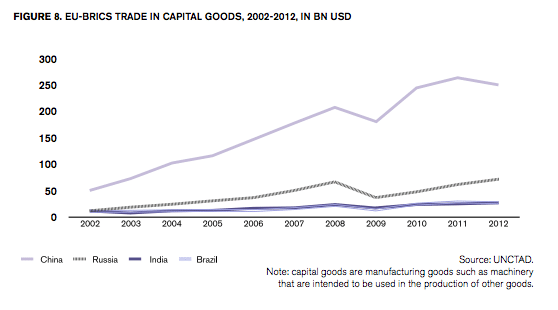
Capital goods trade, i.e. trade in manufacturing goods such as machinery that are intended to be used in the production of other goods, makes up the largest portion of overall EU-BRICs trade. Trade in capital goods was close to 380bn USD in 2012, an increase of around 300bn USD since 2002. This is largely due to increase in EU capital goods trade with China and Russia alone as trade with India and Brazil has significantly underperformed. While EU-China trade in capital goods grew by more than 200bn USD in the ten years from 2002, EU-India trade only grew by 20bn USD in the same period.
If we put the bilateral trade expansion in capital goods in relation to GDP growth, we find a similar pattern as in the aggregate volumes of bilateral trade for capital goods. The data suggest two patterns: firstly, there has been a structural shift in trade between the EU and China and Russia, accounting for the clear rise of bilateral trade as part of GDP. Secondly, trade growth in relation to Brazil and India have been cyclical and followed the trend of an expansion in the general trade-to-GDP pattern. It is noteworthy that EU trade in capital goods with India was not bigger than 20bn USD in 2012, while EU-China capital goods trade stands at 255bn USD after a recorded ten-year growth of 430%.
At around 85bn USD in 2012, EU-MINTs trade in capital good is significantly low when compared to EU-BRICs data. The groups of MINTs comprises large economies with a relatively high economic growth rate for the past decade. However, the data shows that there remains a great potential for growth in EU-MINTs trade in capital goods, particularly for Indonesia and Nigeria.
Put in relation to GDP, a declining trend can be observed for EU capital goods trade with Nigeria and Indonesia between 2002 and 2012. While EU trade with Turkey and Mexico has experienced a slight growth, the overall conclusion is that EU-MINTs trade in capital goods has not grown in line with these countries’ advances in domestic economic activity.
2.3 Consumer goods trade
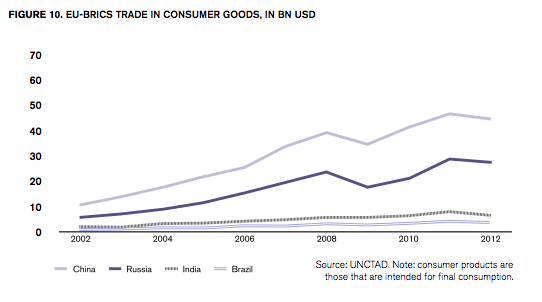
EU-BRICs trade in consumer goods has grown from 82bn USD in 2002 to around 370bn USD in 2012. At the same time, trade in consumer goods has not grown as fast as expected given the growth in consumer demand in those countries. Although trade in this category with China and Russia has performed better over the last decade, there has been slow growth in EU trade in consumer goods with India and Brazil. In 2012, EU consumer goods trade with China exceeded 200bn USD, while EU-India and EU-Brazil trade remained below 30bn USD and 20bn USD respectively.
Brazil and India experienced an average GDP growth of around 3.5% and 7.5% between 2002 and 2012, while China had an average GDP growth of more than 10% in the same period. While Russia and China, to a much lesser extent, have performed well, EU trade in consumer goods with Brazil and India has not grown much given the growth in both GDP and consumer demand in these countries. Again, trade expansion with Brazil and India show a cyclical pattern, but not a structural rise, as can be observed in EU trade in consumer goods with China and Russia.
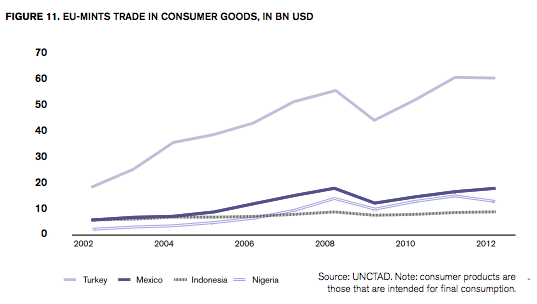
At 95bn USD in 2012, EU-MINTs trade in consumer goods is low compared to BRICS countries. Looking at numbers alone, EU-Turkey trade in consumer goods is the highest in the group of MINT countries. However, the same is not true when put in relation to GDP. When measured in terms of GDP, EU trade in consumer goods with Nigeria and Mexico have performed comparatively better than Indonesia and Turkey. This figure demonstrates a declining trend in EU trade with Indonesia in the past decade. This is not surprising given the EU’s meagre exports increase in consumer goods to Indonesia from 685mn USD in 2002 to 1.58bn USD in 2012.
2.4 Intermediate goods trade
A similar pattern as in the previous categories of trade can also be found in trade in intermediary goods, i.e. trade in products comprising semi-finished goods that are used in the production of other products. Intermediate goods trade has been growing in importance in the past decade. Rising trade in intermediate goods is a direct consequence of the international fragmentation of production and the rise of global supply chains. Figure 12 shows that EU trade with BRICs in intermediate goods has increased from 43bn to 166bn USD in between 2002 to 2012. However, given the overall growth in trade, the above increase in intermediate goods trade with BRICs is not that significant.
The underperformance of EU trade in intermediate goods with some BRICs countries can be further illustrated when put in relation to GDP. Intermediate goods trade with Brazil, China and India has significantly underperformed compared to Russia. This is despite the fact that Brazil, China and India are significantly integrated into global production networks, and according to the OECD (2009), each of them has a share of intermediates in total imports of more than 70%, well above the OECD average of 56%.
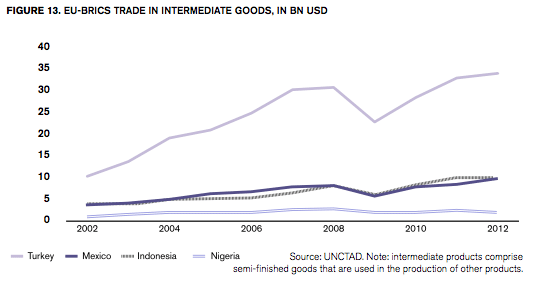
At around 50bn USD, EU-MINTs trade in intermediate goods is far below potential. Although trade with Turkey, Mexico and Indonesia have experience growth in the past decade, there is a general downward trend in EU-MINTs intermediate goods trade when put in relation to GDP.
When measured in terms of GDP, EU-MINTs trade in intermediate goods has not grown at all in the years from 2002 to 2012. The BRICs have performed relatively better than MINTs. This is probably due to regulatory barriers in these countries as intermediate goods, contrary to consumer goods, depend less on market size and consumer preferences.
2.5 Concluding Comments
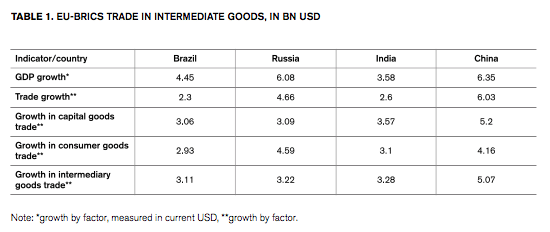
What is the overall picture of this analysis of the types of trade that has expanded between the EU and BRICs countries? Table 1 summarises the above findings. One distinguishing pattern is that China and Russia are different from Brazil and India in growth in trade with the EU. For the BRICs, it turns out that “country” is a stronger determinant than type of trade. Moreover, the expansion in bilateral trade with the EU has been stronger in countries with a faster expansion of GDP. However, trade growth vis-à-vis the EU has expanded at a slower pace than GDP in BRICs countries. This is striking since the general pattern for BRICs countries is that their overall trade has expanded faster than GDP. While there are differences between the countries based on endowment and comparative advantages, many emerging markets have practised export-led economic growth and thus seen a faster expansion of trade than domestic demand.
[1] Erixon (2015a).
[2] Hansakul and Levinger (2014).
3. Trade with Emerging Economies in the “Ideas Economy”
The development of the “ideas economy” has been closely associated with globalisation. The concept of the “ideas economy” covers every aspect of modern economies where economic success is progressively built on the effective use of intangible assets such as knowledge, skills and innovative potential as the main sources of competitive advantages. However, the science of describing, understanding and measuring ideas and knowledge is unsatisfactory and gives neither a single definition of what it represents nor a single explanation of its broader impact on trade, output, and economic growth. As one report concludes, the “knowledge driven economy is not just a description of high tech industries. It describes a set of new sources of competitiveness advantage which can apply to all sectors, all companies and all regions, from agriculture and retailing to software and biotechnology”.[1] For this reason, we take a measurable definition of ideas economy that is inclusive of all sectors, but divide it into idea-intensive goods and idea-intensive services. Like the previous chapter, this chapter aims to provide an understanding of the trade development between the EU and emerging markets.
3.1 Idea-intensive goods
Idea-intensive goods include goods that have high innovation content and help transmit knowledge and information across borders. Acknowledging the capacity of patents to encourage innovation and technological change, and generally help transmitting knowledge and information throughout the economy, this section examines trade in patent-intensive industries between EU and BRICS/MINTs.[2]
EU trade in patent-intensive industries (those that have a high average number of patents per employees)[3] with some BRICS countries is clearly below potential. Figure 14 demonstrates trade between the EU and BRICS in the top-20 patent-intense sectors between the years 2002 to 2012 (for a definition of patent-intensive sectors, see EPO 2013). Obviously, EU trade with Brazil, South Africa and India in these goods have not evolved much. EU-India trade in top-20 patent-intense sectors grew by only around 15bn USD between 2002 to 2012, while EU-China and EU-Russia trade in the same sectors increased by around 100bn USD and 200bn USD respectively. Put in relation to GDP, growth in EU patent-intensive goods trade with Russia is even more impressive compared to the rest of the BRICS.
EU trade with India in patent-intensive goods is even lower than trade with other MINTs countries as shown by Figure 15. Compared to India, even Nigeria and Turkey are more important partners to the EU. Another underperformer in patent-intensive trade with the EU is Indonesia with a trade value of less than 7bn USD in 2012.
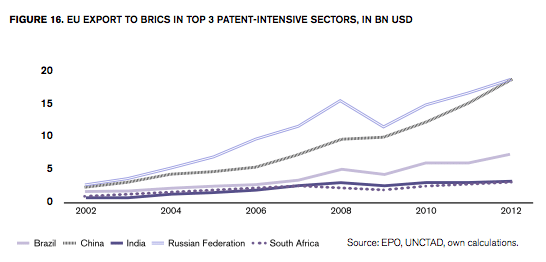
Figure 16 illustrates EU exports to BRICS countries in top 3 patent-intensive goods. The development of exports indicates: the more patent-intense the good, the smaller the expansion of bilateral trade with the EU, in this case imports form the EU, for Brazil and India. EU exports to China and Russia, however, expanded faster than trade expansion in other categories. The groups of goods in question are machine tools, basic pharmaceutical products, and other chemical products. EU exports to China and Russia are at the same level, at above 16bn USD each in 2012. There has been a slower increase in EU trade with Brazil over the same period from around 2.5bn USD in 2002 to 6.5bn USD in 2012. However, India and South Africa exhibit the slowest expansion as EU exports in most patent-intensive goods to both countries combined remained below 3bn USD in 2012.
3.2 Idea-intensive services
Like idea-intensive goods, idea-intensive services transmit knowledge and information across borders. The diffusion of knowledge and information is highest in services that utilise highly skilled labour such as insurance, financial, communication, computer and information and other business services. In order to measure EU-BRICS trade in idea-intensive services, this section provides data for services that utilise highly skilled labour. Data on trade in services, however, is much poorer than data on trade in goods, which is why this section only covers a limited number of years.
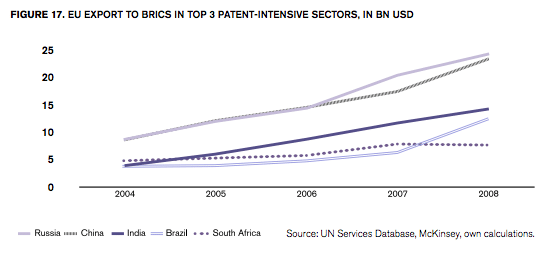
In idea-intensive services, EU trade expansion with BRICS has generally been stronger than for trade in idea-intensive goods. Even Brazil and India have recorded a distinct expansion, with India recording 14bn USD in 2008, which is higher compared to Brazil and South Africa, but still far behind China and Russia. The UN Services Database provides data only for the years 2004 to 2008, but it would be interesting to see the data for the years following the global financial crisis as the decline is likely to have been sharp since 2009. Today, idea-intensive services are growing faster than capital and labour-intensive services. Countries such as India have become major global services providers mainly because of idea-intensive industries.
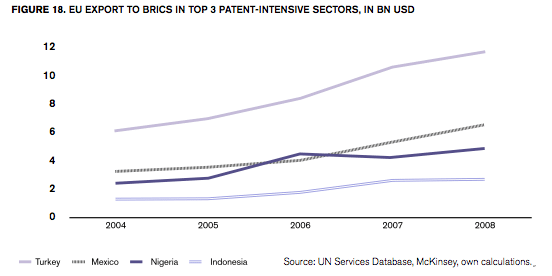
Looking at EU-MINTs trade in ideas-intensive services, there seems to be a steady increase in the years between 2004 and 2008. However, given the fact that idea-intensive services today are growing faster than traditional capital and labour-intensive services around the world, there also remains great potential for further growth. It should be noted that idea-intensive services can trigger innovation in both their own services categories and in the production of services that are generally known as labour or capital-intensive services. Ideas or knowledge-intensive services are now an important input for labour and capital-intensive services. Examples are multiple delivery and retail services, but also a wide range of financial and business services.
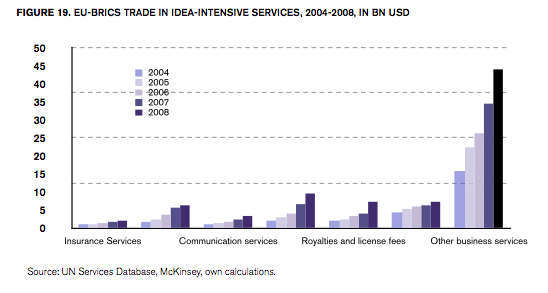
Figure 19 disaggregates idea-intensive services and shows growth of EU-BRICS trade in individual services from 2004 to 2008. Trade in computer and information services has grown much faster than trade in insurance services, for instance. In the four years following 2004, insurance services trade has barely doubled from around 1bn to 2bn USD (100%), while computer and information services trade grew from around 2bn to almost 10bn USD (500%). Financial services have generally grown faster than insurance services. The chart also shows that other business services are the dominant category in EU-BRICS services trade.
3.3 Concluding comments
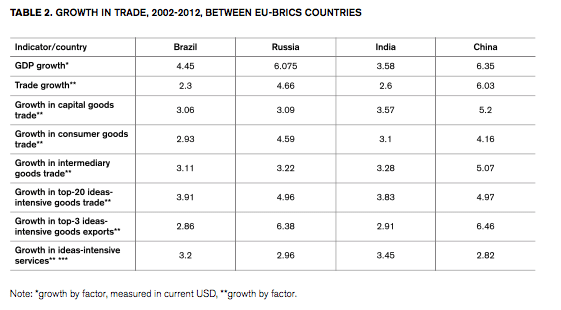
Let us now return to the table summary of trade expansion – and trade expansion in idea intensive goods and services. The general pattern does not change much as far as trade in goods are concerned. The significant difference is that for Brazil and India, the rate of expansion declines when trade gets a higher “ideas” content.
[1] Leadbeater (1999).
[2] For a review of the literature on the contributing role of patents to innovation, see Erixon (2015b).
[3] Patent-intensive industries in the EU have an average number of patents per 1,000 employees that exceeds the overall average of 0.69. IPR-intensive industries contribute 26% of employment and
39% of GDP in the EU. Patent-intensive industries, primarily manufacturing and research and engineering industries, account for 14% of EU-GDP (EPO 2013).
4. Trade and IP Reforms
In ideas economies, intangible goods and services are increasingly important. Investment in intangibles is growing heavily around the world. However, there remains a huge gap in the stock of intangibles between the BRICS and advanced economies. Given the lag in economic development in the BRICS, the gap is not surprising. However, they need to find a way to expand intangibles and one factor to spur such a development is the performance of intellectual property rights. There is a general positive relationship between economic performance and the strength of IP rights, and between the level and dynamics of domestic innovation and patent rights, for instance.[1] In general, sound intellectual property rights regimes provide incentives to innovate and allow the developers of intangibles to commercialise products and services.
Following the TRIPS agreement in 1995, the average protection of IP rights has strengthened in both OECD and non-OECD economies. However, many countries have undertaken unilateral reforms. BRICS have all had IP reforms in recent decades, but there remains great difference in the IP environments in these countries. In light of the scale of IP reform efforts and variation in IP policies between BRICS, it is essential to see how this difference affects EU trade with the BRICs.
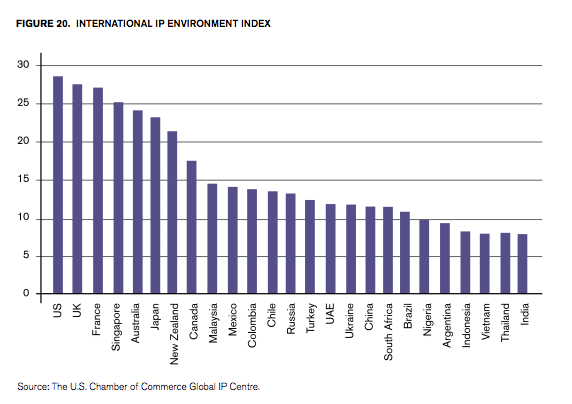
Of all BRICS/MINT countries, India provides the weakest intellectual property protection environment as measured by the Global IP Index. The U.S. Chamber of Commerce’s Global IP Centre maps the IP environment in 25 countries using 30 indicators of IP environment that nurture economic growth and modernisation. Each indicator is scored between 0 and 1 and the maximum achievable score for a country is 30. According the GIPC index, China has the highest score of all middle-income countries. India, on the other hand, is moving backwards with the weakest IP environment of all 25 countries. Compulsory licensing, patent revocation and weak legislative and enforcement mechanisms are the main reasons for India’s poor score.
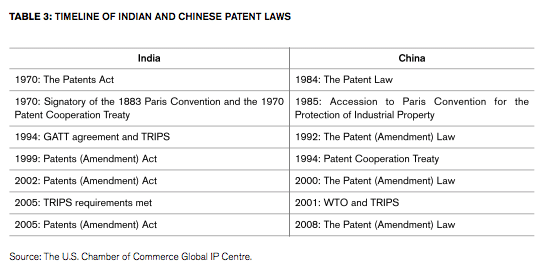
Both China and India have undertaken patent reforms since the early 1990s. However, there is a striking difference between the two countries. In patent and related rights, China scores above 4 while India scores 1 out of 7 with 0 marks for: patentability requirements, patentability of computer-implemented inventions, pharmaceutical-related patent enforcement mechanism, legislative criteria and use of compulsory licensing of patented products and technologies, patent term restoration for pharmaceutical products, and regulatory data protection term. This is also reflected in EU trade with these two countries in the past decade.
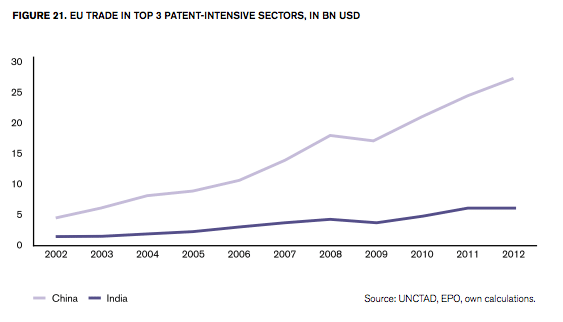
Figure 21 shows trade after patent reforms in India and China in top 3 patent-intense sectors. There has been an increase of around 3bn USD in EU-India trade in patent-intense sectors following India meeting its TRIPS requirement in 2005 and passing a patent (amendment) act in the same year. However, the change in EU-China trade is much more significant following Chinese patent (amendment) laws in 2000 and 2008. As of 2012, EU-India trade in top 3 patent-intensive sectors remains below 6bn USD while EU-China trade in the same sectors stands at more than 26bn USD.
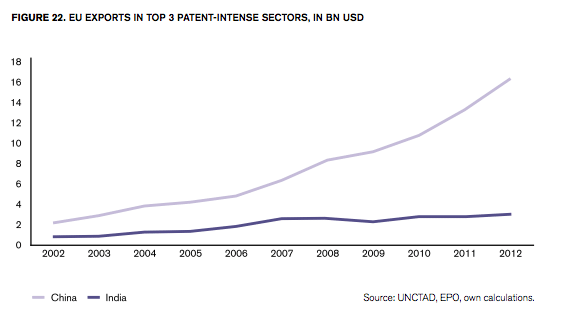
Similarly, the increase in EU export to India and China in top 3 patent-intensive sectors, following reforms, is reflected above. The top 3 patent-intense sectors consist of machine tools, pharmaceutical products and other chemical products. While there is a significant rise in EU exports following China’s 2008 patent amendment act, there is no discernable shift in the trend in EU exports to India. If this category is disaggregated, there is no significant trade change in EU export of pharmaceutical goods to neither China nor India. There is a slightly different trend in inward pharmaceutical FDI for India. It is far more volatile and there has been years when inward pharmaceutical FDI represented a significant share of total inward FDI. These observations are all from the period after the latest patent amendment act.
[1] Park and Lippoldt (2008).
5. A Shift-share Analysis of EU Trade with Emerging Economies
The previous chapters have shown EU trade with emerging economies and disaggregated trade flows in order to understand whether trade growth has been weaker or stronger given the growth of the general economy. In this chapter, we will deepen the analysis of EU trade performance with selected emerging markets, the BRICS-MINT countries, and study if trade performance follows expectations given a number of other factors, including the expansion of the EU’s general trade, the industrial structure, and regional patterns of trade in the EU and BRICS-MINT countries. In order to detect trend shifts in the composition of trade, we will compare the trade development between two periods of time. While the analysis focuses on the period 2003-2013, we will separately study the sub-period 2011 to 2013 in order to account for recent shifts in global trade patterns and trade volumes as reported in the WTO’s World Trade Report (WTO 2014).
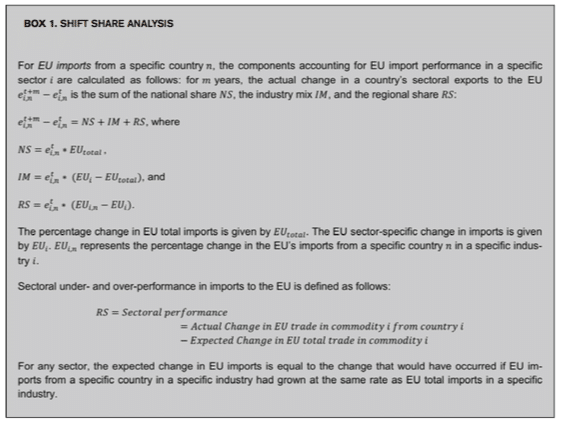
Distinguishing between patent-intensive and less patent-intensive sectors, we start with an overview of descriptive statistics of EU exports to and EU imports from BRICS-MINT countries. In a second step, we apply a shift-share methodology in order to identify the components accounting for sector-specific changes in EU exports to and EU imports from BRICS-MINT countries (see Box 1 for technical details).
The same methodology is applied to both exports and imports. Following the shift-share logic, for EU imports, for example, we assume that the EU’s growth in sectoral imports from BRICS-MINT countries is explained by three factors:
Growth in total EU imports (national shift, NS): This number shows how the EU’s sectoral imports from a specific country would have grown if they had increased at the same rate as EU total imports for a given period.
Commodity composition (industry mix, IM): The industry mix effect reflects how the EU’s sectoral imports from a specific country would have grown if import growth in each industry would have increased at the same rate as growth in EU total imports in that industry. The difference between import growth calculated this way and import growth that would have been experienced if the EU’s imports from a specific country had grown at the same rate as total EU imports is the commodity composition effect.
Change in competitiveness (regional shift, RS): This number shows the difference between the actual change in EU imports from a specific country in a given industry and the change that would have occurred if each industry’s imports from a specific country had grown at the same rate as total EU imports growth in that industry. This number shows whether specific sectors have over or under-performed relative to EU total imports in a specific industry.
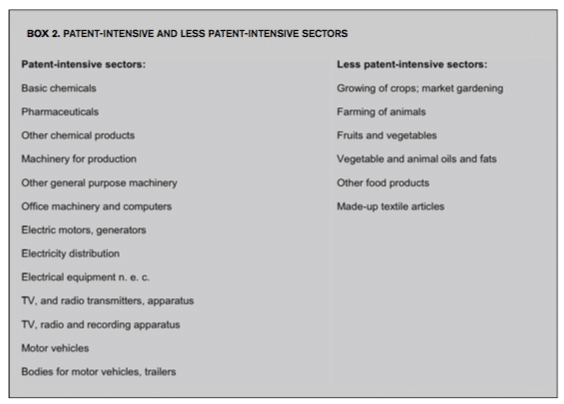
We distinguish between patent-intensive sectors and less patent-intensive sectors (see Box 2). Our categorisation roughly follows the European Commission’s and the European Patent Office’s industry-level analysis for intellectual property rights-intensive industries (EPO 2013). For less patent-intensive sectors, we choose those sectors that show comparatively high shares in EU-BRICS-MINT trade volumes.
4.1 Patterns in EU-BRICS-MINT Trade
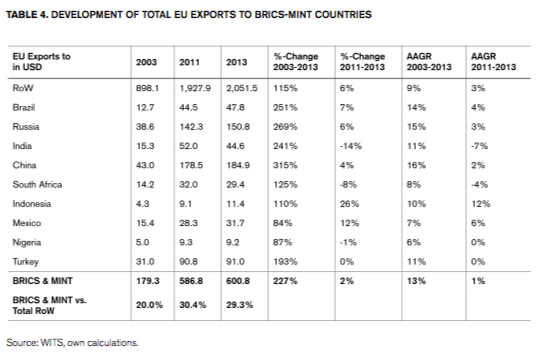
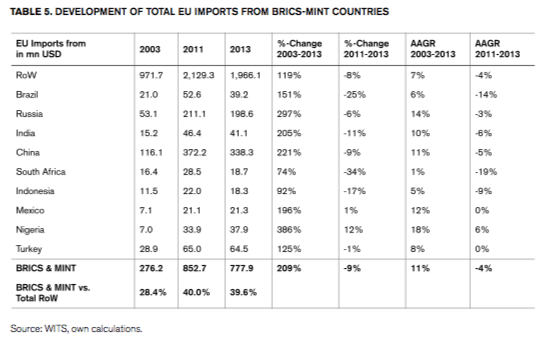
EU trade with BRICS-MINT countries increased considerably between 2003 and 2011, but trade volumes stagnated in the period 2011 and 2013. While total EU exports to BRICS-MINT countries continued to grow from 2011 to 2013, total EU imports from BRICS-MINT countries decreased after 2011. EU exports to India and South Africa decreased after 2011. Similarly, the EU shows a negative growth in imports from Brazil, Russia, India, China, South Africa and Indonesia after 2011.
In the overall period 2003 to 2013, total EU trade with BRICS-MINT countries increased from 455bn USD to 1,379bn USD. EU exports to BRICS-MINT countries increased by 227% to 600bn USD (see Table 4). EU imports from BRICS-MINT countries increased by 209% to 778bn USD, leaving the EU with a total trade in goods deficit of 178bn USD vis-à-vis BRICS-MINT countries (see Table 5).
While BRICS-MINT countries account for 30% of the EU’s total exports in goods, 40% of the EU’s total imports in goods originate from BRICS-MINT countries. China is by far the EU’s most important trading partner among BRICS-MINT countries, accounting for 38% of total trade in goods, followed by Russia (25%) and Turkey (11%).
 4.2 Development of EU-BRICS-MINT Trade
EU trade with BRICS-MINT countries is particularly strong in patent-intensive industries (see Figure 23). Based on our classification of patent-intensive and less patent-intensive sectors (see Box 2), total EU-BRICS-MINT trade in patent-intensive goods is about seven times higher than trade in less patent-intensive goods. While the EU shows a trade deficit in less patent-intensive industries of 28bn USD in 2013, it shows a trade surplus in patent-intensive goods amounting to 62bn USD.
Between 2003 and 2013, EU exports in patent-intensive goods to BRICS-MINT countries increased by 253% to 253bn USD. The EU’s imports in patent-intensive industries increased by 187% to 191bn USD. In general terms, these aggregate figures confirm that EU trade with emerging economies has followed expectations of a composition of trade reflecting a gradual climb in the value-added chain. The EU has exported more of patent-intensive goods and imported more of less patent-intensive goods.
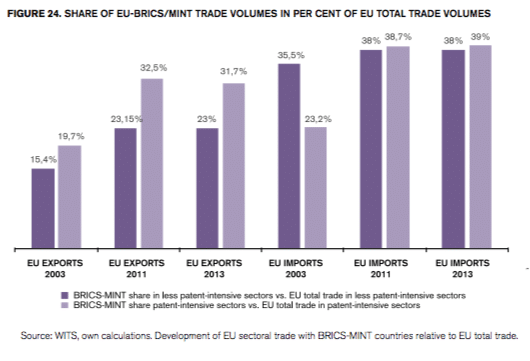
Trade in patent-intensive sectors has gained importance in the EU’s commercial relationships with BRICS-MINT countries, both in relative and absolute terms. EU exports in less patent-intensive sectors to BRICS-MINT countries accounted for 15% of the EU’s total exports in less patent-intensive sectors in 2003 and 23% in 2013 (see Figure 24). The share of EU exports in patent-intensive to BRICS-MINT countries in total EU exports in patent-intensive sectors increased from 20% in 2003 to 32% in 2013. Similarly, overall EU imports in less patent-intensive sectors from BRICS-MINT countries accounted for 36% of the EU’s total imports in less patent-intensive sectors in 2003 and slightly increased to 38% in 2013. The share of EU imports in patent-intensive sectors from BRICS-MINT countries in total EU imports in patent-intensive sectors increased from 23% in 2003 to almost 40% in 2013.
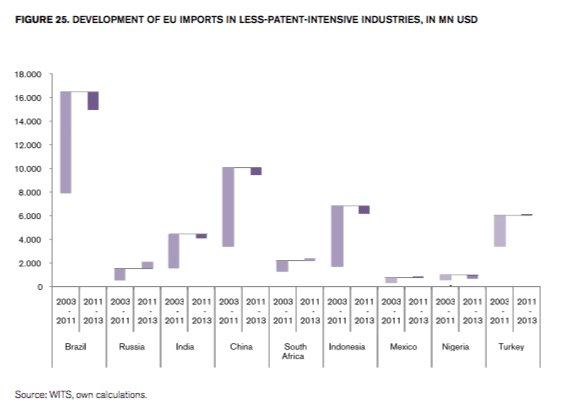
 Imports from Brazil, India, China, Indonesia and Turkey show considerable growth in absolute trade volumes for the period 2003 to 2011. Between 2011 and 2013, however, the EU’s aggregate imports in less patent-intensive sectors from Brazil, India, China, Indonesia and Nigeria decreased (see Figure 25).
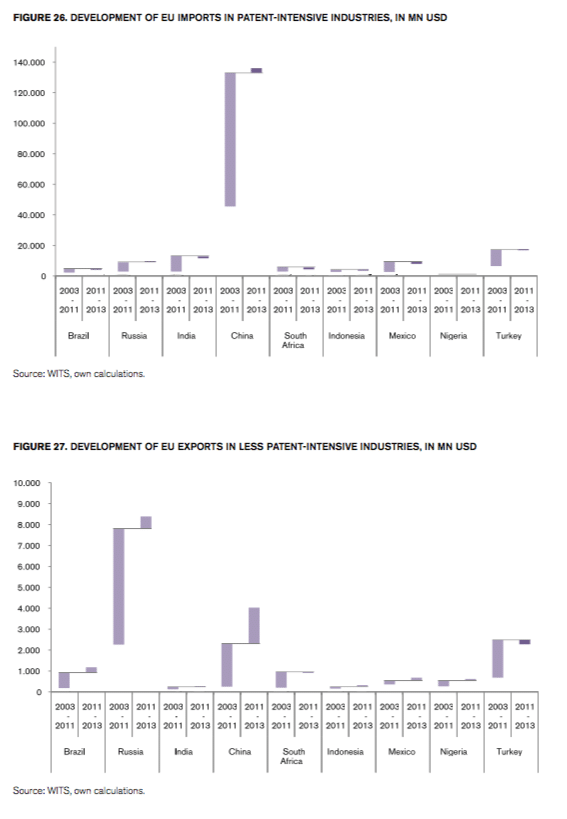
 For EU imports in patent-intensive industries, the picture is different (see Figure 26). China is by far the strongest outperformer in terms of absolute exports in patent-intensive goods to the EU. Between 2003 and 2013, China’s patent-intensive goods exports to the EU increased by 200%, reflecting its catch-up in competitiveness in patent-intensive industries. China alone accounts for EU imports in patent-intensive goods of 136bn USD in 2013, which equals 71% of total BRICS-MINT exports in patent-intensive goods to the EU. Office machinery, television and communication apparatuses, basic chemicals and machinery products are among the top categories in China’s patent-intensive exports to the EU. Turkey and India rank second and third among BRICS-MINT countries in exports in patent-intensive sectors to the EU, accounting for export values of 16bn and 12bn USD respectively. Between 2011 and 2013, total EU imports in patent-intensive industries from BRICS-MINT countries stagnated, except for China. China’s patent-intensive exports to the EU further increased by about 3bn USD.
EU exports in less patent-intensive sectors to BRICS-MINT countries are low compared to EU exports in patent-intensive industries. Less patent-intensive exports to BRICS-MINT countries account for only 7% of the EU’s exports in patent-intensive sectors to BRICS-MINT countries. Russia, China and Turkey are the top destinations among BRICS-MINT countries for less patent-intensive goods exports from the EU, amounting to 8bn, 4bn and 2bn USD, respectively (see Figure 27). With the exception of Turkey, the volume of less patent-intensive EU exports to BRICS-MINT countries continued to rise in the period 2011 to 2013.
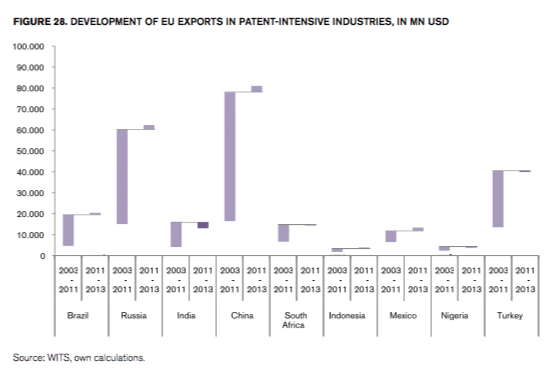
EU exports of patent-intensive goods to BRICS-MINT countries amount to 32% of total EU patent-intensive exports. The value of EU patent-intensive sectors’ exports to BRICS-MINT countries is 14 times higher than the value of EU exports in less patent-intensive sectors. Brazil, Russia, China and Turkey are the top destinations for the EU’s patent-intensive goods exports to the group of BRICS-MINT countries (see Figure 28). Exports in patent-intensive sectors amount to 21bn USD for Brazil, 62bn USD for Russia, 81bn USD for China and 40bn USD for Turkey. With the exception of India, South Africa and Nigeria, EU exports in patent-intensive industries to BRICS-MINT countries continued to rise after 2011.
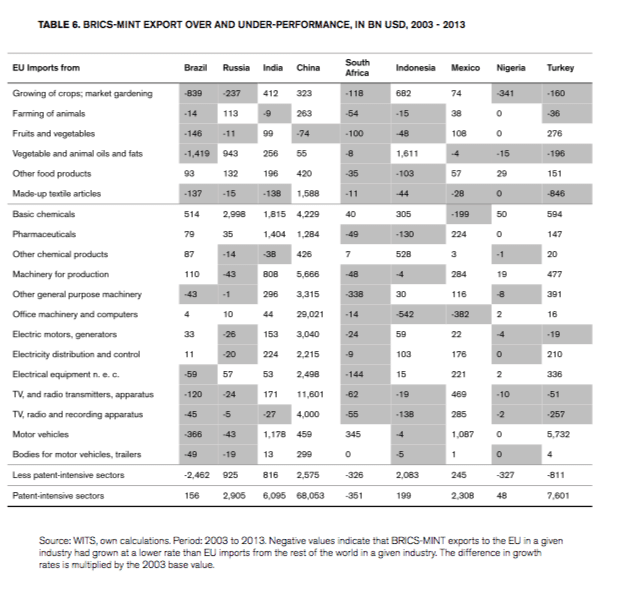
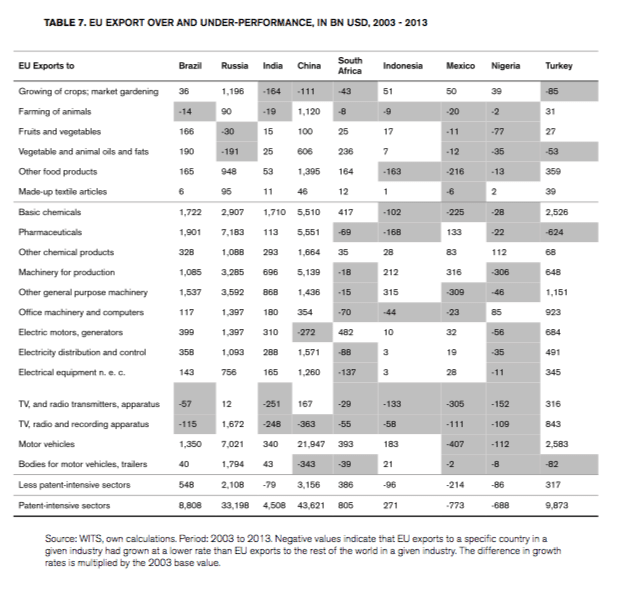
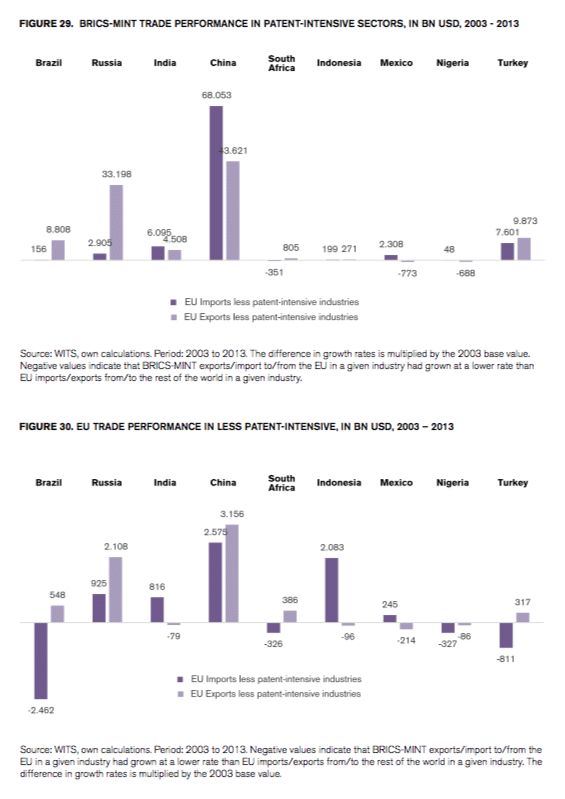
 Figures 29 and 30 show the EU’s relative performance in trade in patent-intensive and less patent-intensive sectors. Negative/positive values indicate that EU exports/import to/from BRICS-MINT countries in a given industry had grown at a lower/higher rate than total EU exports/imports in a given industry. Accordingly, negative values indicate under-performance whereas positive values indicate over-performance in imports to or exports from the EU. The difference in growth rates has been multiplied by the 2003 import/export base value.
Between 2003 and 2013, total EU exports in patent-intensive sectors increased by 120%. At the same time, total EU imports in patent-intensive sectors grew by 71%. By comparison, patent-intensive EU exports to China increased by 390% while less patent-intensive EU exports to China increased by 1,184%. As a consequence, China shows a substantial over-performance in both patent-intensive exports to and patent-intensive imports from the EU. The over-performance in China’s patent-intensive exports to and patent-intensive imports from the EU amounts to 68bn USD and 43bn USD, respectively. Similarly, China’s over-performance in less patent-intensive exports to and imports from the EU amounts to 2.6bn USD and 3.2bn USD, respectively. These numbers reflect China’s outstanding position in the EU’s trade relations within the group of BRICS-MINT economies and the strong momentum that EU-China trade has experienced in the 10-year period under study.
EU trade with Russia and India shows similar characteristics. For both patent-intensive and less patent-intensive sectors, EU trade with these countries grew faster then EU total trade in these sectors. Similarly, EU-Brazil and EU-Turkey trade in patent-intensive sectors grew at a faster rate than total EU trade in patent-intensive sectors. For less patent-intensive sectors, on the other hand, Brazil’s and Turkey’s exports to the EU grew at a lower rate than total EU imports in less patent-intensive exports.
 The following tables provide a more detailed sectoral break down for both patent-intensive and less patent-intensive sectors. For the period 2003 to 2013, Tables 6 and 7 show sectors for which trade has under- and over-performed in terms of EU exports/imports to/from the BRICS-MINT countries relative to total EU exports/imports. The data show that there are only a few general patterns in EU trade with BRICS-MINT countries – and we will come back to an interpretation of these patterns after we have performed the shift-share analysis.
4.3 Shift-Share analysis: Identification of leading and lagging sectors
The results of the shift-share analysis are set out below. National shares, industry mix shares and regional shares were calculated on industry level and have been aggregated to obtain the groups comprising less patent-intensive sectors and patent-intensive sectors.
The national share (NS) and industry mix (IM) components reflect the proportion of EU export/import growth that is attributable to either the EU’s total export/import growth or the EU’s export/import commodity composition.
NS measures how much the EU’s imports/exports from/to a specific country increased because of total growth in EU imports/exports during the period of analysis. For example, all else being equal, if total EU exports grew by 10% during the period of analysis, then total EU exports to a specific country would have grown at the same rate.
IS identifies fast growing and slow growing import and export sectors based on the EU’s growth rates in total exports and total imports in that sectors. For EU imports, a country with an above-average export share in the EU’s high-import-growth industries would show higher total export growth rates than a country with an above average export share in the EU’s low-import-growth industries. For EU exports, a country with an above-average import share in the EU’s high-export-growth industries would show higher total import growth rates than a country with a high import share in the EU’s low-export-growth industries.
The regional share (RS) component shows the proportion of growth that cannot be attributed to either NS or IM. The RS component is frequently read as competitive effect component in a country’s trade profile. Accordingly, the numbers can be read as follows:
For EU imports from BRICS-MINT countries, the RS component highlights the EU’s leading and lagging import industries in trade with a specific country. The RS component compares a country’s export growth rate in a given industry with the total import growth rate for that same sector at the EU level. Following this reasoning, a leading industry is one where the EU’s import growth in trade with a specific country is greater than EU total import growth in that same industry. A lagging industry is one where the EU’s import growth in trade with a specific country is less than EU total import growth in that same industry.
For EU exports to BRICS-MINT countries, the RS component highlights the EU’s leading and lagging export industries. The RS component compares a country’s import growth rate in a given industry with the EU’s total export growth rate for that same sector. Accordingly, a leading industry is one where the EU’s export growth in trade with a specific country is greater than EU total export growth in that same industry. A lagging industry is one where the EU’s export growth in trade with a specific country is less than EU total export growth in that same industry.
Note that the shift-share analysis does not account for the impact of business cycles, the factors underlying comparative advantages, and differences caused by levels of industrial specialisation. The analysis offers a view of a country’s trade performance at two points in time. Therefore, the results are sensitive to the time period chosen. On the other hand, the shift share methodology provides a straightforward approach to identify country-specific industrial contributions from trade volume growth. It is also useful for the identification of industries that might offer future trade growth opportunities.
4.3.1 Regional Industrial Contribution to EU Trade Performance
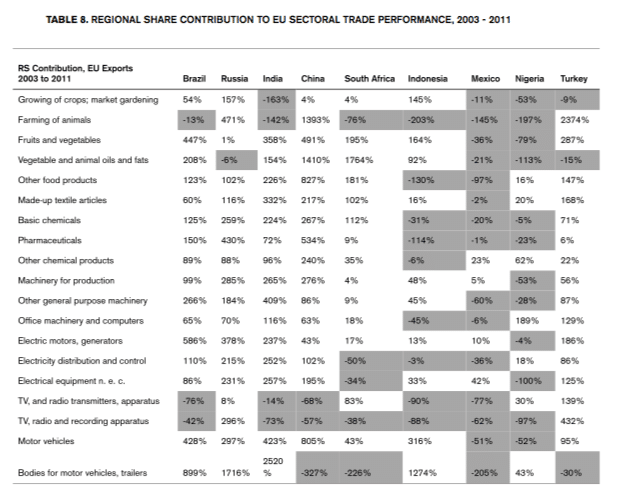
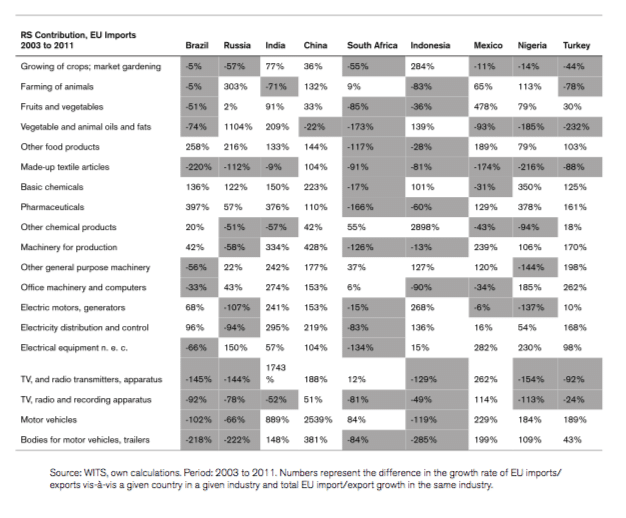
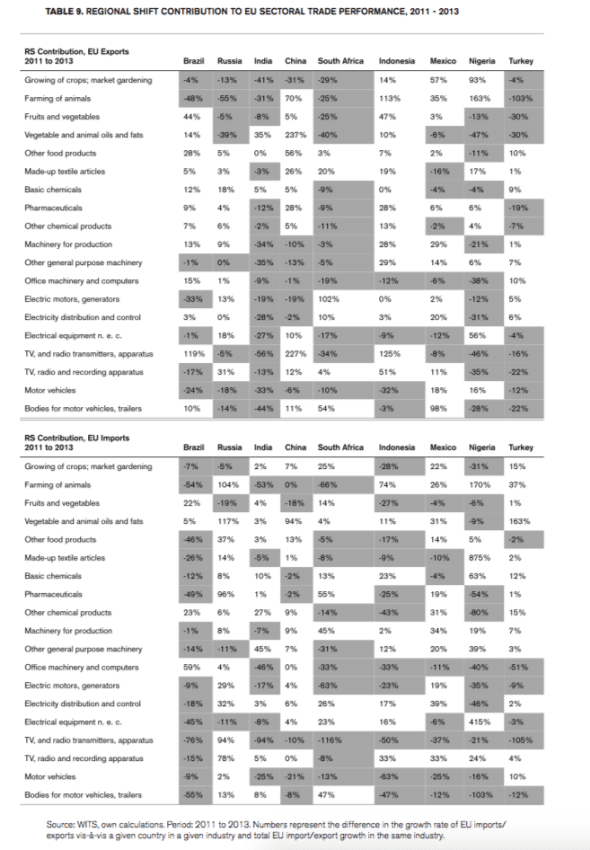
Tables 8 and 9 illustrate those sectors, in which trade with BRICS-MINT countries in a certain industry under- or over-performed relative to EU total trade in that same industry.
For the period 2003 to 2011, the majority of EU sectoral exports to BRICS countries and Turkey outperformed EU total exports in those sectors. Most EU sectoral exports to Indonesia, Mexico and Nigeria, on the other hand, grew at slower rate than EU total sectoral exports. For EU sectoral imports over the period 2003 to 2011, the trade patterns vis-à-vis BRICS-MINT countries are much more diverse. One exception is China, whose sectoral exports to the EU generally grew at a faster rate than EU total imports in those sectors.
 There are only a few general patterns for the period 2011 to 2013 (see Table 9). EU sectoral export performance has somewhat deteriorated relative to what the EU experienced between 2003 and 2011. EU sectoral exports to BRICS countries and Turkey grew at a lower rate than EU total exports in many sectors. India is somewhat outstanding among the group of BRICS countries. With the exception of ‘basic chemicals’, all EU patent-intensive exports to India grew at a lower rate than the EU’s total exports in these sectors. On the other hand, the majority of the EU’s less patent-intensive and patent-intensive sector exports to Indonesia grew at a higher rate than EU total sectoral exports.
The patterns in EU sectoral imports from BRICS-MINT countries more diverse for the period 2011 to 2013 compared to the period 2003 to 2011. The numbers indicate that Brazil and China have lost in competitiveness for exports to the EU. On the other hand, Russia has gained in competitiveness in its exports to the EU.
 4.3.3 Trends EU Trade in Less Patent-intensive and Patent-intensive Industries
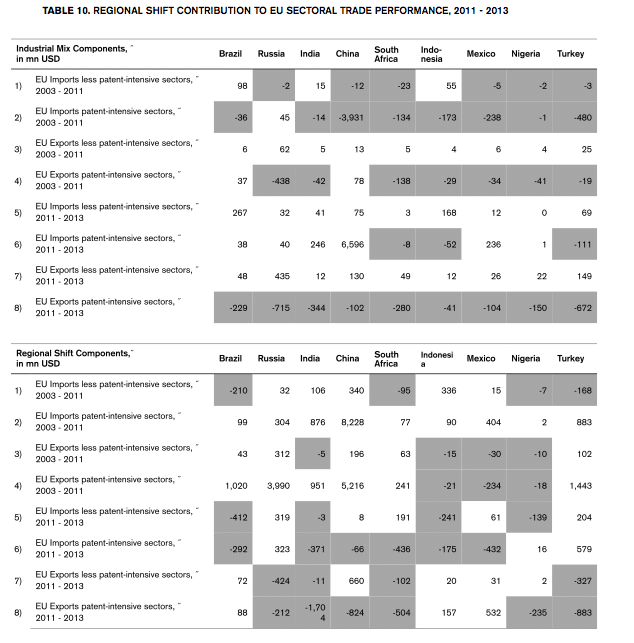
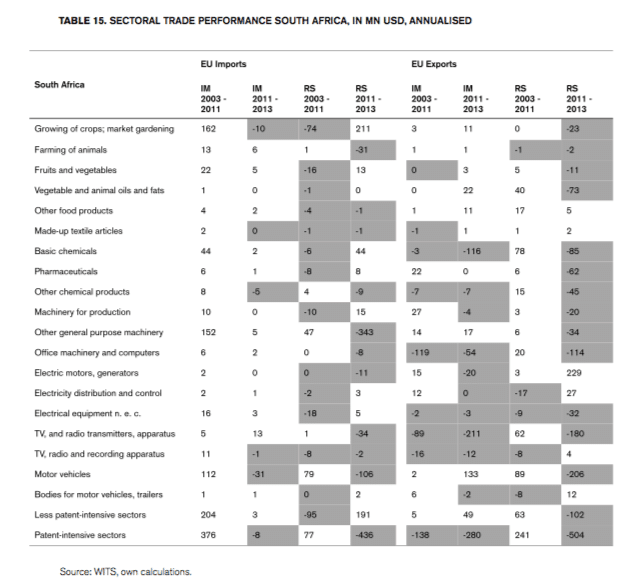
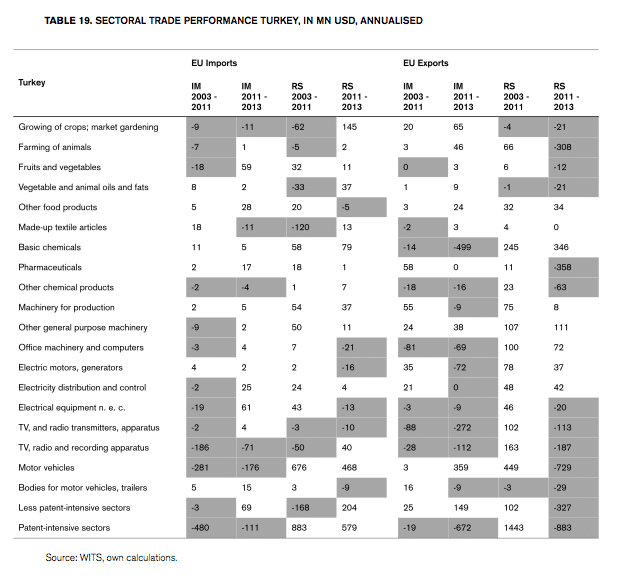
For aggregates of less patent-intensive sectors and patent-intensive sectors, Table 10 provides and overview of both the industrial mix and the regional shift contributions to EU-BRICS-MINT trade performance for the periods 2003 to 2011 and 2011 to 2013.
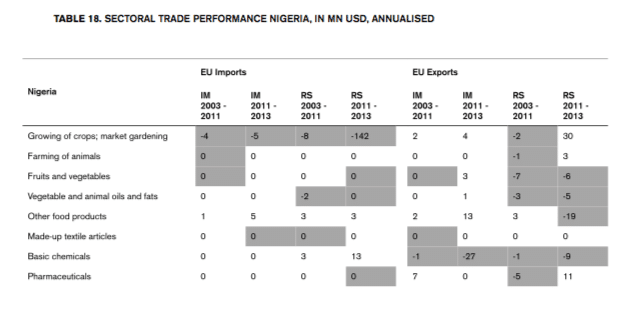
Country-specific trends are given in Tables 11 to 19 below. They show great variety between countries, and conclusions about trade performance are country-specific rather than general.
Brazil generally shows a good amount of trade under-performance. The EU has seen deteriorations in its export performance with Brazil in its key patent-intensive sectors – chemicals and pharmaceuticals, and motor vehicles. Notably, EU exports perform generally better in less-patent intensive sectors than in patent-intensive sectors.
 Russia shows a similar pattern in that the EU’s export performance over time has deteriorated in major patent-intensive sectors, both from the viewpoint of the industrial mix and competitiveness. There is significant EU export under-performance in patent-intensive sectors.
 India is not much different in terms of general trade patterns. The EU’s export performance has been deteriorating, and more so in patent-intensive sectors than in less patent-intensive sectors. It is notable that export over-performance in sectors like pharmaceuticals, machinery, and electrical goods, and vehicles have become export under-performance, and that they show strong changes in the competitiveness factor (RS), which also points deteriorating conditions for market access.
China, which is the dominant country in the BRICS-MINT group as far as trade volumes are concerned, shows a similar direction of EU’s export performance, also with regard to the two different sector groupings.

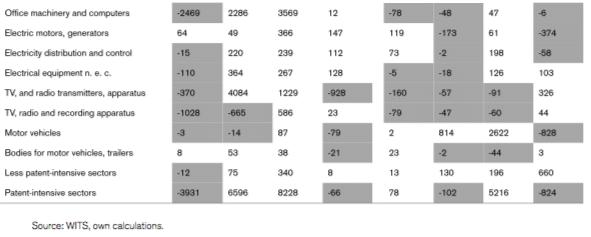 For South Africa, EU exports also exhibit a sharp under-performance, which is most striking for the EU’s major patent-intensive sectors.
Indonesia is a country where the EU’s export performance has improved when measured in terms of competitiveness (RS) – and that trend also includes some of the EU’s major patent-intensive sectors.
Mexico shows a similar pattern in aggregate numbers, with positive trends for pharmaceuticals, machinery and motor vehicles.
Nigeria shows a deteriorating trend for EU export performance, which is stronger in patent-intensive sectors. However, in some of the the EU’s major patent-intensive sectors the trend is positive.
 Turkey follows the trend of BRICS countries rather than other MINT countries in that the deterioration in the EU’s export performance has been comparatively sharp, especially in major patent-intensive sectors like pharmaceuticals and motor vehicles.
6. Concluding Comments
Trade with emerging markets is increasingly important for the European Union. As many of these economies continue to grow faster than Europe and the rest of the world, their role for the EU’s general trade performance will only increase. A growing part of economic growth and welfare in Europe is dependent on trade with these economies.
The general trend is positive for the EU. Its trade with these economies has been growing. In the aggregate, there has also been a trend where the EU has seen stronger growth in patent-intensive sector exports. On the import side, the growth of imports in less patent-intensive sectors has been more significant. Generally, these results suggest that Europe’s aggregate trade performance with key emerging economies has confirmed the expectation about the composition trade between an advanced economy and an emerging economy. Consequently, the EU has by a high degree of certainty been able to climb the value-added chain through trade with emerging economies.
However, the pattern of trade is not always as expected, or predicted by theories of comparative advantage, and it shows that there are countries and sectors where there are distortions in Europe’s trade performance. Expectedly, the differences between sectors and countries seem to be dependent on country. Worryingly, these distortions have generally become more pronounced in recent years and, in several sectors, turned EU export over-performance into under-performance. Importantly, the deterioration is stronger in EU exports to BRICS countries compared to others. As these countries have larger economies and still a high volumes of trade with the EU, the economic impact of a deterioration in market access on European industries tends to be significant
Trade in the EU’s major patent-intensive sectors – chemicals, pharmaceuticals, and motor vehicles – has generally evolved in a positive fashion in the period studied. However, recent years have witnessed a deterioration of EU exports in theses sectors – in terms of trade below potential. In many instances, these deteriorations are not the result of the EU’s industrial mix. The under-performance in EU exports can be ascribed to local factors that artificially depress EU corporate competitiveness in those markets. In countries like Brazil, India and South Africa, these factors tend to be very strong and show a clear upward potential for the EU in improving the gains it can reap from trade in patent-intensive sectors.
Given the varied picture between countries, and between sectors, it is important for the EU to tailor a trade policy that targets specific problems related to trade in those sectors where the EU’s industrial structure shows comparative advantages. In other words, EU trade policy should focus on those sectors that show a strong potential export and import performance, but where other factors than economic competitiveness have caused trade under-performance in the past.
Bibliography
EPO (2013), Intellectual property rights intensive industries: contribution to economic performance and employment in the European Union, Industry-Level Analysis Report, September 2013, European Patent Office.
Erixon, F. (2015a), Whither Asia-Europe Trade Relations and Political Cooperation, in: Europe in Emerging Asia – Opportunities and Obstacles in Political and Economic Encounters, ed. by Fredrik Erixon and Krishnan Srinivasan, Rowman and Littlefield, London.
Erixon, F. (2015b), Intellectual Property Rights: Getting Priorities Right. ECIPE Occasional Papers No. 4/2015.
Hansakul, S., and Levinger. H. (2014), China-EU Relations: Gearing up for Growth, Current Issues-Emerging Markets, 2014, 1-16.
Leadbeater, C. (1999), New Measures for the New Economy Report presented at International Symposium on Measuring and Reporting Intellectual Capital: Experience, Issues and Prospects, Amsterdam, 9-11 June 1999.
OECD (2009), Trade in Intermediate Goods and Services. OECD Trade Policy Working Paper, No. 93, OECD Publishing.
Park, W. G. and Lippoldt, D. C. (2008), Technology Transfer and the Economic Implications of the Strengthening of Intellectual Property Rights in Developing Countries, OECD Trade Policy Working Papers, No. 62, OECD Publishing.
WTO (2014), World Trade Report 2014: Trade and development: recent trends and the role of the WTO.
