A Strategy for a Competitive Europe: Boosting R&D, Unleashing Investment, and Reducing Regulatory Burdens
Published By: Andrea Dugo Fredrik Erixon
Subjects: Digital Economy European Union Sectors WTO and Globalisation
Summary
The EU stands at a crucial economic juncture. Economic growth in Europe’s mature economies has stagnated, with productivity and other indicators of economic vitality showing poor results. Public debt is alarmingly high in several countries, and the region faces new fiscal demands due to an ageing population, conflicts and war, and the energy transition. To reverse its economic decline, Europe must adopt a new strategy for improved competitiveness.
The starting point of this strategy should be an honest assessment of Europe’s declining productivity compared to leading economies like the US. Historically, some European countries matched or even surpassed US productivity levels, but this gap has widened over the past three decades. While the US economy has also faced challenges, its technology, R&D, and innovation sectors have significantly boosted productivity growth.
This paper identifies three key areas for policy improvement to rejuvenate Europe’s economic dynamism:
- Radical expansion of R&D Expenditure: Governments must significantly increase funding for universities and create better conditions for private R&D investments. The EU currently fails to meet its own target of R&D expenditures at 3 per cent of GDP. Achieving parity with US R&D expenditure levels would require an additional €200 billion annually.
- Mobilisation of European Savings for Investment: Despite a higher savings rate than the US, Europe’s underdeveloped capital markets hinder economic growth and investment in new enterprises. The EU needs policies to channel savings into a vibrant corporate market. Expanding the European bond market, which is currently half the size of the US one, is essential for European firms to secure funding and keep the pace of American innovation.
- Regulatory Reform: The EU’s restrictive regulatory environment increases business costs and stifles innovation. A shift in regulatory attitudes, for instance in the banking sector, could unlock €4.5 trillion annually, providing much-needed capital for European firms, especially small and medium-sized enterprises, to finance innovation during the green and digital transition.
By addressing these areas, Europe can create a more favourable environment for business growth, innovation, and long-term economic stability.
1. Introduction
Competitiveness has rightly become the new buzzword in Brussels. In her 2023 State of the Union address, President of the European Commission Ursula von der Leyen used the word “competitiveness”, or variations of it, 12 times over – which is as many references to competitiveness as in her three previous State of the Union speeches put together[1]. In the same vein, European heads of state and government have called for a “new competitiveness deal” in a recent European Council meeting in April this year[2], while other EU top authorities have pointed to Europe’s competitiveness challenge as “more urgent than ever”[3].
There are good reasons why this agenda is gaining momentum. Europe is confronted with one incontrovertible fact: it is losing its competitive edge with respect to comparable economies in the world, first and foremost with the US. Multiple indicators make it crystal clear that Europe has been gradually falling behind the US and other economies over a longer period of time – and that the resulting differences in prosperity of economic power are about to grow bigger and bigger in the future. Some observers even refer to the European economy as a “museum economy”.[4] Acknowledging what many economists had pointed to for several years, von der Leyen announced in September 2023 that she would task Draghi, former Italian Prime Minister and former President of the European Central Bank, with drafting a report on how to revive the bloc’s competitiveness[5].
The report is eagerly anticipated and is very likely to shape the mandate of the new European Commission. However, even prior to its publication, Draghi’s recent remarks as well as comments from various European actors surrounding them already allow to have an inkling of what the report will look like. In a speech at the High-level Conference on the European Pillar of Social Rights in April 2024, Draghi mentioned broadly accepted policy proposals such as lowering the regulatory burden on companies or removing barriers to business financing, yet he made it equally clear that the core of his work will centre around the revival of industrial policy. In a world where the US and China, in Draghi’s own words, “are no longer playing by the rules and are actively devising policies to enhance their competitive position,” the EU must put forth a strategic and coordinated policy action to “shield our traditional industries from an unlevel global playing field”[6].
Draghi’s words echo those of another former Italian Prime Minister, Enrico Letta, whose report on the future of the Single Market released in April this year pointed to scaling up the size of powerful European companies in order to drive competitiveness and preserve strategic autonomy in an increasingly US and China-dominated global market[7]. In a similar spirit, a joint statement from late May on how to boost growth and competitiveness in the EU by the French and German governments called, among other proposals, for the rethinking of the EU’s state aid framework to prop up big companies in strategic and innovative sectors[8]. The path to competitiveness in the mind of the EU’s high ranks seems inevitably to pass through more industrial policy.
This approach has received widespread criticism. In an open letter addressed to von der Leyen and Draghi, thirteen European civil society organisations with very different ideological backgrounds came together to express common concerns over the upcoming competitiveness report. The organisations argue that Draghi’s proposals, particularly promoting market consolidation in a series of strategic sectors like defence, energy, and telecoms, would harm consumers, workers, and small businesses by increasing market concentration and benefiting existing large corporations over the public interest[9].
This criticism should not be taken lightly. Relaxing competition policy rules to propel big, operating EU firms, the so-called “European champions”, risks reinforcing the status quo rather than turning it upside down – which is really what is needed in European business sectors. All available evidence shows that it has mostly been young and fast-growing companies that have boosted productivity performance and job creation in America in the last couple of decades, not the evergreen US corporate giants some want to emulate in Europe[10].
If not through an expansion of subsidies to industrial firms, what can European policymakers do to provide better conditions for firm growth and improve European competitiveness? Indeed, what can be done at the level of the European Union – either by direct policies or more structural coordination of policies predominantly performed at the levels of national governments? This is precisely what we set out to answer in this Policy Brief. After analysing the evolution of EU competitiveness over time and in comparison with other frontier economies, we discuss three main policy areas the EU and member states should work on to boost the bloc’s competitiveness: harnessing technological innovation, addressing Europe’s risk aversion, and reforming excessive regulation within the EU.
First, we show how pivotal technological innovation is as a driver of growth and competitiveness. Embracing cutting-edge technologies and fostering a robust ecosystem for innovation is essential for the EU to return to the frontier of the global economy. A crucial policy objective is to boost spending on R&D and to reduce barriers for technologies to be adopted across countries, sectors, and firm classes.
Second, we examine Europe’s inherent risk aversion, which often hampers entrepreneurial initiatives and investments. Shifting policies to allow for more entrepreneurial and capital market risks are vital for fostering a dynamic and resilient economic environment. Improving regulation to allow for a greater part of European savings to be invested in firm growth is key.
Lastly, we address the issue of excessive regulation within the EU. Streamlining regulatory frameworks and reducing bureaucratic hurdles can unleash the full potential of European businesses, allowing them to compete more effectively on the global stage. Europe has been regulating new technologies deeper, harder, and faster than other comparable economies. Such an approach simply does not work when there is a technology acceleration in the economy.
[1] European Commission. (2024). State of the Union addresses. https://state-of-the-union.ec.europa.eu/index_en
[2] European Council. (2024). European Council conclusions, 17 and 18 April 2024. https://www.consilium.europa.eu/media/m5jlwe0p/euco-conclusions-20240417-18-en.pdf
[3] Strauch, R. (2024). Enhancing competitiveness in Europe: Old and new challenges. European Stability Mechanism. https://www.esm.europa.eu/articles-and-op-eds/enhancing-competitiveness-europe-old-and-new-challenges
[4] Fairless, T. (2024). Europe has a New Economic Engine: American Tourists. Wall Street Journal, 21 June, 2024.
[5] Reuters. (2023). EU head asks Draghi to advise bloc on boosting competitiveness. https://www.reuters.com/world/europe/eu-head-asks-draghi-advise-bloc-boosting-competitiveness-2023-09-13/
[6] Draghi, M. (2024). Mario Draghi: Radical Change—Is What Is Needed. Speech at the High-level Conference on the European Pillar of Social Rights in Brussels on April 16, 2024. Groupe d’études géopolitiques. https://geopolitique.eu/en/2024/04/16/radical-change-is-what-is-needed/
[7] Letta, E. (2024). Much more than a market. April 2024. https://www.consilium.europa.eu/media/ny3j24sm/much-more-than-a-market-report-by-enrico-letta.pdf
[8] Élysée. (2024). A new agenda to boost competitiveness and growth in the European Union. 29 May. https://www.elysee.fr/en/emmanuel-macron/2024/05/29/a-new-agenda-to-boost-competitiveness-and-growth-in-the-european-union
[9] Corporate Europe Observatory. (2024). Open letter to Mario Draghi and Ursula von der Leyen on Mario Draghi’s competitiveness report. 8 May 2024. https://corporateeurope.org/en/2024/05/open-letter-mario-draghi-and-ursula-von-der-leyen-mario-draghis-competitiveness-report
[10] World Economic Forum. (2023). What are ‘gazelle’ companies and why are they essential for growth?. https://www.weforum.org/agenda/2023/09/gazelles-an-endangered-yet-essential-species-of-company/
2. Europe’s Competitiveness: Then and Now
The issue of competitiveness has finally taken centre stage in the European political debate. Competitiveness is and should be about productivity – which is not everything but, as Paul Krugman famously quipped, “in the long run, it is almost everything”.
There was a time when EU productivity was not a key problem. Postwar economic growth propelled devastated European countries through decades of rising living standards and increasing productivity. Largely untouched by the demolition of World War II, the US boasted in 1947 levels of GDP per capita that were double those of France and three times those of both Italy and Germany,[1] and a labour productivity growth rate in 1950 that was more than twice as much as that recorded in Western Europe[2]. European economies were in shambles, but they soon went through a rebirth.
However unique and unrepeatable the historical conditions in terms of recovery, trade and investment potential, the decades that followed the end of World War II witnessed some of the most robust increases in economic growth and productivity in the history of Western Europe. Figure 1 shows how GDP per capita in the six countries that would later come together to form the first core of the “European project” stood on average at mere 57% of the US in the early 1950s but rapidly caught up to reach almost 80% in 1980, all throughout a period when the US economy as well was all but stagnant.
Figure 1: Inner Six and US GDP per capita in selected years (2011 international dollars, PPP and inflation-adjusted)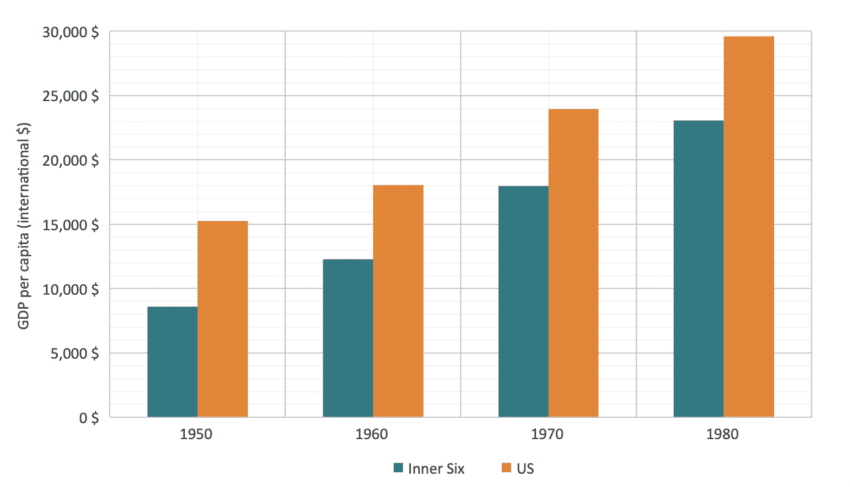 Source: Authors’ calculation based on The Maddison Project[3]. Note: The Inner Six countries include Belgium, France, Germany, Italy, Luxembourg and the Netherlands.
Behind the staggering economic growth that pushed European countries towards ever growing prosperity were developments such as increased trade openness and massive public and private investments which precipitated Europe’s productivity forward[4].
Figure 2 attests to Europe’s productivity miracle: by 1970, the first year since which OECD data on output per hour worked is available, European countries had already bridged a significant chunk of the productivity gap with the US. From the second half of the 1970s, the average GDP per hour worked of the six founding members of the EU finally outpaced that of the US and the distance kept growing up until the early 1990s. In 1990, output per hour worked in the poorest of the Inner Six, Italy, stood at 45$, almost exactly on par with the US (45,5$).
Figure 2: Inner Six and US GDP per hour worked, 1970–1990 (2015 US dollars, constant prices, PPP)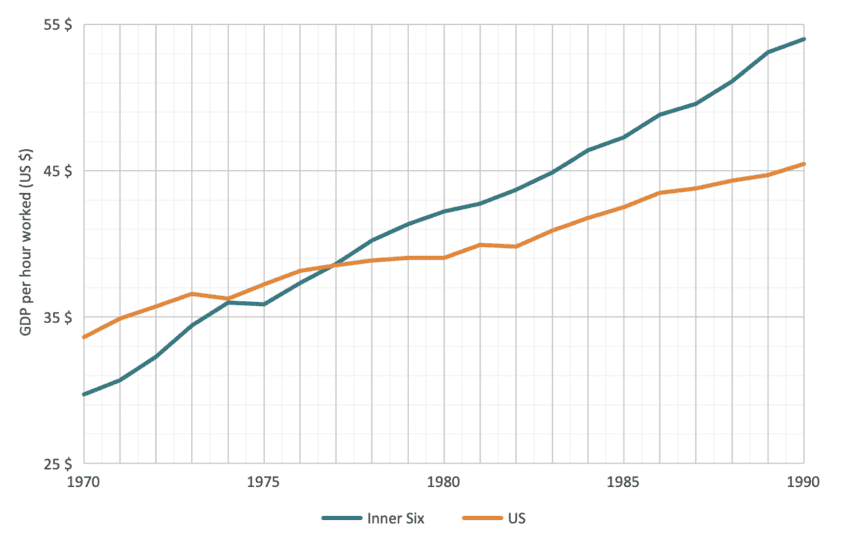 Source: Authors’ calculation based on OECD[5]. Note: The Inner Six countries include Belgium, France, Germany, Italy, Luxembourg and the Netherlands.
What had made Europe ever so competitive during the postwar decades was continuous, year-on-year growth in productivity. Figure 3 is most eloquent in showing how, throughout the 1970s and the 1980s, the average annual growth of output per hour worked in the main European countries far surpassed that of the US. However, European productivity growth levels started declining markedly during the 1990s, right at a time when, after two decades of relative stagnation, US productivity growth had picked up. And ever since the turn of the millennium, the comparison between the two regions has been unforgiving to the EU. While productivity in the US kept growing at a fluctuating but solid pace over the last couple of decades, it declined dramatically in the original six EU countries. Output per hour worked growth levels in Europe consistently ranged between 0.5 to 1% yearly over the first twenty years of the new century, with the 2011-2020 period in particular marking a virtually lost decade of productivity growth.
Figure 3: Average annual growth of Inner Six and US GDP per hour worked by decade, 1971–2020 (percentage, constant prices)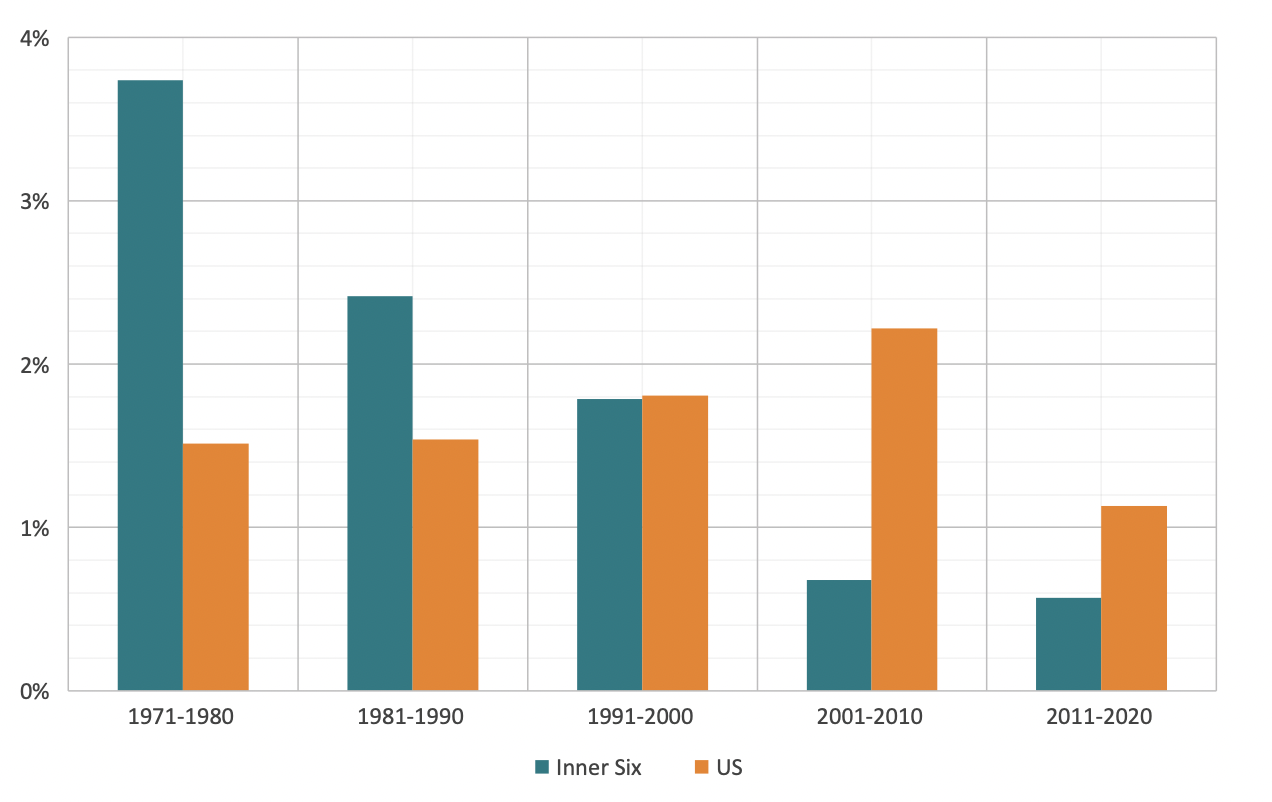 Source: Authors’ calculation based on OECD[6]. Note: The Inner Six countries include Belgium, France, Germany, Italy, Luxembourg and the Netherlands.
Expanding the scope of the comparison to other developed economies, Figure 4 employs another, more targeted indicator of productivity, namely Total Factor Productivity (TFP). TFP measures the portion of increased output not explained by either labour or capital, thus shedding light on the capacity of an economy for innovation and technology adoption. While certainly not up to the US’ standard, European countries still fare relatively well in terms of technology-driven productivity when examined side by side with most economic powers worldwide and have consistently done so over the last decades. The decline in productivity that has characterised the first two decades of the new millennium, albeit more marked than elsewhere, is not peculiarly European in scope and points to a more generalised loss in competitiveness of most, if not all, advanced economies globally vis-à-vis the US.
Figure 4: Total Factor Productivity (TFP) for selected countries and areas, 1960–2019 (current PPPs, US = 1, 5-year moving average)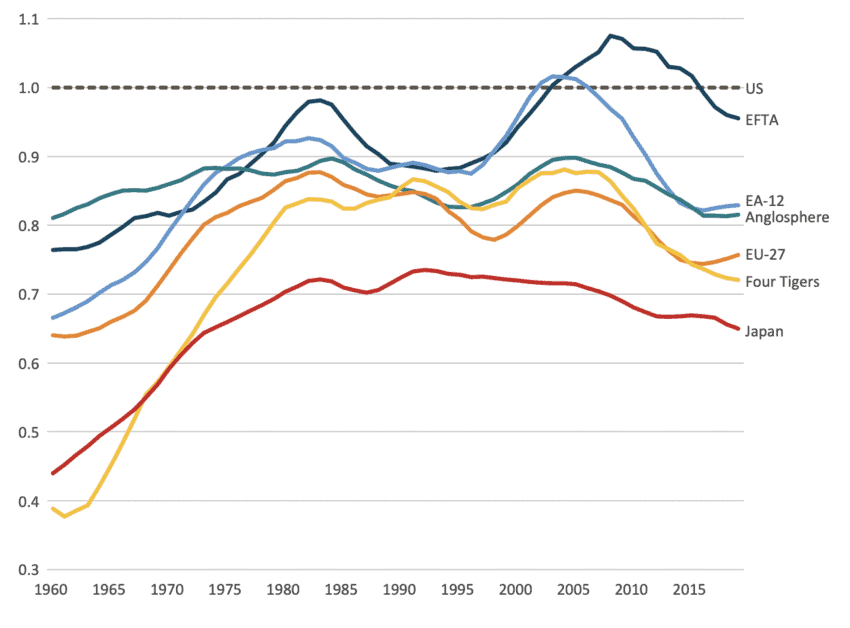 Source: Authors’ calculation based on Penn World Table[7]. Note: EFTA countries are Iceland, Norway and Switzerland (data for Liechtenstein is not available). EA-12 countries include Austria, Belgium, Finland, France, Germany, Greece, Ireland, Italy, Luxembourg, Netherlands, Portugal, and Spain. The Anglosphere includes Australia, Canada, New Zealand and the UK (excluding the US). The Four Tigers include Hong Kong, Singapore, South Korea and Taiwan.
When comparing across countries and regions, it is once again visible that the EU’s real challenge to continue to stay relevant is first and foremost to catch up with the US and to harness the forces of economic development and innovation in a similar fashion as the US has.
Before moving on to the underlying factors and challenges concerning EU competitiveness as a whole, it is worth pointing out that significant geographical differences exist within the EU as well in terms of productivity efficiency. Remarkably different patterns characterise different regions of Europe, as exemplified in Figure 5.
While all areas of Europe, including formerly Soviet-bloc Eastern countries, did experience a noticeable surge in productivity throughout the postwar decades, it was from the 1980s that regional paths started to diverge considerably. Northern and Western countries maintained stable levels of technology-powered productivity all through the 1980s and 1990s and even witnessed a sizeable growth in the early 2000s, reaching and even outpacing the US benchmark. On the contrary, Southern countries, which had briefly surpassed the Western ones in the 1970s, experienced a slow but steady decline in productivity levels ever since the early 1980s, whereas Eastern countries, which survived the 1980s somewhat unscathed, faced a dramatic decrease in productivity throughout the 1990s, most likely in the aftermath of the dissolution of the Soviet Union.
To varying extents, Northern, Western and Southern countries have all experienced steep declines in productivity levels ever since the early 2000s, whereas productivity in Eastern countries has picked back up in the same period, most probably reaping benefits from the accession to the EU and its Single Market.
Figure 5: Total Factor Productivity (TFP) for sub-regions of the EU, 1960–2019 (current PPPs, US = 1, 5-year moving average)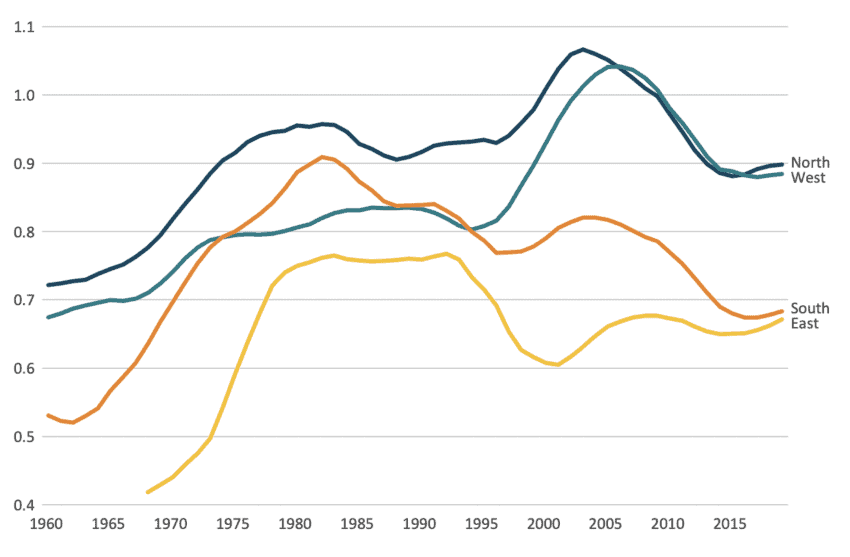 Source: Authors’ calculation based on Penn World Table. Note: Northern countries include Denmark, Finland, Ireland and Sweden. Western countries include Austria, Belgium, France, Germany, Luxembourg and the Netherlands. Southern countries include Croatia, Cyprus, Greece, Italy, Malta, Portugal, Slovenia and Spain. Eastern countries include Bulgaria, the Czech Republic, Estonia, Hungary, Latvia, Lithuania, Poland, Romania and Slovakia.
What we are nowadays faced with is a two-level Europe: on the one hand, albeit weakened, TFP in Northern and Western countries stands at remarkably similar and still somewhat competitive levels; on the other hand, Southern and Eastern countries witness shared but much lower levels of productivity.
For this latter group, a further distinction needs to be made: while Eastern Europe lags considerably behind its Northern and Western counterparts productivity-wise, there is significant room for convergence as Eastern countries are still catching up. Southern Europe, instead, has been living a long, drawn-out productivity crisis that it cannot seem to shake off, in spite of the size, importance and maturity of some of its economies like Italy or Spain.
Although the future of EU competitiveness will also depend on the stronger economies of the North and the West going the extra mile and on Eastern countries continuing in their path of economic development, every serious plan that sets out to restore EU competitiveness cannot possibly overlook Southern Europe’s productivity issue if it truly wishes to be successful.
[1] Bolt, J. and J. L. van Zanden (2024). Maddison style estimates of the evolution of the world economy: A new 2023 update. Journal of Economic Surveys, 1–41. https://www.rug.nl/ggdc/historicaldevelopment/maddison/releases/maddison-project-database-2023#:~:text=doi%3A%2010.34894/INZBF2.
[2] Berend, I. T. (2006). An Economic History of Twentieth Century Europe. Cambridge University Press, 86–87, 324.
[3] Bolt, J. and Luiten van Zanden, J. (2020). Maddison style estimates of the evolution of the world economy. A new 2020 update. Maddison Project Database. https://www.rug.nl/ggdc/historicaldevelopment/maddison/publications/wp15.pdf
[4] Bayoumi, T. (1995). The Postwar Economic Achievement. Finance & Development, 32(002), 48–50.
[5] OECD. (2024). GDP per hour worked – US Dollar. https://data-explorer.oecd.org/vis?lc=en&ac=false&tm=DF_PDB_LV&pg=0&snb=1&vw=tb&df[ds]=dsDisseminateFinalDMZ&df[id]=DSD_PDB%40DF_PDB_LV&df[ag]=OECD.SDD.TPS&pd=%2C&dq=.A.GDPHRS……&to[TIME_PERIOD]=false
[6] OECD. (2024). GDP per hour worked – Annual growth/change, Percentage. https://data-explorer.oecd.org/vis?lc=en&ac=false&tm=DF_PDB_LV&pg=0&snb=1&vw=tb&df[ds]=dsDisseminateFinalDMZ&df[id]=DSD_PDB%40DF_PDB_LV&df[ag]=OECD.SDD.TPS&pd=%2C&dq=.A.GDPHRS……&to[TIME_PERIOD]=false
[7] Feenstra R. C., Inklaar R. and Timmer M.P. (2015). The Next Generation of the Penn World Table. American Economic Review, 105(10), 3150–3182. https://www.rug.nl/ggdc/productivity/pwt/related-research
3. Key Reforms for a Competitive Europe
Harnessing Innovation and a “Big Bang” in R&D
Historically, one of the main drivers, if not the single main driver, behind sustained economic growth and productivity increases has been the capacity of an economy to move fast with technological change and embrace innovation. Perhaps the most conventional way to measure such propensity to innovate is to look into how much a country as a whole (firms, central and local government, higher education institutions, etc.) invests in R&D projects.
Figure 6 shows R&D spending as a percentage of GDP over time for a number of selected countries and the EU as a whole. The overall picture is alarming: out of all the economies included in the sample, the EU is the worst performer. Despite starting from roughly similar departure points in the early 1990s, countries like South Korea and Taiwan now boast R&D expenditure levels that are twice as high as the EU’s, when measured as share of GDP. China, which spent less than half of the EU’s R&D spending in relative terms in 1991, has stably widened the gap with Europe ever since the mid-2010s. The US, whose gap with the EU when measured as share of GDP already stood at over 50% in 1991, has not only maintained but substantially increased its lead to achieve an almost 70% difference in 2021.
Figure 6: Gross domestic expenditure on R&D (GERD) for selected countries and areas, 1991–2021 (percentage of GDP) 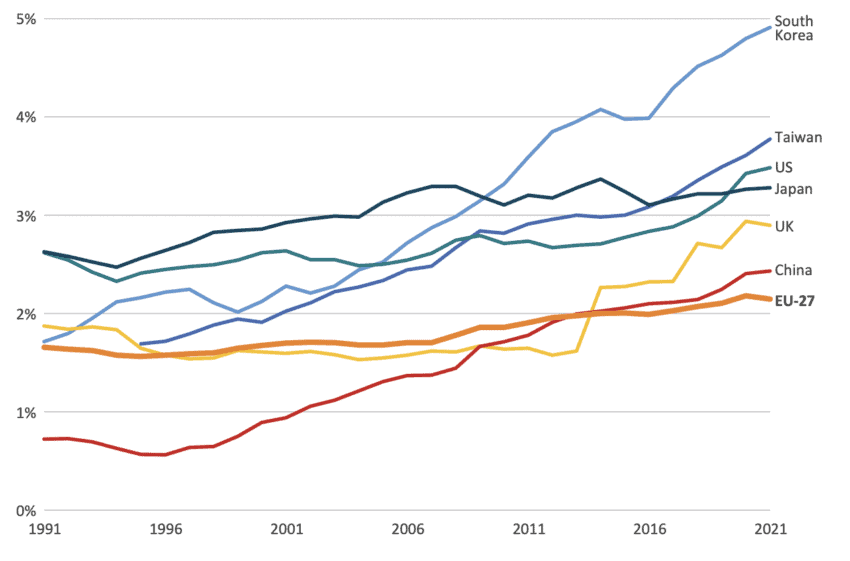 Source: OECD[1].
Figure 7 takes the analysis one step further and plots R&D expenditures as a percentage of GDP against GDP per capita in current US dollars for all EU countries and US states. The first thing that meets the eye is how much more scattered US states are with respect to EU countries in terms of R&D spending. While R&D expenditures as a percentage of GDP can range from over 8% in US states like New Mexico and Massachusetts to just about 0.6% in Louisiana and South Dakota, EU countries are more condensed at much lower levels, ranging from 3.4% in Belgium and Sweden to 0.5% in Romania. Secondly, R&D spending in the US is not only more sizeable, but also more concentrated in a set of very competitive states. Just as in Europe, the economic geography of R&D features regions that are at the frontier of global technological change and that help pull the rest of the economy into economic modernisation. It is notable, however, how much more the frontier states in the US spend on R&D compared to the frontier countries in the EU.
Regional comparisons also confirm this view. Out of 126 first-level regions in the EU, only 7 can boast R&D spending as a percentage of GDP higher than the US average – and only by relatively small margins too. European economic powerhouses like Bavaria, Île-de-France and Lombardy all devote less resources to R&D spending in relation to their output than the US as a whole[2]. Even more strikingly, despite being twice its size GDP-wise, Baden-Württemberg, the EU’s top R&D spending region in both absolute terms and relative to GDP, allocated a mere half to R&D expenditures (over 33 billion US$) than what the private sector alone spent in Silicon Valley (67 billion US$), the US’ most innovative metropolitan area[3]. What we witness in the EU is a scarcity of top performers, both at the national and regional level, and the few players that make the cut still lag remarkably far behind their US rivals. This calls for an in-depth analysis of the role of geographic concentration and diffusion of knowledge territorially in the EU and US.
Following Figure 7, there is a strictly linear correlation between the percentage of GDP allocated to R&D spending and GDP per capita, both among EU countries and US states. Broadly speaking, the more an EU country or a US state invests in R&D expenditures, the richer it tends to be and vice versa.
Figure 7: R&D spending (percentage of GDP) and GDP per capita (current US dollars) across EU countries and US states, 2021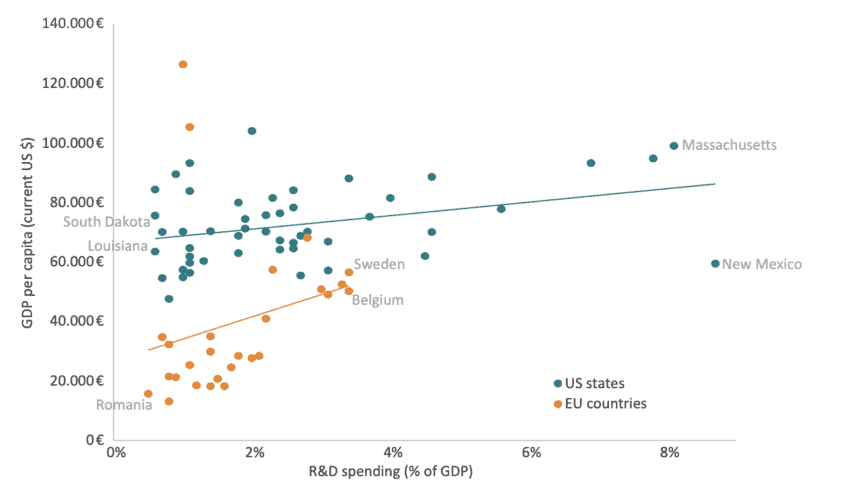 Source: Eurostat[4], National Center for Science and Engineering Statistics[5], US Bureau of Economic Analysis[6], US Census Bureau[7] and World Bank[8].
The positive correlation between R&D-induced innovation and GDP per capita has long been studied and corroborated[9]. However, one should not infer that R&D spending per se will automatically bring about productivity growth and thus a boost in competitiveness. Japan is a prime example of this: despite consistently spending around 3% of its GDP on R&D over the last three decades, Japan’s productivity has been stagnant, if not outright deteriorating during the very same period[10]. Albeit on a much smaller scale than Japan, some suggest that the US as well has encountered a similar fate of declining R&D efficiency in most recent decades[11]. These studies point to the empirical fact that virtually everywhere the research endeavour, especially on the part of firms, has increased substantially, yet productivity has been falling sharply. As a group of economists have concluded in an important study: “ideas are getting harder to find.”[12]
However, the reality behind these observations is that it now takes more R&D input to generate a new unit of innovation-driven economic expansion. This is why Europe’s R&D expenditures need a radical boost – or a “big bang”. With shares of R&D spending only moving sideways in a low-growth economy, there isn’t much capability to fuse the economy with more R&D inputs and effect a significant change in technology-driven productivity growth.
Despite calling for ever increasing R&D expenditures in an effort to prop up technological innovation, studies also suggest that “helicopter” R&D spending is a poor tactic. While broad-spectrum R&D funding, especially on the part of government, can help new ideas emerge, once high-potential segments and sectors are identified both within and across firms, public spending should be directed and private spending should be incentivised towards those areas and sectors that play the most to the strengths of such firms[13]. In more simple terms, not only must economies spend more on R&D but also turn more selective, and target carefully chosen disciplines and sectors.
A recent report by a group of European economists led by Nobel laureate Jean Tirole suggests that US private R&D spending is sizeable and focused on software-related and other high-tech companies, technologies that then fuse many other industries. By contrast, private R&D spending in the EU is much smaller and the bulk of it is concentrated in “mid-tech” industries such as the automotive or transportation – sectors with technologies less applicable outside their own industry. Similarly, only 5% of public-sector R&D spending in Europe sustains breakthrough innovation[14]. This qualitative distinction in the type of R&D spending between the EU and the US likely accounts for much of the difference in economic growth in the last decades and in the growth prospects for the years to come, unless the EU does not start shifting the direction of its innovation efforts towards high-tech industries[15].
Resuming the regional comparison between Baden-Württemberg and Silicon Valley, the innovation powerhouses of the two regions, the difference in technology profile becomes clearer. While many major companies in the Silicon Valley are engaged in high-tech sectors like software development and other computer services (Alphabet, Oracle, Apple, Intel, Cisco, Meta, NVIDIA and Adobe just to scratch the surface)[16], the main firms from Germany’s Baden-Württemberg are mostly specialised in middle-technology industries such as automotive manufacturing (Mercedes-Benz and Porsche) and consumer electronics (Bosch)[17].
The difference in technology profile between the two regions explains why R&D intensity in the Silicon Valley is almost four times as big as in Baden-Württemberg. The sectors dominating the Silicon Valley are much more R&D intensive and thus require more R&D expenditures. The greater R&D intensity of high-tech companies compared to mid-tech ones is further confirmed when focusing exclusively on Baden-Württemberg as well. SAP, the major computer-software company in the German region and the world’s leading provider of enterprise resource planning software, devoted 18% of its revenues to R&D spending in 2023[18], whereas Mercedes-Benz, Baden-Württemberg’s largest company and Germany’s second biggest car manufacturer, allocated a mere 6.5% in the same year[19].
As suggested by Tirole’s study, differences in R&D intensity have also likely reflected on the rates of economic growth of the two regions: while Baden-Württemberg’s GDP grew by 57% between 2001 and 2020[20], economic output in the greater Silicon Valley region has increased by 98% in the same period[21].
On the whole, the comparative analysis of R&D spending highlights a critical issue for Europe. Since the early 1990s, the EU has lagged significantly behind global counterparts, most notably the US, in terms of R&D expenditure as a percentage of GDP. This gap has contributed to the EU’s slower pace in technological innovation and economic growth. European firms, governments and other relevant actors alike must begin spending collectively well above the mere 2.1% of GDP they currently allocate to R&D expenditures and even go well beyond the mirage-like 3% goal set out in the 2000 Lisbon Strategy[22]. In order to bridge the current 1.3 percentage-point difference in R&D spending with the US, for instance, the EU would need to pour a staggering extra €200 billion into R&D – year in, year out. If it truly wants to bridge the gap to the technological frontier, the EU must not only increase its R&D investments but also strategically target high-impact sectors.
Breaking with Europe’s Risk Aversion and Freeing Up EU Savings
By allocating relatively less resources to R&D spending over the last thirty years, Europe has clearly failed to keep up with US innovation. However, many point to cultural and lifestyle factors as well when looking for culprits behind the EU’s poor performance in terms of competitiveness. Deep-rooted risk aversion, it is argued, permeates all levels of European society, from entrepreneurs and investors to consumers and policymakers, leading to a lack of innovative dynamism. This is an old observation, and there are both good and bad arguments supporting it. There is a difference in risk aversion, but the concept needs to be disentangled and policy should focus on changes that governments can encourage. Central in that pursuit should be capital markets. By analysing the allocation of European savings and household wealth as well as the limited role of pension funds, this section will highlight how regulation and risk aversion limit funding for new ventures, thus stifling innovation and market dynamism.
Regulation and risk-averse attitudes in Europe generally make market funding inaccessible and the entrepreneurial environment less hospitable for young, fast-growing firms and fresh ideas to emerge, those same brand-new firms and ideas that have boosted US productivity over the last decades[23]. As Nicolai Tangen, the CEO of Norway’s $1.6 trillion sovereign wealth fund, one of the largest single investors globally, noted in a recent interview with the Financial Times, “there’s a mindset issue in terms of acceptance of mistakes and risks. You go bust in America, you get another chance. In Europe, you’re dead”[24].
The relevance of risk aversion in Europe has been well documented. Berkeley University’s David Evans, for instance, thoroughly pointed to how risk-averse postures pervade all levels of European society and hinders innovation at its very core. In this regard, he put forth a three-legged theory of risk aversion: risk-averse entrepreneurs and investors tend to try less; risk-averse consumers and firms tend not to support newcomers; and risk-averse policymakers tend to regulate excessively. They all lead to little innovative dynamism: when they are combined, the effects are much stronger[25]. In a similar spirit, in a 2022 report on competitiveness McKinsey found that on average European businesses are less risk-taking than their American rivals on virtually all metrics of risk aversion and display a much less marked entrepreneurial disposition than their American counterparts[26].
Nevertheless, the bulk of risk aversion is unlikely to originate at the entrepreneurial level. While there is ample evidence that Europeans are indeed more sceptical of entrepreneurship than Americans[27], zooming in on this aspect in search for definitive answers would be misguided. Notable inventions of the recent past like Siri, Skype or the mRNA technology behind COVID-19 vaccines, to only name a few, are all Europe’s brainchildren that were either developed in the US or altogether bought when still in their startup stage by bigger American firms. In the 2001-2006 period alone, Apple, Alphabet, Microsoft, Amazon, and Facebook acquired an impressive 52 technology startups that were born in Europe[28]. Americans are only marginally more creative than Europeans but live in a place where they can build companies around their creations and maintain them. The real issue does not seem to be a lack of ideas or entrepreneurial spirit in Europe but an environment that hinders their growth and development.
One key factor to make sure that new, innovative firms can be born and stay in Europe is for them to secure readily available and sufficient funding. This is a fundamental problem in Europe that requires urgent attention. In an ECB communication in March 2023, all major EU authorities famously got together to lament that “right now, banks in Europe provide the bulk of investment funding. They alone, however, cannot help the EU win the global investment race, especially in comparison with the United States”. They summed up: “businesses, especially SMEs, are struggling to find the patient and risk-bearing funding they need” in the EU[29].
However, the potential is certainly there in Europe. Figure 8 plots saving rates for four sub-regions of the EU and the US and reveals how in all four regions, in spite of temporary fluctuations, Europeans tend to save more than Americans and have been doing so somewhat consistently over the last quarter century. The issue in Europe then is not the lack of resources. Yet if Europe does not have a private savings problem, it must have an investment problem. If the problem is not in the existence of funds, it must be in their allocation.
Figure 8: Saving rate for the US and sub-regions of the EU, 2000–2023 (percentage)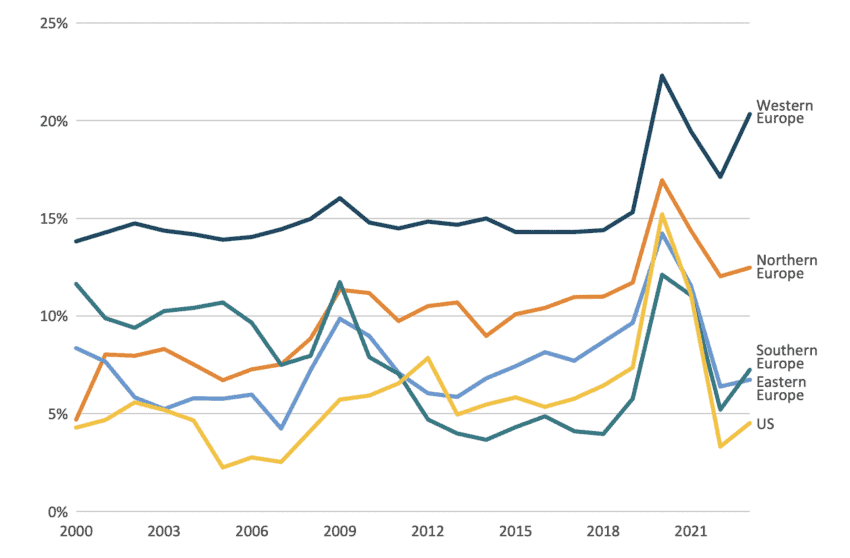 Source: Authors’ calculation based on Eurostat[30] and Federal Reserve Economic Data[31]. Note: Northern countries include Denmark, Finland, Ireland and Sweden. Western countries include Austria, Belgium, France, Germany, Luxembourg and the Netherlands. Southern countries include Croatia, Cyprus, Greece, Italy, Portugal, Slovenia and Spain. Eastern countries include the Czech Republic, Estonia, Hungary, Latvia, Lithuania, Poland and Slovakia. Data for Bulgaria, Malta and Romania is not available.
Copious evidence is there to show that rather than fuelling a prosperous capital market for firms to finance themselves, EU savings often go elsewhere[32]. A considerable chunk of it, in much larger proportions than in the US, is directed towards immobile assets.
When breaking down the composition of household wealth in the EU and the US, the difference between the two regions is staggering. Figure 9 reveals that American households on average hold almost 60% of their wealth in financial assets and less than 40% in real estate. Diametrically opposed, for European households real estate is by far the main asset category with over 70% of the overall average wealth, while financial assets constitute less than a fourth of the wealth held by EU households.
Figure 9: Average decomposition of household assets for the EU and the US, 2019 or latest available year (percentage of total)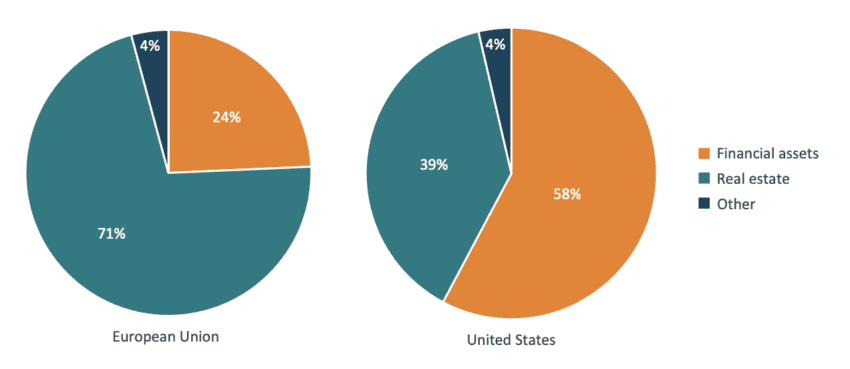 Source: Authors’ calculation based on OECD[33]. Note: the aggregate data points for the European Union do not include data for Bulgaria, Croatia, Cyprus, the Czech Republic, Malta, Romania and Sweden as it is unavailable.
Even more indicative, however, is that not only do European households resort to financial assets in much smaller proportions than their American counterparts, but even when they do, their portfolio composition is much more conservative than in the US. Figure 10 showcases a detailed categorisation of the average household financial asset portfolio in most EU countries and in the US. It is notable that in virtually all EU countries the average household tends to allocate a smaller portion of its financial wealth to securities, equity and shares than in the US.
This observation should also be coupled with the tendency of households in most European countries to devote a relatively smaller share than American households to insurance companies and pension funds, the latter of which can also be quite equity-heavy. A few notable exceptions exist such as Denmark, the Netherlands and Sweden where – albeit the securities, equity and shares portion is smaller – the sum of the two components is comparable to that of the US. In almost all the other European countries displayed in the figure, though, the bulk of the average household financial portfolio is made of currency and bank deposits, which are mostly unproductive investments, hence the most risk-averse financial instruments out there.
Figure 10: Household financial asset portfolio composition for the US and EU countries, 2022 (percentage of total)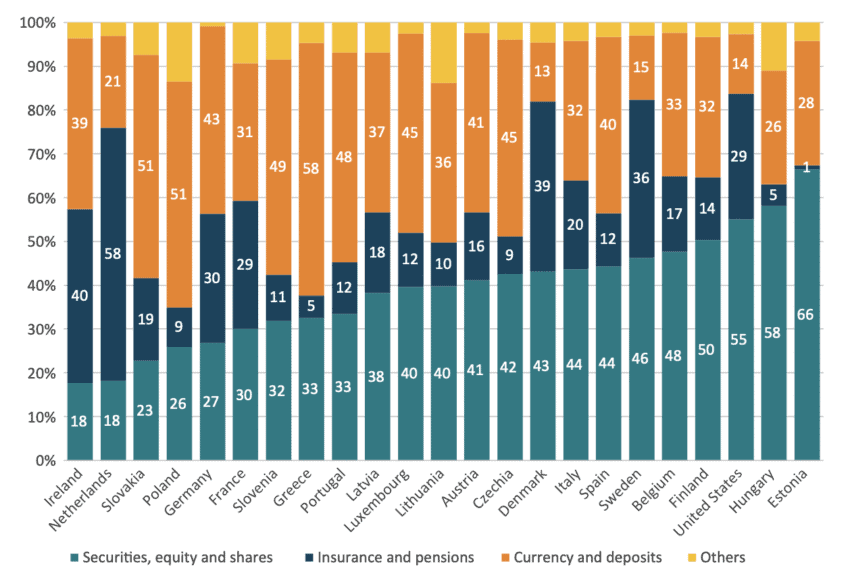 Source: OECD[34]. Note: data for Bulgaria, Croatia, Cyprus, Malta and Romania is not available.
The picture is much clearer now that all the dots are connected. The combination of a larger share of funds being devoted to financial assets together with a more proactive approach in channelling these very financial assets towards company equity make the American one an immense capital market that is ideal for firms to get funding, a market that is twice the size that of the EU[35].
In a similar vein, a closer inspection is needed for pension funds. Europe has famously earned itself the epithet of the “old continent” due to its centuries-long history and culture. However, the nickname sounds even more fitting when presented with one simple fact: Europe is by far the world’s oldest continent in terms of the age of its residents. The average median age in Europe in 2019, in fact, stood at 42 years, compared to 35 and 31 years in North and South America respectively, 33 years in Oceania, 31 years in Asia and only 18 years in Africa[36].
Given its demography European savings will serve more and more to prepare for retirement. As the traditional pension systems come under strain, it is only natural that most ageing countries will slowly transition to alternative forms of pension governance. Nevertheless, pension schemes in most EU countries are still dominated by a pay-as-you-go component rather than a capital-based one[37], whereas other countries around the world already resort way more heavily to pension funds and other similar financial instruments to handle retirement income.
Figure 11 shows the incidence of pension funds’ assets as a percentage of GDP in 2019 in a set of countries and regions. While nations like Australia, Switzerland and the UK hold pension funds’ assets larger than their yearly outputs and the US, Canada and Singapore all locate between 80% and 100% in terms of the share of pension funds’ assets with respect to GDP, this fraction in the EU is much more contained, barely above 20%. What is more is that the Netherlands alone accounts for almost 60% of all pension funds’ assets in the EU. Without Dutch assets, in fact, the overall share of EU pension funds’ assets would amount to less than 10% of GDP.
Figure 11: Pension funds’ assets for selected countries and areas, 2019 (percentage of GDP)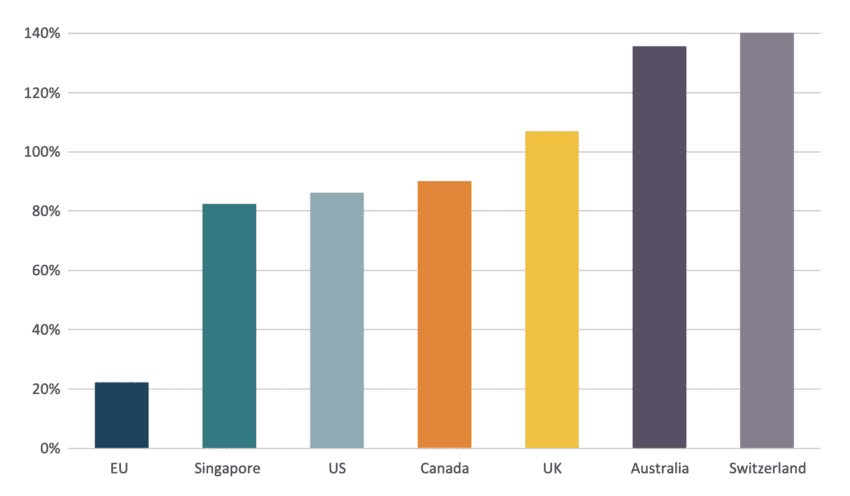 Source: OECD[38] and World Bank[39]. Note: for the EU, pensions funds’ assets data for Cyprus is not included as it is unavailable.
Allocation patterns tell us more about Europe’s problem of channelling savings to investments. Figure 12 reveals an unsurprising reality: similar to what happens for European savings at large, the composition of pension funds’ assets in the EU is much more cautious than anywhere else. While the portions of pension funds’ assets allocated to mutual investment funds and equity make up between 55% and 75% of the total in all the other countries in the sample, the combination of the two barely reaches 35% in the EU. The lion’s share in Europe goes to treasuries and low-risk corporate bonds, yet again the investments that regulations consider to be the safest.
Figure 12: Pension funds’ asset allocation for selected countries and areas, 2019 (percentage of total)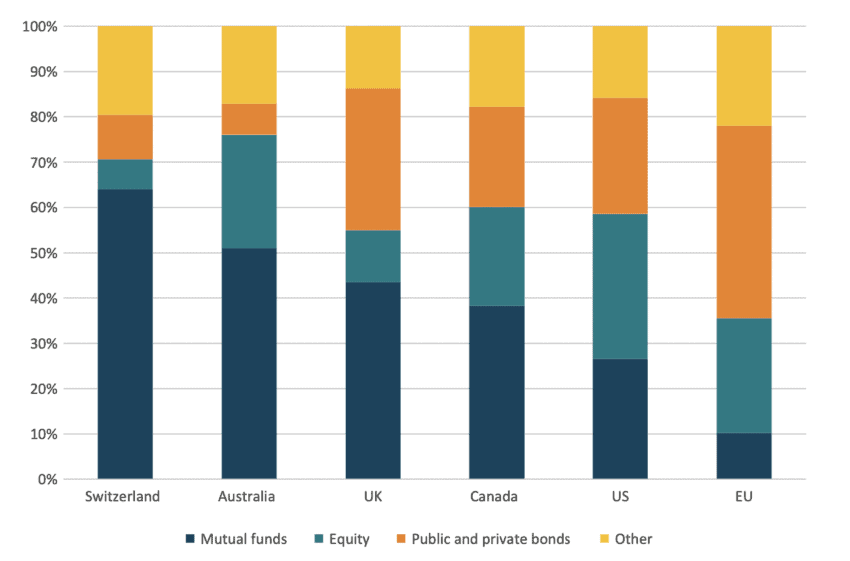 Source: OECD[40]. Note: for the EU, pensions funds’ assets data for Cyprus is not included as it is unavailable.
At odds with the US where pension fund savings have long represented a substantial pool of financial capital invested in American business[41], pension funds’ assets in Europe are yet another missed opportunity. EU countries should more clearly embrace pension funds and adopt a more balanced investment approach within them. This could help create a robust capital market for nascent firms to finance themselves and compete globally.
Change is possible and, if it happens, can soon deliver good outcomes. Positive paragons where consumers have progressively learned to let go of excessively cautious attitudes already exist within the EU. Sweden, for instance, has been capable of deepening its capital markets beyond any other European country thanks to a strong and widespread investment culture as well as local pension funds heavily turning to domestic equity[42], and it shows. Such risk-taking posture has allowed Sweden to breed more tech startups now valued at over $1billion, the so-called “unicorns,” per capita than virtually all other countries[43]. Europe’s largest private equity funds are Swedish.
Ultimately, the European innovation and entrepreneurial ecosystem faces significant challenges due to pervasive risk aversion and conservative investment patterns. While the potential for growth and innovation exists, the allocation of resources remains suboptimal. Shifting towards a more balanced investment approach, particularly reforms that will lead to a more equity-focused asset allocation, could significantly improve funding opportunities for new firms. EU savings are a sleeping giant, someone just needs to wake it up.
Reducing Regulatory Burdens
In the past decade, a new economic concept has emerged in Europe which suggests that the EU can regulate economies and technologies deeper, harder, and faster than other comparable economies without harming economic growth. Obviously, regulations can support economic growth, and regulations can be motivated even if they have negative impacts on the economy. Just as with other policies, a prudent approach is to take a “portfolio” approach to regulation: just as risky investments need to be combined with safer investments in a balanced portfolio, restrictive and costly regulations should be balanced by less restrictive and fewer cost-inducing regulations. This has not been the choice of Europe and the effects of the EU’s desire to regulate technology and technological change have clearly harmed the economy. A change of direction is now needed.
The EU has often taken pride in its ability to lead the world in regulation. The so-called “Brussels effect”[44], which is the EU’s capacity to exert global influence through regulatory power due to the sheer size and importance of its single market, has sometimes been at work. Some of the EU’s most recent and impactful regulations like the EU General Data Protection Regulation (GDPR) on data and privacy protection have prompted global companies to emulate some of their standards to other markets like Canada[45], India[46] and others[47]. Evidence also shows that EU regulations often significantly improve consumer protection, even in the digital field[48].
Nevertheless, regulation can be bad and poorly functional, if not outright hurtful, and have negative impacts on innovation. In a Wall Street Journal article titled “Europe Regulates Its Way to Last Place,” copious evidence highlights the growing mismatch between the hyper-advanced level of EU regulation, in particular of digital services, and Europe’s disappointing performance in terms of technological innovation with respect to the US and China[49]. As the two technological superpowers innovate at a faster pace, in response the EU regulates heavily to protect itself and its alleged “strategic autonomy.” However, additional regulation further hampers Europe’s innovation potential, widening the gap with the US and China, who keep innovating at Europe’s expense, in a never-ending cycle of foreign innovation and defensive regulation. As Europe’s share of the global economy gets smaller, and as European markets are becoming less significant for new technologies, there is also less desire on the part of global firms to use the EU standard as the basis for their global approaches.
Numerous studies give substance to the claim that excessive EU regulation often comes at the cost of its innovation. The GDPR, the EU’s most impactful privacy and security law and one of the EU’s self-defined “greatest achievements in recent years”[50], is frequently cited in this context. While it has raised consumer awareness about data privacy, it has also created confusion about exercising these rights[51], and has negatively impacted economic growth. Studies indicate that the GDPR decreased the number of successful apps by 40%[52], raised data storage costs for European firms by 20% compared to their American counterparts[53], and caused an average 8% drop in profits and a 2% decrease in sales for regulated firms. Large tech companies remained relatively unaffected, while small tech firms faced nearly double the negative impact on profits[54]. The GDPR has thus widened the gap between US and EU technology venture investment, with rising compliance costs causing many firms, especially nascent tech startups, to delay or divest from the EU altogether[55]. Similar concerns about lost innovation and rising costs for young firms also surround other proposed EU regulations like the Digital Markets Act[56] and the Data Act on cloud computing services[57].
Figure 13 paints a dramatic picture in this sense. When juxtaposing EU countries and US states in terms of venture capital investment in proportion to GDP, perhaps the most telling of indicators when it comes to measuring startup innovation, it is impressive to notice that European member states populate en masse the lower tail of the distribution. 42 out of the 50 US states devote more resources to venture capital investment relative to GDP than Europe’s most important economy, Germany. Even more strikingly, in absolute terms, California alone spent in 2022 roughly $100 billions in venture capital investment, more than seven times as much as all EU countries combined. Zooming in on Artificial Intelligence-related venture capital investment, the situation is even more grim[58].
Figure 13: Venture capital investment across EU countries and US states, 2022 (percentage of GDP) Source: OECD[59], Pitchbook[60] and US Bureau of Economic Analysis. Note: data for Cyprus and Malta is not available.
Regulating technology harder and harder in the absence of technological innovation, the EU risks resembling the proverbial Titanic orchestra that went on playing as the ship was sinking. As Germany’s Minister for Economic Affairs Robert Habeck has put it: “if Europe has the best regulation but no European companies, we haven’t won much“[61].
Negative spillovers from EU regulation extend beyond the digital sector to the space industry. A decade ago, Europe led the launch market with a 50% share[62]. However, firms like California-based SpaceX have since taken the lead, thanks in part to commercially driven US government procurement policies. In contrast, the European Space Agency’s (ESA) restrictive procurement policies have hindered competitiveness internationally[63]. As recently as 2013, officials from ESA and Arianespace, the French company entrusted with production, marketing and operation of ESA launchers, dismissed SpaceX as “a dream,” one that people would eventually “wake up [from] on their own”[64]. Now, SpaceX has tested the most powerful ever rocket system[65] and is set to go public with a $200 billion valuation[66], while Arianespace struggles to keep pace[67]. However, the ESA has begun to adapt, announcing in May 2023 that it would engage more private European companies to develop commercially viable cargo transportation systems, inspired by a successful NASA initiative that reduced orbital access costs[68].
Another pivotal yet heavily regulated sector is banking. In a continent where, as we have shown at length in the previous section, firms, especially young, fast-growing ones, have virtually no capital market to finance themselves from, restricting access to bank lending effectively means putting the brakes on innovation. A report commissioned by the European Banking Federation reveals huge difference in both profitability and ability to support the real economy between EU and US banks[69]. Ever since the outbreak of the 2007-2008 financial crisis, the EU banking sector has struggled with low profitability due to macroeconomic challenges, fragmented markets, prolonged negative interest rates and systemic barriers to cross-border consolidation. In contrast, US banks benefited from swift public recapitalisation and a supportive economic environment, allowing them to recover faster and maintain higher profitability.
On top of these structural factors, since the global financial crisis the EU has also implemented extensive regulatory measures to strengthen its banking system such as requirements to hold more high-quality capital and larger liquidity buffers, which have helped the bloc’s banking sector emerge from the subsequent COVID-19 crisis rather unscathed. However, the rise in regulation-induced costs for EU banks has come to represent a considerable chunk of the profitability gap with their US rivals[70]. Even more importantly, increasingly stringent capital and supervisory requirements on EU banks have severely crippled their capacity to assist the real economy. Estimates show that a relaxation of the current regulatory framework has the potential to increase current EU bank lending volumes by up to 30%, meaning an additional €4.5 trillion in bank financing available to the private sector every year[71]. In the EU, where the bulk of corporate borrowing, particularly for startups and SMEs, is still intermediated by banks, excessive regulation equals lending restrictions, which in turn means foregone growth.
It is time for voices of reform to step forward and offer new leadership on regulation. The reports of Enrico Letta and Mario Draghi are a good starting point for both understanding better regulation and raising awareness that Europe has been going down a path that is not economically sustainable. As we have shown, many of the other trends we have explored so far, such as poor business R&D spending and limited capital markets for firms to obtain financing, often stem from or at the very least are aggravated by the EU’s stringent regulatory framework. Building on these insights and taking a portfolio approach to regulation and other policies effecting the costs and growth of business, the EU can do a lot better.
[1] OECD (2024). Gross domestic spending on R&D (indicator). doi: 10.1787/d8b068b4-en
[2] Eurostat. (2019, 2021). Gross domestic expenditure on R&D (GERD) by NUTS 1 and 2 regions – Annual, All Sectors, Million euro and percentage of gross domestic product (GDP). https://ec.europa.eu/eurostat/databrowser/view/rd_e_gerdreg__custom_11662256/default/table?lang=en
[3] Shackelford, B. and Wolfe, R.; National Center for Science and Engineering Statistics (NCSES). (2020). Businesses Performed 60% of Their U.S. R&D in 10 Metropolitan Areas in 2018. NSF 21-331. Alexandria, VA: National Science Foundation. https://ncses.nsf.gov/pubs/nsf21331
[4] Eurostat. (2021). Gross domestic expenditure on R&D (GERD) at national and regional level – Annual, All Sectors, Percentage of gross domestic product (GDP). https://ec.europa.eu/eurostat/databrowser/view/rd_e_gerdtot__custom_11497276/default/table
[5] National Center for Science and Engineering Statistics, National Patterns of R&D Resources. (2021). Table 10: U.S. R&D expenditures, by state, performing sector, and source of funds: 2021 – GDP percent. https://ncses.nsf.gov/data-collections/national-patterns/2021-2022#data
[6] US Bureau of Economic Analysis. (2022). Gross domestic product (GDP) by state: All industry total (Millions of current dollars).
[7] US Census Bureau, American Community Survey 1-Year Estimates. (2022). Age and Sex – United States; All States within United States, Puerto Rico, and the Island Areas. https://data.census.gov/table/ACSST1Y2022.S0101?q=median%20age&g=010XX00US,$0400000&y=2022
[8] The World Bank, World Development Indicators. (2022). GDP per capita (current US$). https://data.worldbank.org/indicator/NY.GDP.PCAP.CD
[9] Ulku, H. (2004). R&D, Innovation, and Economic Growth: An Empirical Analysis. IMF Working Papers 2004/185, International Monetary Fund.
[10] Miyagawa, T. and Ishikawa, T. (2019). On the Decline of R&D Efficiency. RIETI Discussion Paper Series, No. 9-E-052, Research Institute of Economy, Trade and Industry, Tokyo.
[11] Bloom, N., Jones, C. I., Van Reenen, J. and Webb, M. (2020). Are Ideas Getting Harder to Find?. American Economic Review, American Economic Association, 110(4), 1104-1144.
[12] Ibid.
[13] Ivers, J., Roper, W., Watters, M. and Willison, J. (2024). Evolving federal R&D to meet the challenges of tomorrow. McKinsey & Company. https://www.mckinsey.com/industries/public-sector/our-insights/evolving-federal-r-and-d-to-meet-the-challenges-of-tomorrow
[14] Fuest, C,, Gros, D., Mengel, P.-L., Presidente, G. and Tirole, G. EU Innovation Policy – How to Escape the Middle Technology Trap?. EconPol Policy Report, April 2024. https://iep.unibocconi.eu/sites/default/files/media/attach/2Report_EU%20Innovation%20Policy_upd_240514.pdf
[15] Ibid.
[16] Cheema, R. (2024). Top 20 Tech Companies in Silicon Valley. Insider Monkey. https://www.insidermonkey.com/blog/top-20-tech-companies-in-silicon-valley-1293938/
[17] Munteanu, R. (2024). Baden-Württemberg: A Business Powerhouse in Germany. GT Visuals. https://www.gtvisuals.de/post/baden-w%C3%BCrttemberg-a-business-powerhouse-in-germany
[18] SAP. (2024). Fourth Quarter and Full-Year 2023 Results Presentation | January 24, 2024. https://www.sap.com/docs/download/investors/2023/sap-2023-q4-presentation.pdf
[19] Mercedes-Benz Group. (2024). Full Year Results and Annual Report 2023. https://group.mercedes-benz.com/investors/reports-news/annual-reports/2023/#:~:text=Research%20%26%20Development%20expenditure%20amounted%20to,2022%3A%20%E2%82%AC8.5%20billion)
[20] Statista. (2024). Bruttoinlandsprodukt von Baden-Württemberg von 1970 bis 2023 (Gross domestic product of Baden-Württemberg from 1970 to 2023). https://de.statista.com/statistik/daten/studie/5003/umfrage/entwicklung-des-bruttoinlandsprodukts-von-baden-wuerttemberg-seit-1970/#:~:text=Das%20Bruttoinlandsprodukt%20von%20Baden%2DW%C3%BCrttemberg,um%200%2C6%20Prozent%20zur%C3%BCck
[21] Vital Signs. (2022). Economic Output – How is the Bay Area’s economy doing?. Metropolitan Transportation Commission and the Association of Bay Area Governments. https://vitalsigns.mtc.ca.gov/indicators/economic-output
[22] European Commission. The 3% objective: brief history. https://ec.europa.eu/invest-in-research/action/history_en.htm
[23] The Economist. (2024). America is in the midst of an extraordinary startup boom. https://www.economist.com/finance-and-economics/2024/05/12/america-is-in-the-midst-of-an-extraordinary-startup-boom?giftId=a649fadf-ddcd-4bbe-91ea-f4c989fce00b
[24] Milne, R. and Wigglesworth, R. (2024). Europeans ‘less hard-working’ than Americans, says Norway oil fund boss. Financial Times. https://www.ft.com/content/58fe78bb-1077-4d32-b048-7d69f9d18809
[25] Evans, D. S. (2024). Why Europe Must End Its 30-Year Digital Winter to Ensure Its Long-Run Future. https://ssrn.com/abstract=4799197
[26] Smit, S., Tyreman, M., Mischke, J., Ernst, P., Hazan, E., Novak, J., Hieronimus, S. and Dagorret, G. (2024). Securing Europe’s competitiveness – Addressing its technology gap. McKinsey Global Institute. https://www.mckinsey.com/~/media/mckinsey/business%20functions/strategy%20and%20corporate%20finance/our%20insights/securing%20europes%20competitiveness%20addressing%20its%20technology%20gap/securing-europes-competitiveness-addressing-its-technology-gap-september-2022.pdf
[27] Manchin, A. (2010). Entrepreneur Mindset More Common in U.S. Than in EU, China. Gallup. https://news.gallup.com/poll/143573/entrepreneur-mindset-common-china.aspx
[28] Garelli, S. (2017). Europe’s innovation, America’s boon. International Institute for Management Development (IMD). https://www.imd.org/research-knowledge/start-up/articles/europes-innovation-americas-boon/
[29] Donohoe, P., Hoyer, W., Lagarde, C., Michel, C. and von der Leyen, U. (2023). Channelling Europe’s savings into growth. ECB blog. https://www.ecb.europa.eu/press/blog/date/2023/html/ecb.blog.230309~addaac5e08.en.html
[30] Eurostat. (2024). Gross household saving rate – Annual, Percentage. https://ec.europa.eu/eurostat/databrowser/view/NASA_10_KI__custom_3025885/bookmark/table?lang=en&bookmarkId=c028c52a-61dc-4d95-8b3e-1e2f2c892872
[31] Federal Reserve Bank of St. Louis. (2024). Personal Saving Rate – Percent, Annual, Seasonally Adjusted Annual Rate. Economic Research Division. https://fred.stlouisfed.org/graph/?g=580A#0
[32] Christie, R., McCaffrey, C. and Pinkus, D. (2024). EU savers need a single-market place to invest. Bruegel. https://www.bruegel.org/analysis/eu-savers-need-single-market-place-invest
[33] OECD. (2022). “Figure 2.1. Average decomposition of household assets, 29 OECD countries” from the Housing Taxation in OECD Countries report, Ch. 2. https://stat.link/z6oj0i
[34] OECD. (2022). Share of households and NPISHs’ currency and deposits, debt securities, equity, investment fund shares, life insurance and annuity entitlements and pension entitlements as a percentage of their total financial assets. https://data-explorer.oecd.org/vis?df[ds]=DisseminateFinalDMZ&df[id]=DSD_FIN_DASH%40DF_FIN_DASH_S1M&df[ag]=OECD.SDD.NAD&df[vs]=1.0&dq=A..LES1M_BF90.&pd=2010%2C&to[TIME_PERIOD]=false
[35] Lagarde, C. (2023). A Kantian shift for the capital markets union. Speech by Christine Lagarde, President of the ECB, at the European Banking Congress at Frankfurt am Main on November 17, 2023. https://www.ecb.europa.eu/press/key/date/2023/html/ecb.sp231117~88389f194b.en.html
[36] World Economic Forum. (2019). Mapped: The median age of the population on every continent. https://www.weforum.org/agenda/2019/02/mapped-the-median-age-of-the-population-on-every-continent/
[37] Pape, M. (2023). Understanding EU action on pensions. European Parliamentary Research Service. https://www.europarl.europa.eu/RegData/etudes/BRIE/2023/753953/EPRS_BRI(2023)753953_EN.pdf
[38] OECD. (2019). Pension funds’ assets (indicator) – millions of US dollars. doi: 10.1787/d66f4f9f-en
[39] The World Bank, World Development Indicators. (2019). GDP (current US$). https://data.worldbank.org/indicator/NY.GDP.MKTP.CD
[40] OECD. (2019). Pension funds (autonomous) – Structure of assets. Funded Pensions Indicators: Asset allocation. https://data-explorer.oecd.org/vis?df[ds]=DisseminateFinalDMZ&df[id]=DSD_FIN_DASH%40DF_FIN_DASH_S1M&df[ag]=OECD.SDD.NAD&df[vs]=1.0&dq=A..LES1M_BF90.&pd=2010%2C&to[TIME_PERIOD]=false
[41] Friedman, B. M. 1976. Public Pension Funding and U.S. Capital Formation: A Medium-Run View. Funding Pensions: Issues and Implications for Financial Markets. Federal Reserve Bank of Boston. https://www.bostonfed.org/-/media/Documents/conference/16/conf16f.pdf
[42] Asgari, N. (2024). How Sweden’s stock market became the envy of Europe. Financial Times. https://www.ft.com/content/edc1bba0-25ca-4148-96f6-d67e30f11a2e
[43] Thornhill, J. (2023). How European entrepreneurs can live the American dream. Financial Times. https://www.ft.com/content/c4740bfd-ecca-4fe3-8c97-cc9547cb6caa
[44] Bradford, A. (2012). The Brussels Effect. Northwestern University Law Review, 107(1), Columbia Law and Economics Working Paper No. 533. https://scholarlycommons.law.northwestern.edu/cgi/viewcontent.cgi?article=1081&context=nulr
[45] Mahieu, R., Asghari, H., Parsons, C., van Hoboken, J., Crete-Nishihata, M., Hilts, A. and Anstis, S. (2021). Measuring the Brussels Effect through Access Requests: Has the European General Data Protection Regulation Influenced the Data Protection Rights of Canadian Citizens?. Journal of Information Policy, 11, 301–349. doi: https://doi.org/10.5325/jinfopoli.11.2021.0301
[46] Thompson, L. A. (2023). The Brussels Effect 2.0: Is the EU Trying to Export Its Rules Globally?. Law.com. https://www.law.com/international-edition/2023/01/30/the-brussels-effect-2-0-is-the-eu-trying-to-export-its-rules-globally/
[47] O’Brien, S. and Ibraimova, A. (2022). The fourth anniversary of the GDPR: How the GDPR has had a domino effect. ReedSmith. https://www.technologylawdispatch.com/2022/05/privacy-data-protection/the-fourth-anniversary-of-the-gdpr-how-the-gdpr-has-had-a-domino-effect/
[48] Rösner, A., Haucap, J. and Heimeshoff, U. (2020). The impact of consumer protection in the digital age: Evidence from the European Union. International Journal of Industrial Organization, 73. https://doi.org/10.1016/j.ijindorg.2020.102585
[49] Ip, G. (2024). Europe Regulates Its Way to Last Place. The Wall Street Journal. https://www.wsj.com/economy/europe-regulates-its-way-to-last-place-2a03c21d
[50] European Data Protection Supervisor. (2024). The History of the General Data Protection Regulation. https://www.edps.europa.eu/data-protection/data-protection/legislation/history-general-data-protection-regulation_en
[51] Fazzini, K. (2019). Europe’s sweeping privacy rule was supposed to change the internet, but so far it’s mostly created frustration for users, companies, and regulators. CNBC. https://www.cnbc.com/2019/05/04/gdpr-has-frustrated-users-and-regulators.html
[52] Janßen, R., Kesler, R., Kummer, M. E. and Waldfogel, J. (2022). GDPR and the Lost Generation of Innovative Apps. NBER Working Papers 30028, National Bureau of Economic Research. https://www.nber.org/system/files/working_papers/w30028/w30028.pdf
[53] Demirer, M., Jiménez Hernández, D. J., Li, D. and Peng, S. (2024). Data, Privacy Laws and Firm Production: Evidence from the GDPR. NBER Working Papers 32146, National Bureau of Economic Research. https://www.nber.org/system/files/working_papers/w32146/w32146.pdf
[54] Chen, C., Frey, C. B. and Presidente, G. (2022). Privacy Regulation and Firm Performance: Estimating the GDPR Effect Globally. The Oxford Martin Working Paper Series 22(1). https://oms-www.files.svdcdn.com/production/downloads/Privacy-Regulation-and-Firm-Performance-Giorgio-WP-Upload-2022-1.pdf
[55] Jia, J., Zhe Jin, G. and Wagman, L. (2021). The Persisting Effects of the EU General Data Protection Regulation on Technology Venture Investment. The Antitrust Source, 20(6). https://www.americanbar.org/content/dam/aba/publishing/antitrust-magazine-online/2021/june-2021/jun2021-jia.pdf
[56] Jebelli, K. (2024). Confronting the DMA’s Shaky Suppositions. Truth on the Market. https://truthonthemarket.com/2024/04/16/confronting-the-dmas-shaky-suppositions/?s=03
[57] Gans, J., Hervé, M., & Masri, M. (2023). Economic analysis of proposed regulations of cloud services in Europe. European Competition Journal, 19(3), 522–568. https://doi.org/10.1080/17441056.2023.2228668
[58] Tricot, R. (2021). Venture capital investments in artificial intelligence: Analysing trends in VC in AI companies from 2012 through 2020. OECD Digital Economy Papers, No. 319, OECD Publishing, Paris. https://doi.org/10.1787/f97beae7-en
[59] OECD. (2022). Venture capital investments (market statistics) – US dollars, exchange rate converted, Millions and Percentage of GDP. OECD Entrepreneurship Financing Database. Venture capital investments (market statistics)
[60] Pitchbook. (2024). The Q1 2024 PitchBook-NVCA Venture Monitor – US VC deal value ($M) by state in 2022. https://pitchbook.com/news/articles/the-pitchbook-vc-dealmaking-indicator
[61] Henshall, W. (2023). E.U.’s AI Regulation Could Be Softened After Pushback From Biggest Members. Time. https://time.com/6338602/eu-ai-regulation-foundation-models/
[62] Amos, J. (2023). Europe risks being ‘a spectator in next space race’. BBC. https://www.bbc.com/news/science-environment-65053729
[63] Ibid.
[64] Bowles, R. (2013). Singapore Satellite Industry Forum 2013 – Changing the Launch Game?. Speech. https://web.archive.org/web/20170328025906/https://www.youtube.com/watch?v=XZ-7nNw-04Q
[65] Amos, J. (2023). Starship: SpaceX tests the most powerful ever rocket system. BBC. https://www.bbc.com/news/science-environment-64590147
[66] Tan, G. and Grush, L. (2024). SpaceX Weighs Plan to Sell Shares at $200 Billion Valuation. Bloomberg. https://www.bloomberg.com/news/articles/2024-05-23/spacex-considering-tender-offer-to-boost-value-to-200-billion
[67] Posaner, J. (2024). Europe’s space chief confirms rocket rival to Musk’s SpaceX won’t launch this year. Politico. https://www.politico.eu/article/esa-confirms-ariane-6-rocket-launch-slips-to-2024/
[68] Nicoli, F., Sekut, K. and Porcarco, G. (2023). Can Europe make its space launch industry competitive?. Bruegel. https://www.bruegel.org/analysis/can-europe-make-its-space-launch-industry-competitive
[69] Wuensch, O., Truempler, K. and Rubira, L. (2023). The EU banking regulatory framework and its impact on banks and the economy. Oliver Wyman. https://www.oliverwyman.com/content/dam/oliver-wyman/v2/publications/2023/jan/The-EU-banking-regulatory-framework-and-its-impact-on-banks-and-economy-.pdf
[70] Ibid.
[71] Ibid.
4. Conclusion
It has been said about the revolutions in 1848 that Europe was at a turning point – but it failed to turn. We are now at a turning point for Europe’s economy. Economic growth in Europe’s mature economies has been too low for too long. Productivity growth and other indicators of underlying economic dynamism show poor results. Public debt has been growing and remains worryingly high in several countries. Faced with falling relative prosperity and new demands on the public purse (an ageing population, war, and the energy transition), Europe has to turn.
A new strategy for improved competitiveness should start with a sober understanding of productivity and the gradual decline of Europe’s mature economies compared to frontier economies such as the US. Continental EU economies used to have higher productivity than the US – Italy used to be on par with US productivity levels – but in the last thirty years the two regions have grown apart. America’s economy has in many ways underperformed too, but its technology, R&D, and innovation driven sectors have contributed substantially to the economy and boosted Total Factor Productivity growth.
While the idea of creating large European champions through industrial subsidies seems to appeal to many as an easy way out to regain competitiveness, this course of action risks perpetuating the status quo rather than fostering genuine innovation and competitiveness. The US example has shown us that dynamic growth often stems from agile, tech-savvy startups and SMEs rather than entrenched corporate behemoths.
There is much else the EU can do to turn its economy around and provide business with much better conditions for growth. In this paper, we have pointed to three broad areas – all ripe for policy improvements.
First, expenditures on R&D should be radically expanded. Governments need to allocate substantially more resources to universities and, more importantly, create much better conditions for private R&D expenditures. Today, the EU cannot reach its own target from 2000 to have R&D expenditures at 3 per cent of GDP. To reach the US level of R&D expenditure as a share of GDP it would require a boost of approximately €200 billion per year.
Second, European savings need to find new ways to be deployed for investment and for growth. While Europe has a higher savings rate than the US, the EU’s capital markets are comparatively underdeveloped and fail to mobilise volumes and types of capital that can boost economic growth and investment in new and young companies. A bond market half the size that of the US makes it extremely hard for European firms to fund themselves and keep the pace of American innovation. Policies that help channel savings into a flourishing corporate market are urgently called for.
Third, the EU needs to change direction in its attitude to regulation. The EU regulates harder, deeper, and faster than other comparable economies, and this affects general costs of business and the propensity to innovate. Relaxation of existing regulations on the banking sector, for instance, could free up to €4.5 trillion every year, a much-needed sum for European firms, especially small ones, seeking to finance themselves and innovate amid the green and digital transition.