
Summary
DOWNLOAD PDFThe Cloud and AI Development Act (CADA) would create a common EU framework for deciding when public authorities, and potentially private organisations in essential sectors, must use cloud services that meet progressively stronger sovereignty requirements – ranging from UAL1 to UAL4, with each level further constraining eligible providers and technology architectures. The framework is intended to address security, resilience and technological-dependence concerns, but it also changes which providers, software components and operating models remain available for affected workloads.[1]
Until now, discussions on CADA have relied on economic data that do not fully capture the framework’s potential financial footprint and impact on taxpayers. To fill that empirical gap, this ECIPE study quantifies broader adjustments that are not monetised or only partly monetised in the European Commission’s impact assessment.
Crucially, while the Commission acknowledged individual application migration benchmarks (between €30,000 and €600,000), it omitted one-off application re-architecting and code-rewriting expenses from its final monetised equations – a surprising omission given that system redesign ultimately represents the single largest cost driver of CADA, accounting for nearly 70 per cent of total economic exposure.[2]
Second, the official assessment does not separately quantify the transition costs associated with market adjustment lags, capacity shortages and software-layer bottlenecks. The European Commission recognises that risk assessments need to take account of the reality of the supply market, but the associated scarcity and adjustment costs are not separately monetised. This study finds no broad European supply base capable of meeting requirements comparable to the proposed UAL3 and UAL4 criteria at scale.
Moreover, such capability remains concentrated in a relatively small number of providers and larger established markets, particularly France and Germany. This creates an important distributional effect within the Single Market: smaller Member States with limited domestic qualifying supply may have little practical choice but to source higher-assurance services cross-border, potentially at higher prices, while a disproportionate share of the associated demand, investment and supplier activity accrues to providers located in larger Member States. CADA would therefore reduce some forms of third-country dependence while simultaneously increasing the dependence of smaller Member States on a handful of larger EU markets.
Third, the Commission’s monetised assessment remains centred on public procurement even though the CADA proposal itself explicitly anticipates broader private-sector spillovers. Recital 66 explicitly recognises that requirements imposed on public authorities tend to be mirrored by private-sector entities in regulated industries, contributing to wider market realignment over time. Article 31 gives this spillover a concrete legal channel: private entities in high-criticality NIS2 sectors may carry out the same type of assessments as the public sector, and the Commission may require such assessments and corresponding mitigation measures through delegated acts. The spillover is therefore not a remote hypothetical. Because private organisations operate essential infrastructure in sectors such as energy, banking, transport and healthcare – and because the potential private-sector cloud base is substantially larger than the public-sector base – even partial transmission of CADA requirements into these sectors can materially enlarge the regulation’s economic footprint.
To quantify the economic effects associated with these analytical gaps, this ECIPE study estimates the economic adjustment costs and fiscal exposure that could result from these policy choices. It focuses on channels that are not or only partly captured in the European Commission’s impact assessment, including higher cloud prices, migration and software redesign, temporary shortages of qualifying services, delays to cloud and AI adoption, and additional investment requirements. The study estimates the principal cumulative effects the over ten-year period, from 2027 to 2036. It does not monetise potential security, resilience or strategic-autonomy benefits and should therefore not be interpreted as a complete social cost-benefit assessment.
The estimated economic exposure changes sharply with the way CADA is implemented: €35.6 billion under the Narrow scenario, €115 billion under Medium and €233 billion under Broad over 2027–2036. The Medium scenario is used as the central reference case because it provides a deliberately moderate benchmark between the restrained Narrow scenario and the higher-scope Broad scenario. It assumes that 20 per cent of affected workloads fall into highly restrictive UAL3-4 categories and that Article 31 requirements extend to 25 per cent of the potential private essential-sector base.[3]
Figure 1: Estimated cumulative CADA economic exposure by implementation scenario, 2027–2036 (€ billion)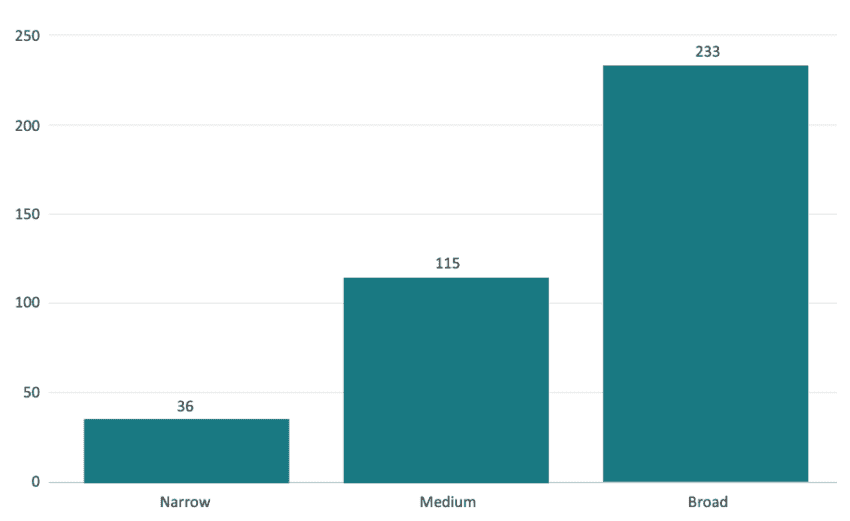 Source: ECIPE calculations. Note: The figures include higher cloud costs, migration and software-adjustment costs, and the economic effects of postponed digitalisation.
Source: www.cada-impact.eu
The scale of these estimates becomes clearer when compared with major EU technology and innovation programmes. The €115 billion cumulative economic exposure under the Medium scenario is around 23 per cent larger than the entire €93.5 billion Horizon Europe research and innovation budget for 2021-2027; the €233 billion Broad estimate is approximately two and a half times that budget. The narrower direct public-budget component is also substantial: at €33.3 billion under Medium, it is equivalent to roughly three-quarters of the €43 billion-plus public-investment benchmark associated with the European Chips Act and more than three times the up to €10 billion in EU and national public funding supporting the Commission’s current AI Gigafactories initiative.[4]
Table 1: The scale of CADA’s economic exposure compared with major EU technology investments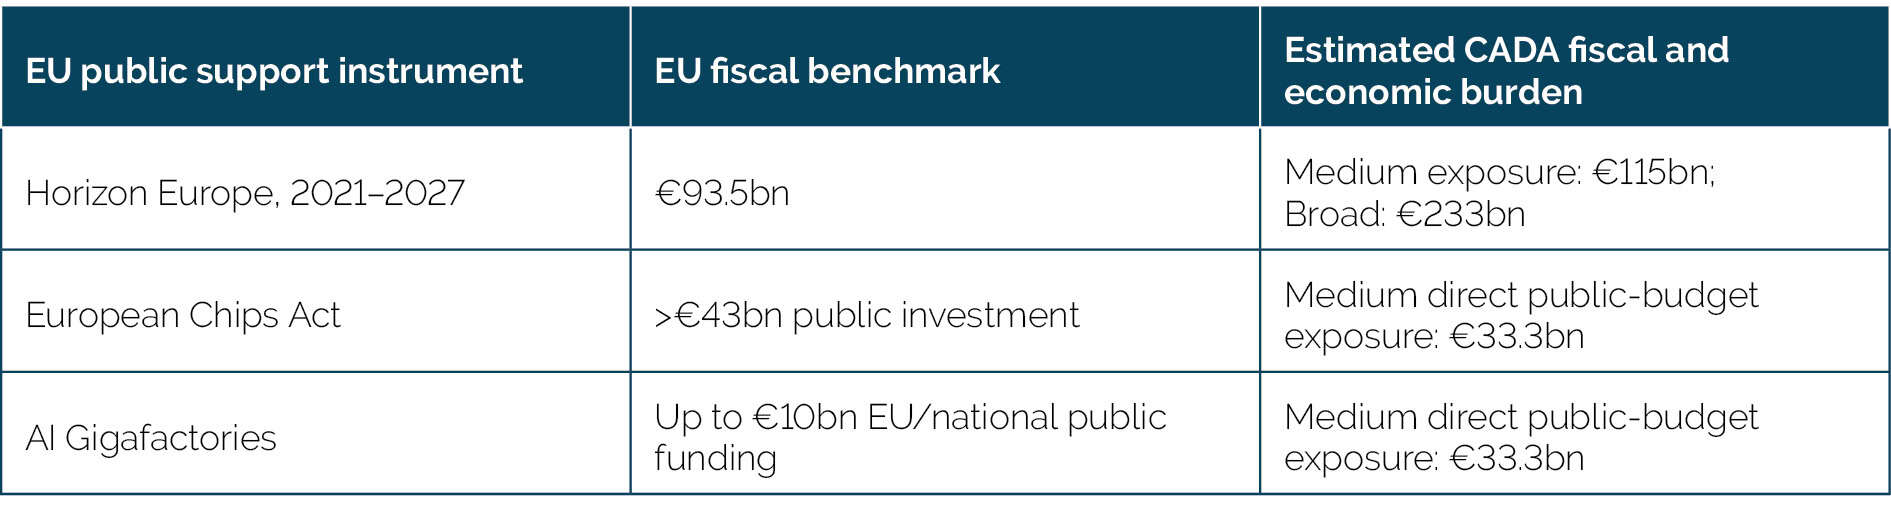 Source: ECIPE calculations based on European Commission programme figures. Note: Comparisons illustrate magnitude only; the CADA estimates are not equivalent to programme budgets or investment commitments.
To make the national estimates comparable across economies of different sizes, Table 2 divides each Member State’s ten-year exposure under each scenario by its 2025 working-age labour force.[5] Under the Medium scenario, average economy-wide exposure is approximately €548 per person in the working-age labour force across the EU27.
Table 2: 10-year economic exposure per person in the working-age labour force, by implementation scenario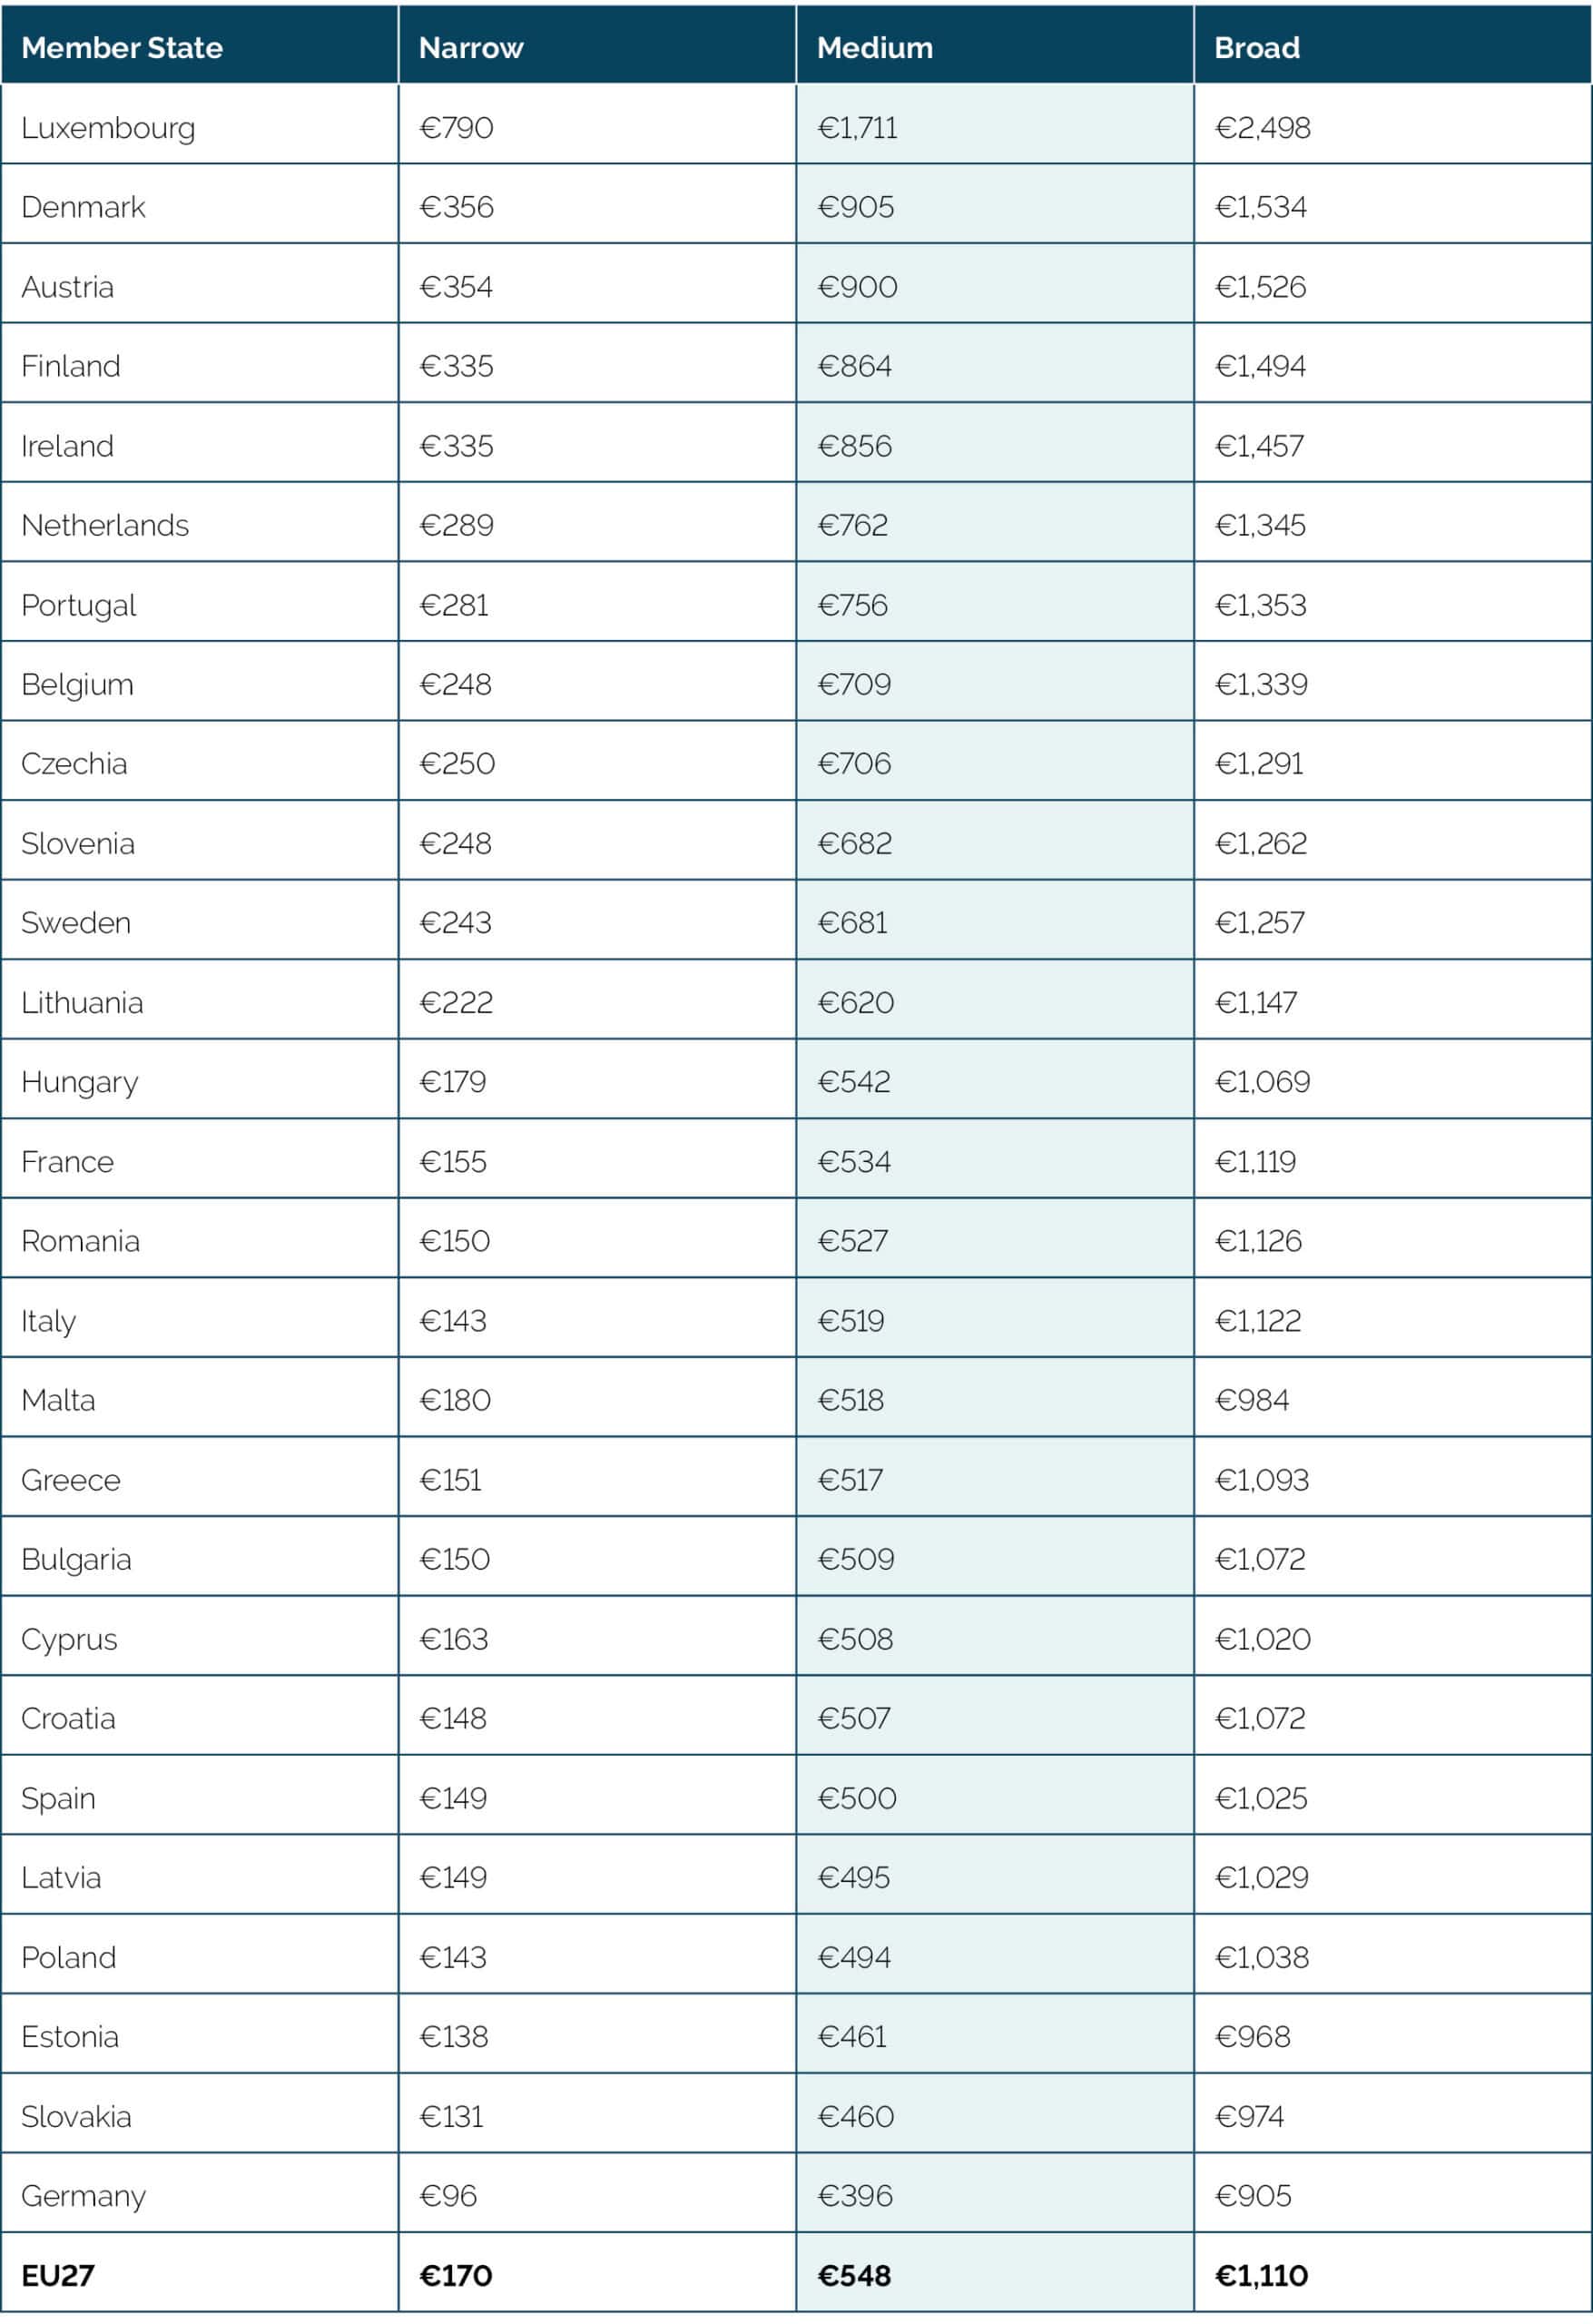 Source: ECIPE calculations. Note: Countries are ranked by Medium-scenario exposure per person in the working-age labour force. The denominator is the 2025 resident labour force aged 20–64, based on Eurostat data, and is held constant across scenarios. The numerator is the study’s ten-year cumulative quantified economic exposure, including public-sector exposure and conditional private-sector exposure through Article 31.
The direct fiscal burden is narrower than the overall economic exposure. Part of the CADA adjustment would fall directly on public budgets through higher cloud-service expenditure and the costs of migrating, rewriting and adapting public-sector applications. Because these expenditures ultimately have to be financed from public revenues or offset by lower spending elsewhere, the study refers to them as a taxpayer cost equivalent. Under the Medium scenario, these direct public-budget costs amount to approximately €33.3 billion over 2027–2036, equivalent to around €159 per person in the working-age labour force across the EU27. The corresponding figures are approximately €82 under Narrow and €188 under Broad.
The comparison across Member States is shown in Table 3. As with the economy-wide measure in Table 2, the figures are standardised using the 2025 working-age labour force. They should therefore be interpreted as taxpayer cost equivalents rather than forecasts of the additional tax bill faced by an individual taxpayer.
Table 3: Taxpayer cost equivalent per person in the working-age labour force, by implementation scenario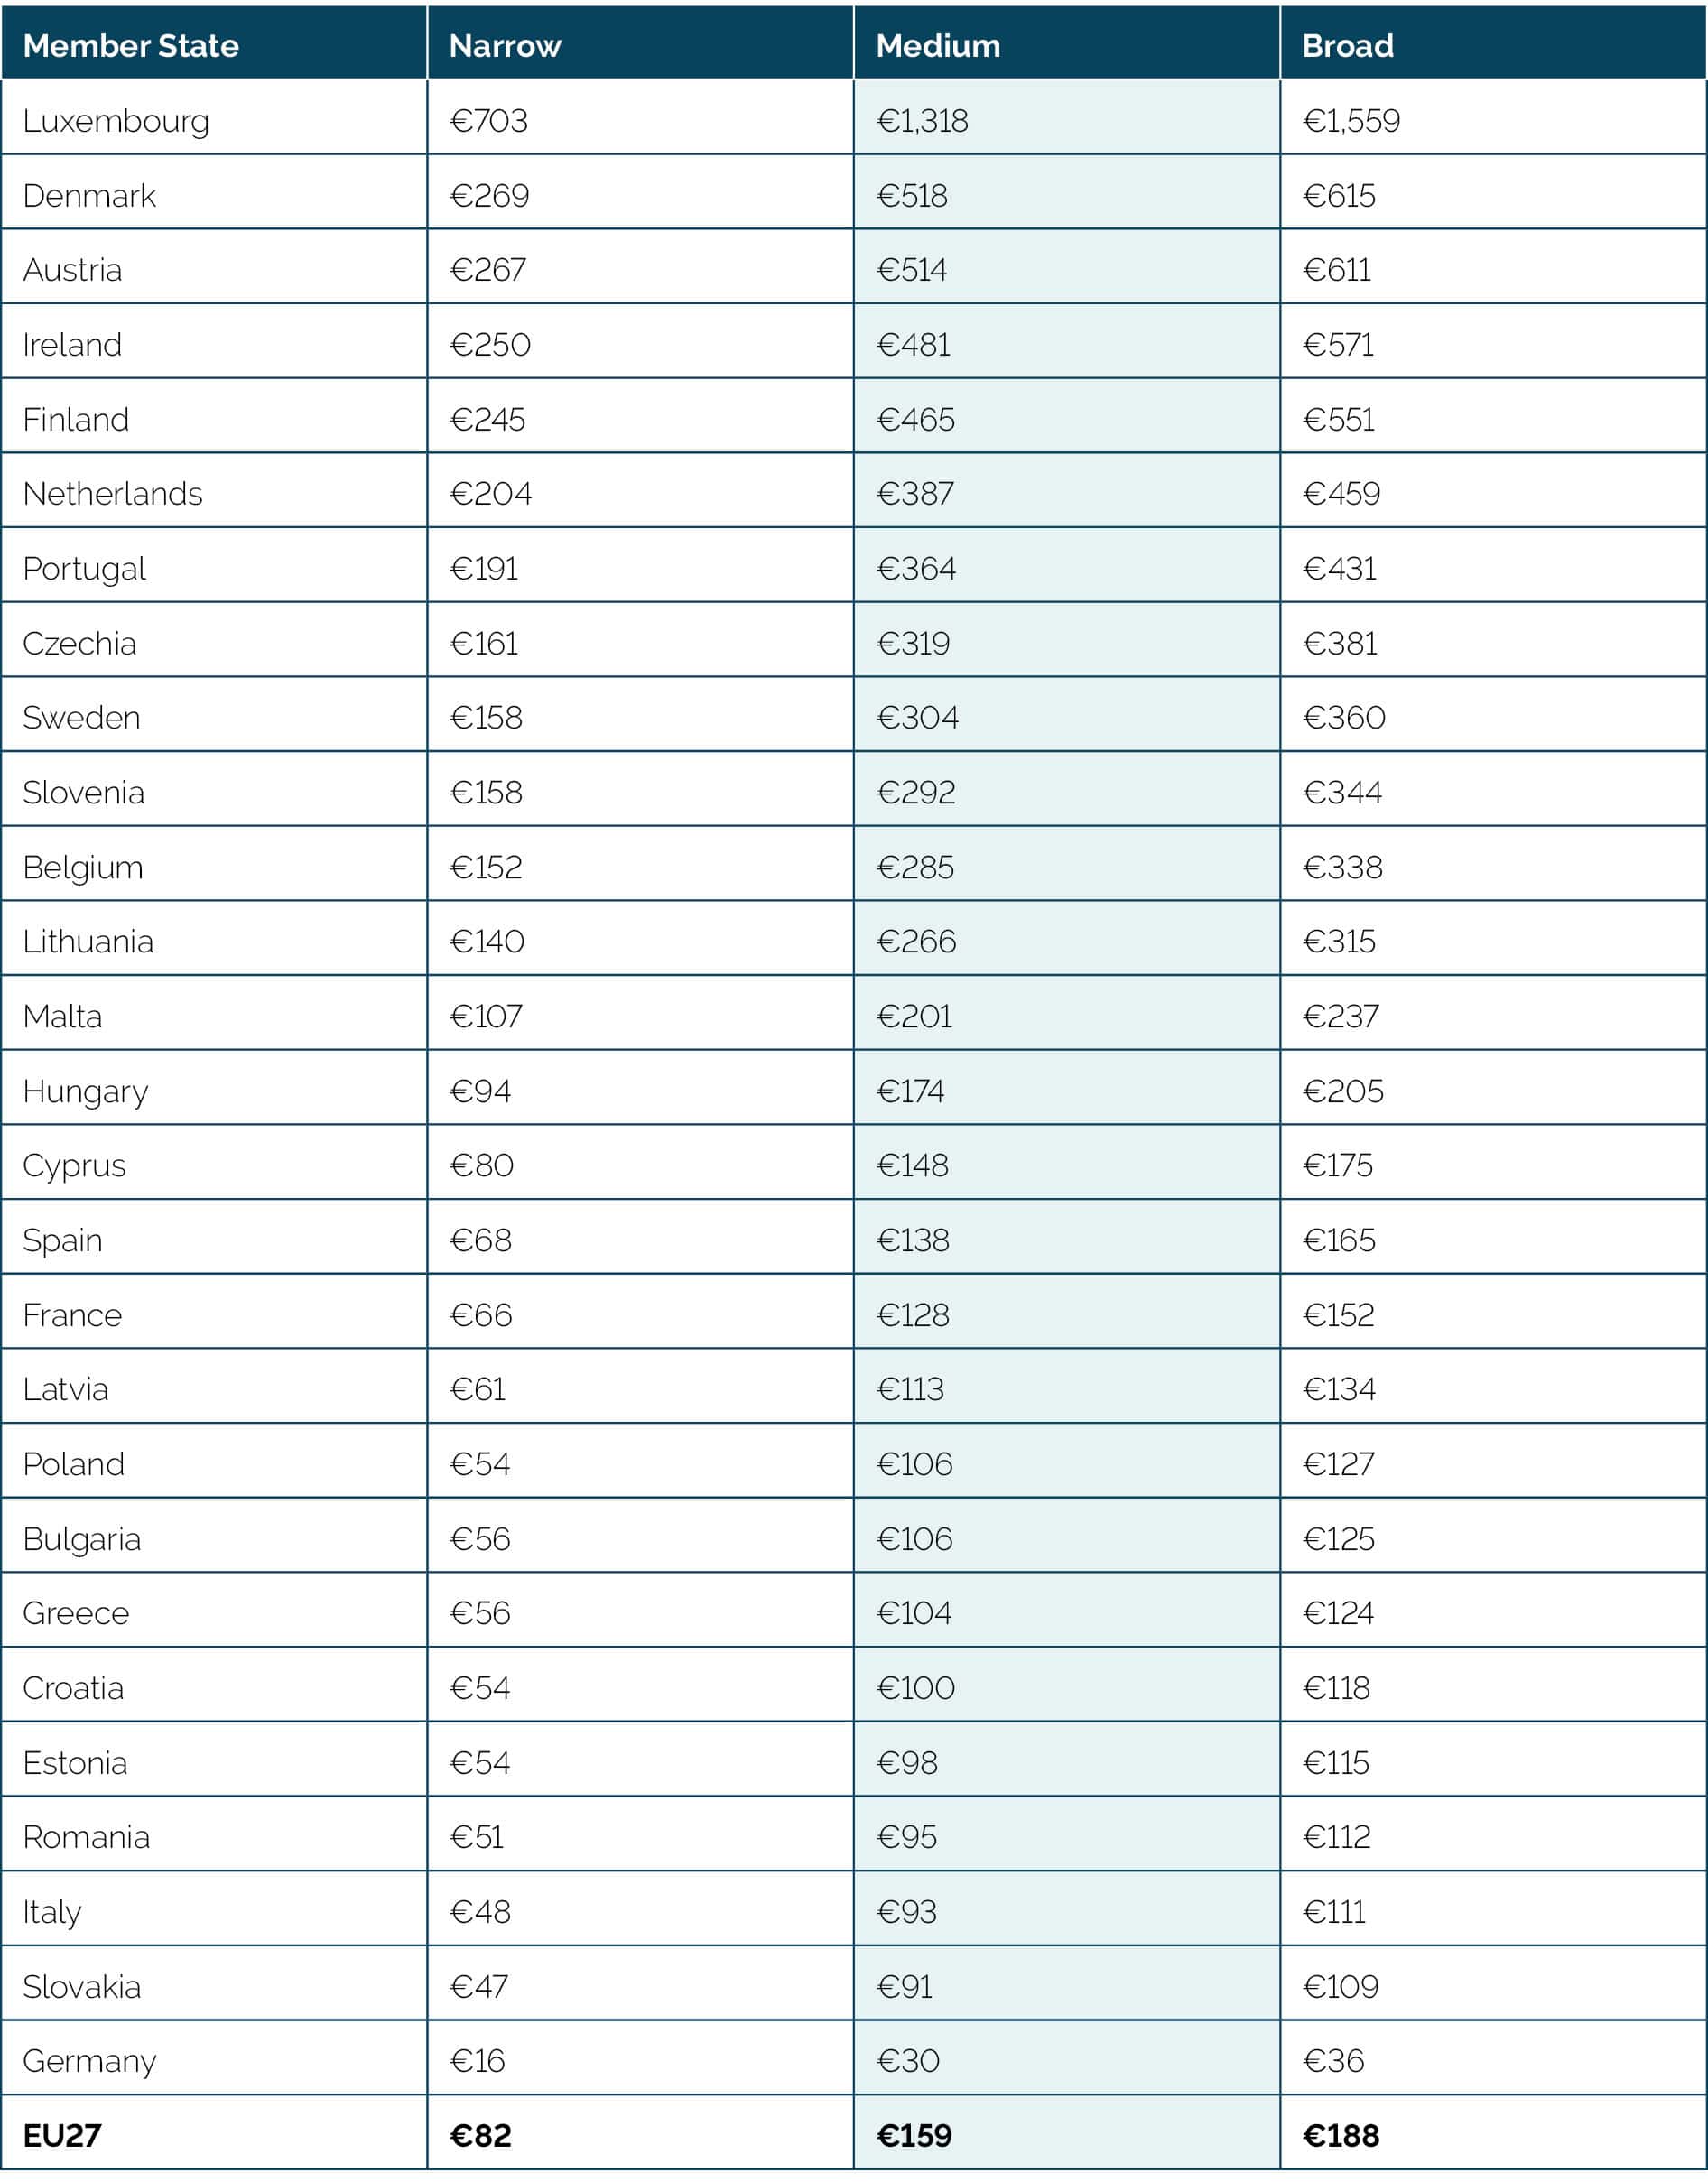 Source: ECIPE calculations. Note: Countries are ranked by the Medium-scenario taxpayer cost equivalent. The numerator comprises higher public-sector cloud expenditure and public-sector migration and software-rewriting costs over 2027–2036. It excludes postponed digitalisation, private-sector exposure through Article 31, provider investment and other non-budgetary effects. The denominator is the 2025 resident labour force aged 20–64. The figures are standardised fiscal-incidence indicators and should not be interpreted as individual tax liabilities. Luxembourg should be interpreted with particular caution because the resident labour-force denominator excludes incoming cross-border workers.
Put differently, under the central Medium scenario the direct public-budget exposure alone corresponds to about €159 for every person in the EU’s working-age labour force. The taxpayer cost equivalent captures only the costs that fall directly on public budgets. It does not include the potentially much larger adjustment costs faced by private organisations affected through Article 31. Under the Medium scenario, the study estimates approximately €80 billion in potential private-sector exposure, principally through higher cloud costs and migration and software-adjustment requirements. Article 31 coverage is conditional in the model and rises from 10 per cent under Narrow to 25 per cent under Medium and 50 per cent under Broad.
Those private-sector costs would initially be borne by the regulated organisations, but the ultimate economic incidence need not stop there. Where market conditions allow, part of higher compliance and technology costs may be passed through to households and other businesses through higher prices, tariffs or fees. In this economic sense, regulation-induced cost pass-through can resemble the incidence of an indirect tax: the government does not collect the money, but a legal requirement raises the cost of supplying goods or services and part of that cost may ultimately be borne by customers. The extent of pass-through will vary across sectors according to competition, price regulation and firms’ ability to absorb costs in margins.
Table 4 summarises the estimated EU-wide economic exposure across the three scenarios. The results indicate that the largest effects arise from recurring cloud-price increases and software migration and rewriting, while delayed digitalisation and temporary shortages of compliant services add further adjustment costs.
Table 4: The main EU-wide economic impacts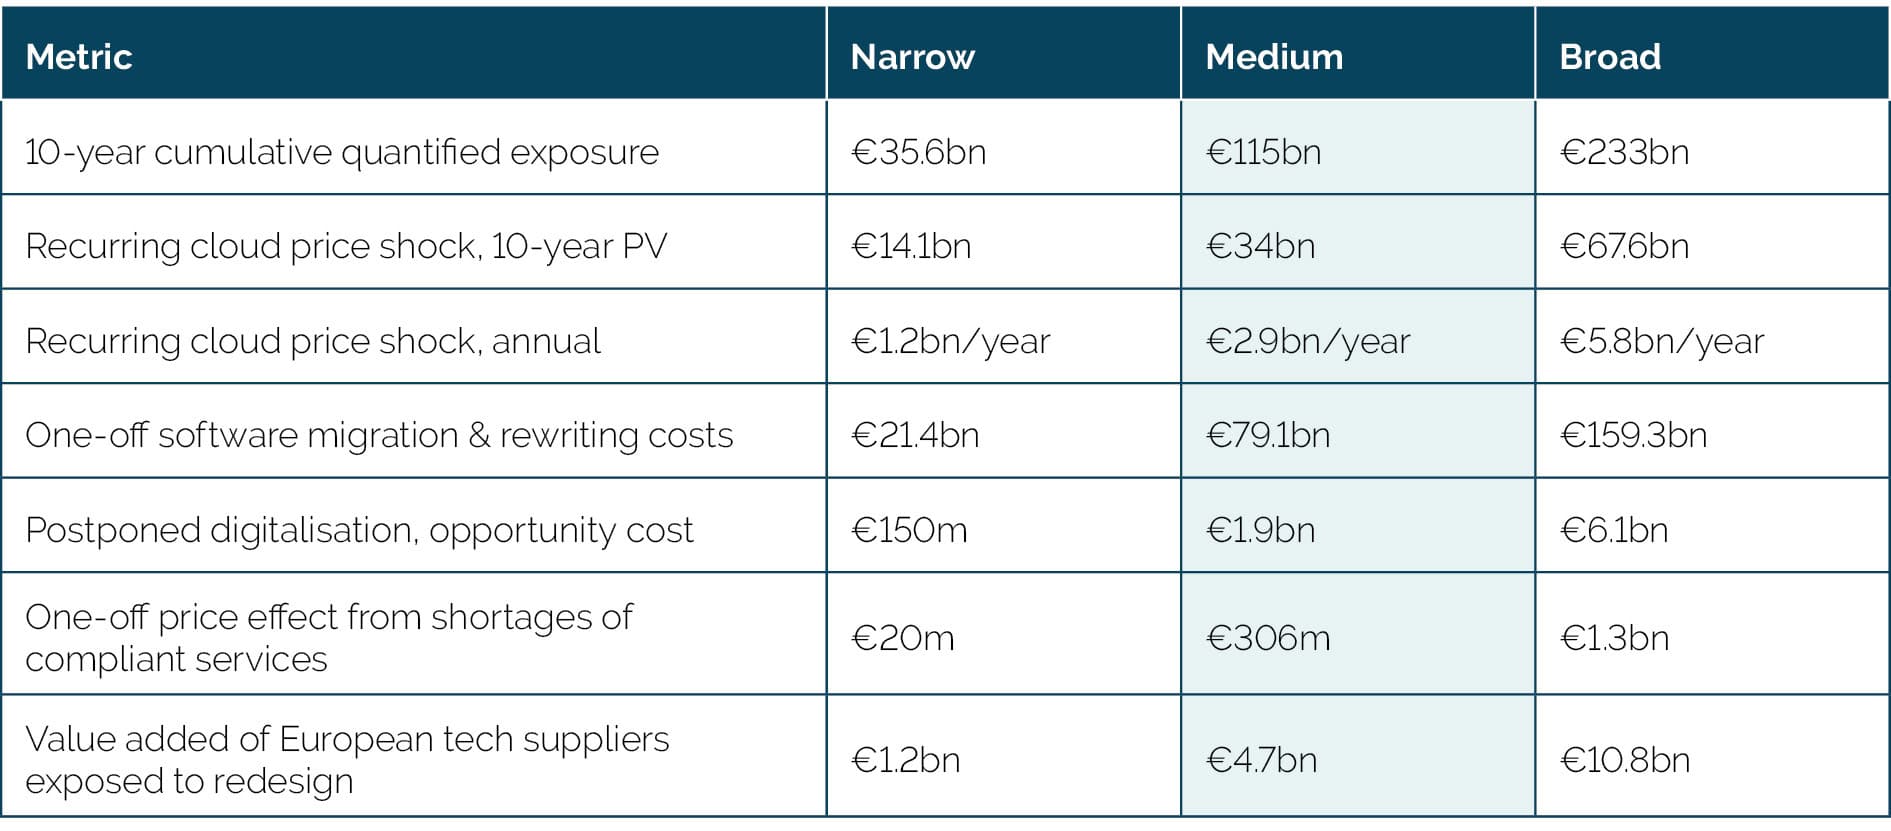 Source: ECIPE calculations.
The direct cost effects also trickle down through the wider economy. The accompanying macroeconomic analysis estimates that EU27 real GDP would be approximately 0.012 per cent below the no-CADA baseline under the Narrow scenario, 0.046 per cent under Medium and 0.104 per cent under Broad. These correspond to differences in the level of real GDP of approximately €2.1 billion, €8.5 billion and €19.4 billion, respectively (Table 5).[6]
The standardised national comparison reveals substantial differences in estimated exposure. Under Medium, Luxembourg records approximately €1,711 per person in the working-age labour force, followed by Denmark (€905), Austria (€900), Finland (€864) and Ireland (€856). The Netherlands (€762) and Portugal (€756) also exceed the EU27 benchmark of €548. By comparison, the economy-wide equivalents are approximately €534 in France, €519 in Italy and €396 in Germany. These variations arise from the modelled expenditure bases, sectoral composition, regulatory starting points and assumptions about private-sector exposure; the results should not be read as proving that any single factor, such as digital maturity, determines national outcomes.
Several larger Member States with pre-existing national cloud-security, qualification or sovereignty requirements – such as Germany, France, Spain and Italy – absorb a smaller incremental shock in the model because parts of their public sectors already operate under related restrictions.
The fiscal interpretation is narrower. Under Medium, the estimated public-budget component corresponds to approximately €1,318 per person in the working-age labour force in Luxembourg, €518 in Denmark, €514 in Austria, €465 in Finland and €481 in Ireland. The corresponding figures are around €128 in France, €93 in Italy and €30 in Germany, reflecting both national modelling assumptions and the size of the denominator. These are illustrative public-budget equivalents rather than actual tax liabilities. Comparisons for Luxembourg require particular caution because the residential labour-force statistic excludes cross-border commuters working in the country.
The macroeconomic results measure a separate outcome: differences in the level of real GDP once the modelled adjustment has worked through the economy. Under Medium, these amount to approximately −€494 per person in the working-age labour force in Luxembourg, −€367 in Cyprus, −€287 in Ireland and −€41 across the EU27.
Compounding this disparity, European cloud capability capable of meeting requirements comparable to UAL3 and UAL4 is concentrated in a relatively small number of providers and markets, particularly France and Germany. Many smaller Member States have limited domestic supply shown in the study to meet these requirements at scale.
This geographic mismatch can require more open, digitised economies to source qualifying capacity cross-border, potentially at higher prices. CADA may therefore shift part of the dependence from third-country providers towards qualifying providers elsewhere in the EU, with uneven effects across Member States.
Table 5: Estimated real GDP effect relative to the no-CADA baseline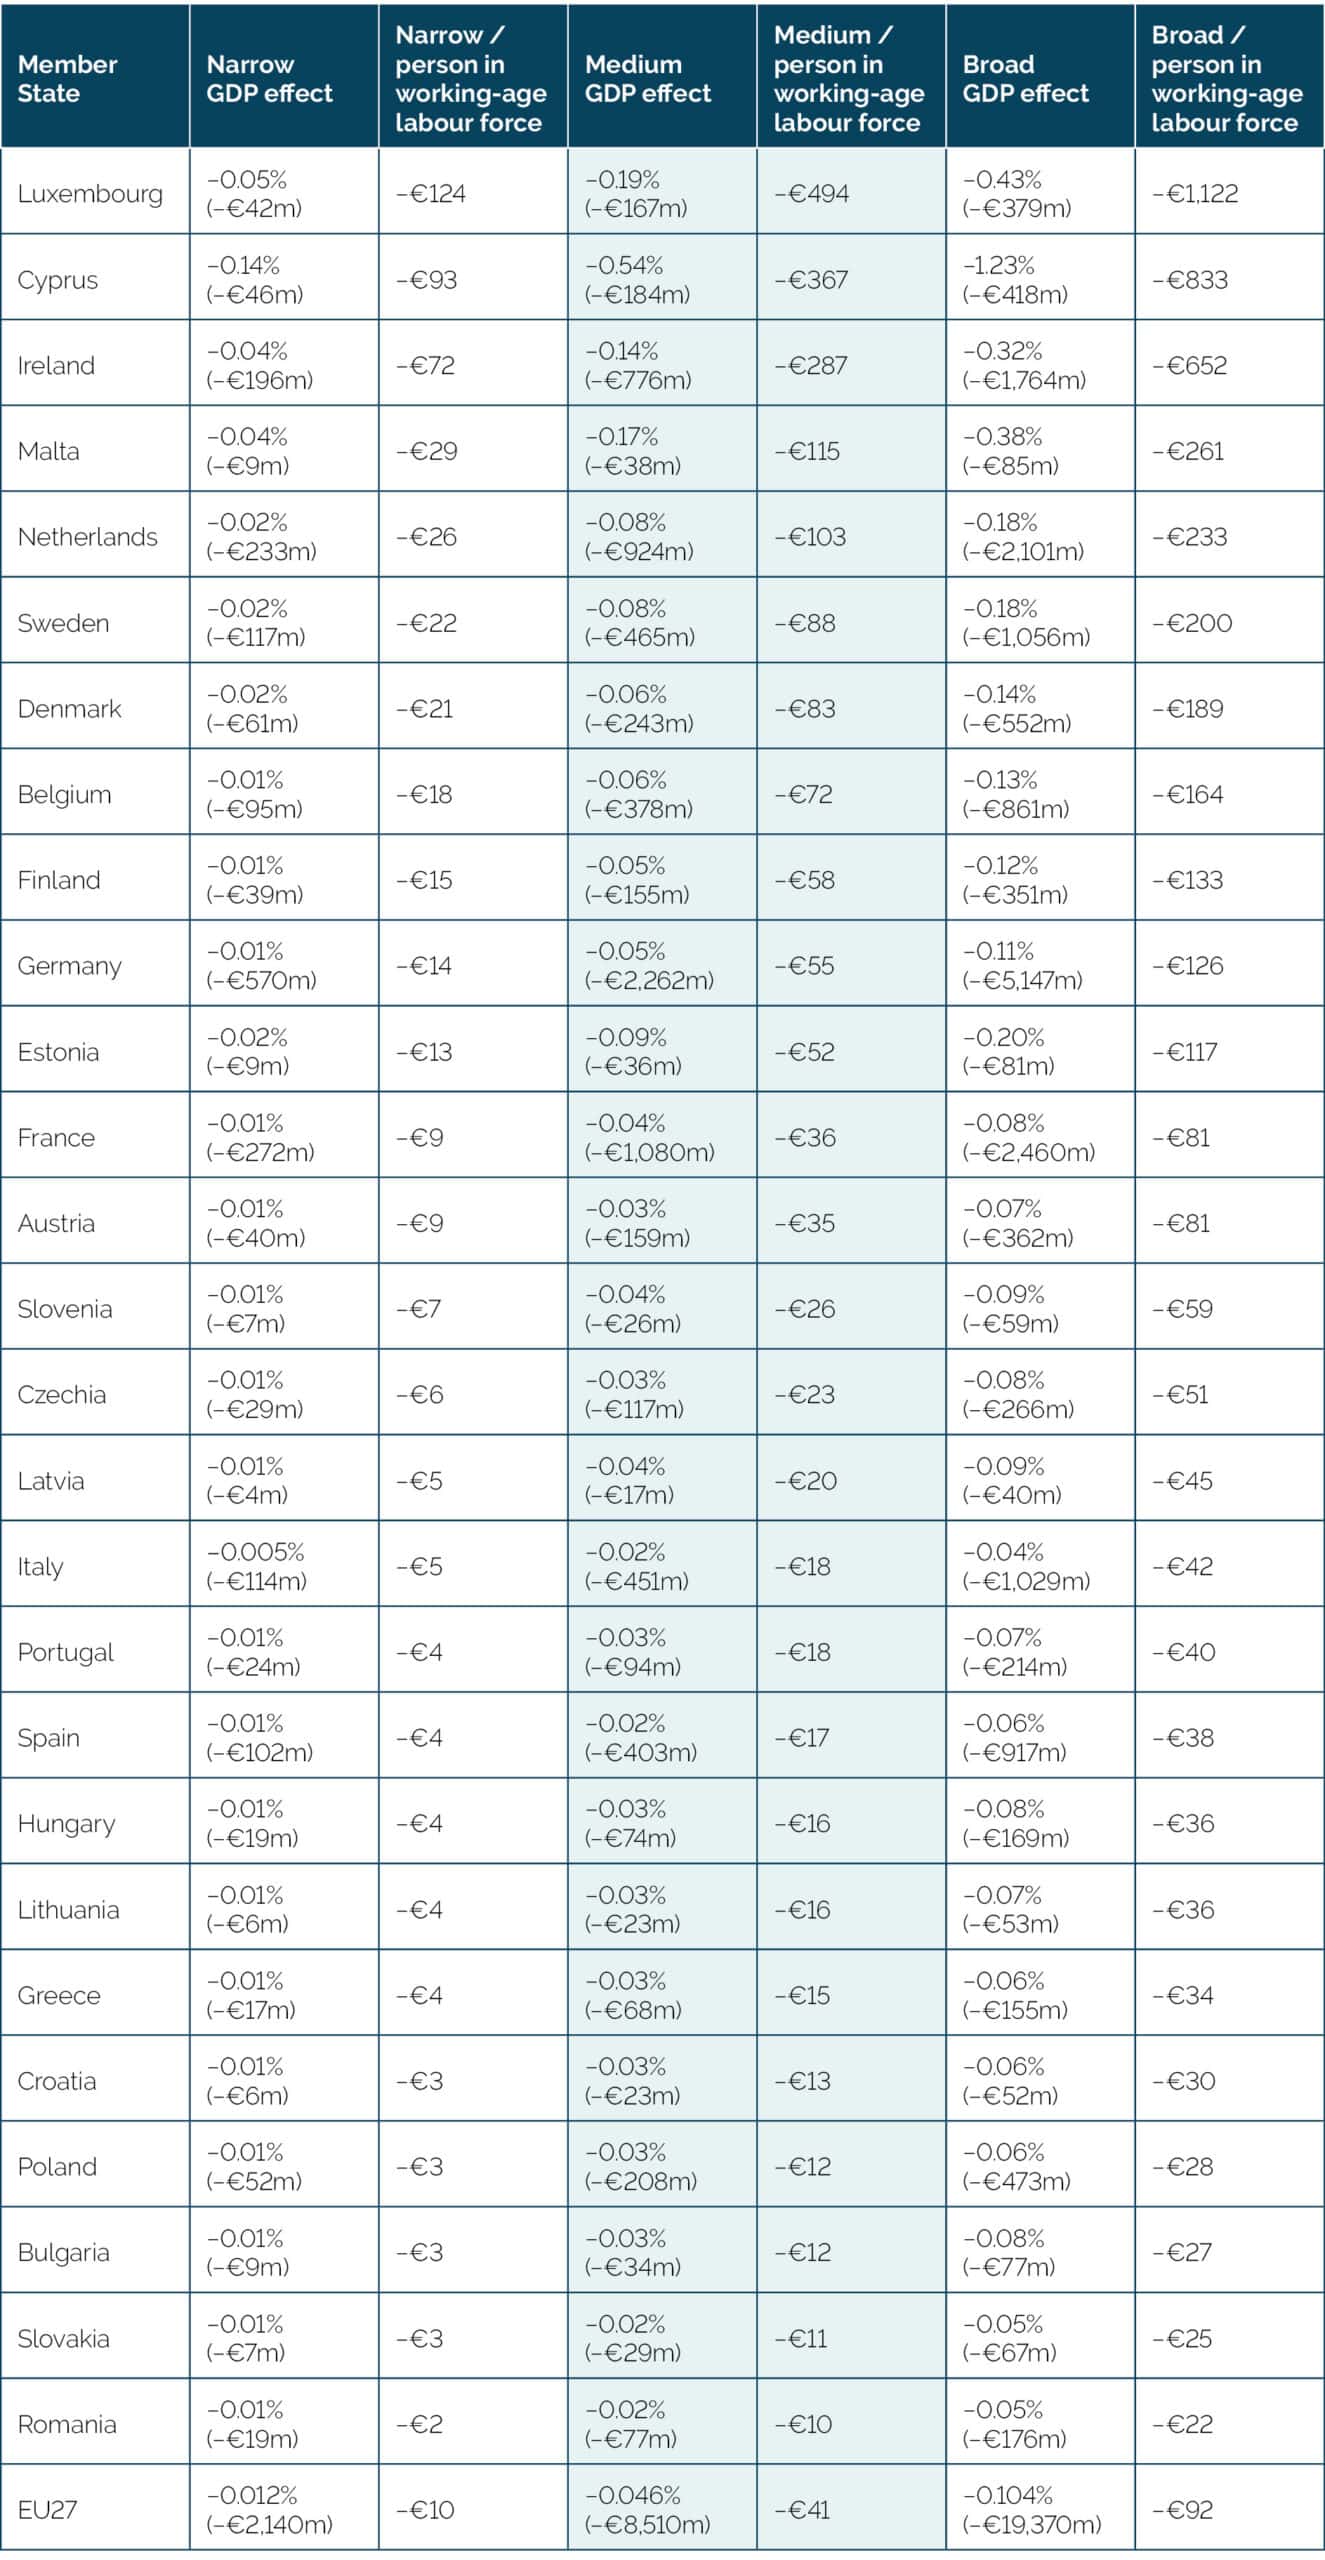 Source: ECIPE CGE calculations. Note: Percentage and absolute values show the change in the level of real GDP relative to the corresponding no-CADA baseline once the modelled adjustment has worked through the economy. Per-person values divide the absolute GDP effect by the 2025 resident labour force aged 20–64. Countries are ranked by the Medium-scenario GDP effect per person in the working-age labour force.
The sectoral results point to an important reallocation mechanism. Under the Broad scenario, output and exports in the communications and ICT-related sector increase in 26 of 27 Member States, while output falls across most of the other sectors examined. This is consistent with labour and capital being drawn towards the expansion of compliant communications capacity and away from other productive uses. The expansion of the communications sector therefore does not translate into a corresponding gain for the economy as a whole: the model instead records lower aggregate GDP. This opportunity cost is particularly relevant where skilled labour is scarce and investment resources face competing demands. These are level effects on real GDP once the modelled shocks have worked through the economy, not cumulative ten-year losses, and they should not be added to the bottom-up cost estimates.
Table 6 isolates the share of estimated exposure attributable to the public sector. Under the Medium scenario, public-sector exposure reaches €35.1 billion over the ten-year period, with the majority stemming from higher cloud expenditure and software migration and rewriting costs borne through public budgets.
For comparison with the economy-wide figures in Table 2, the projected ten-year public-budget components – higher public cloud bills and migration/rewriting costs, excluding postponed public-sector digitalisation – amount to approximately €17.3 billion, €33.3 billion and €39.6 billion under Narrow, Medium and Broad. On a fixed 2025 EU27 labour-force denominator, these correspond to approximately €82, €159 and €188 per person in the working-age labour force, respectively. They measure projected public-budget exposure, not identified future tax increases.
Table 6: Public-sector exposure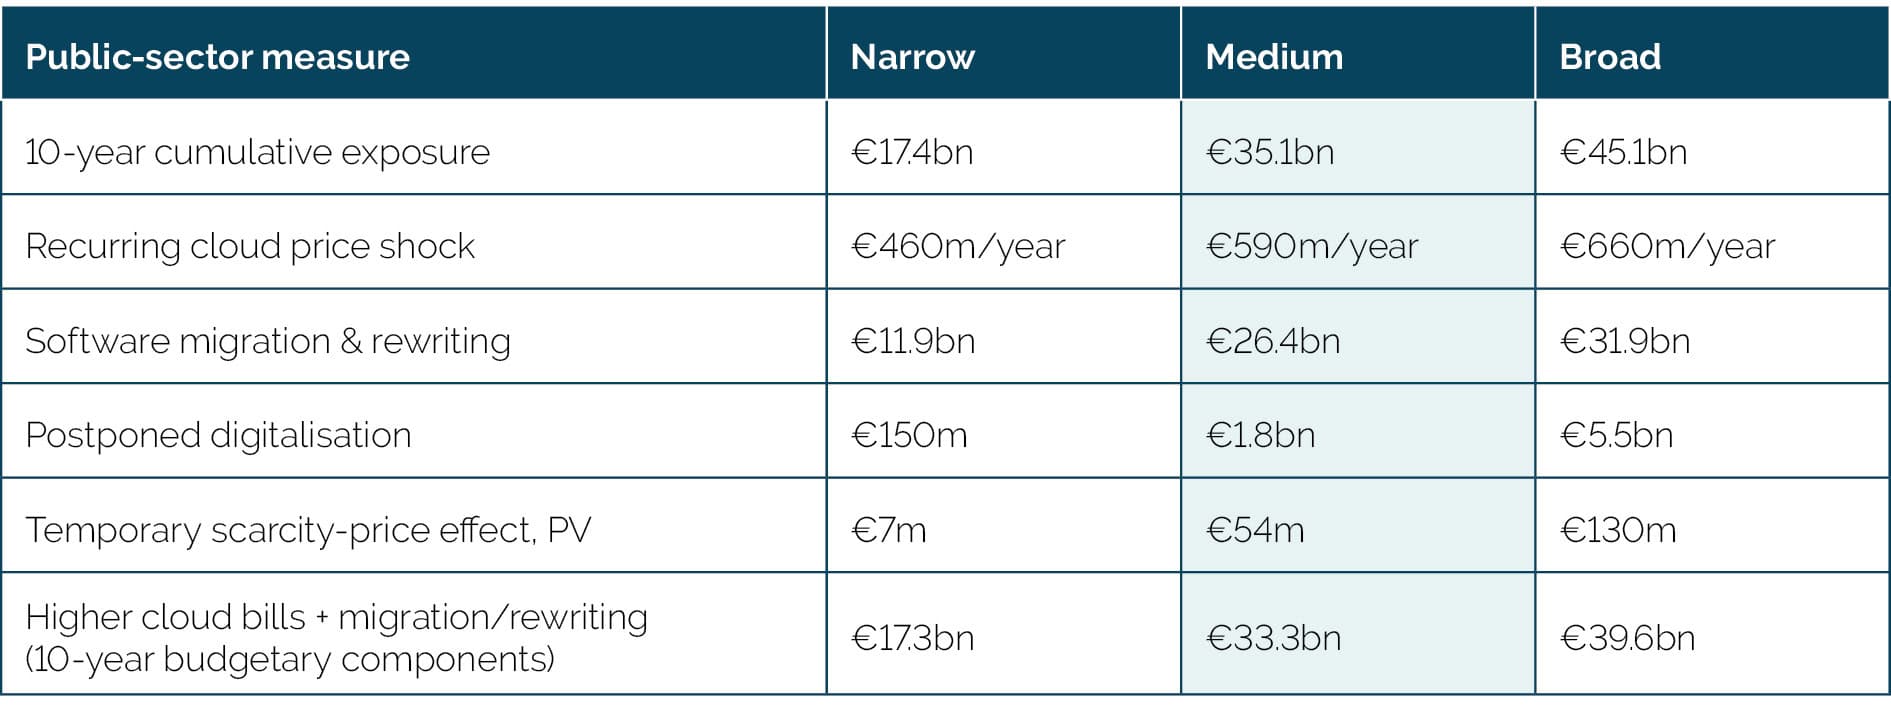 Source: ECIPE calculations. Note: Public-sector values include central, regional and local government and other public bodies. The government-level allocation is discussed later in the report. The allocation by government tier is an incidence estimate, not an observed cloud-spending dataset.
Table 7 presents the potential exposure of private-sector organisations affected through Article 31 enforcement. The estimates increase with the assumed coverage and restrictiveness of the requirements, with software migration and rewriting representing the largest component of private-sector adjustment costs.
Table 7: Potential private-sector exposure through Article 31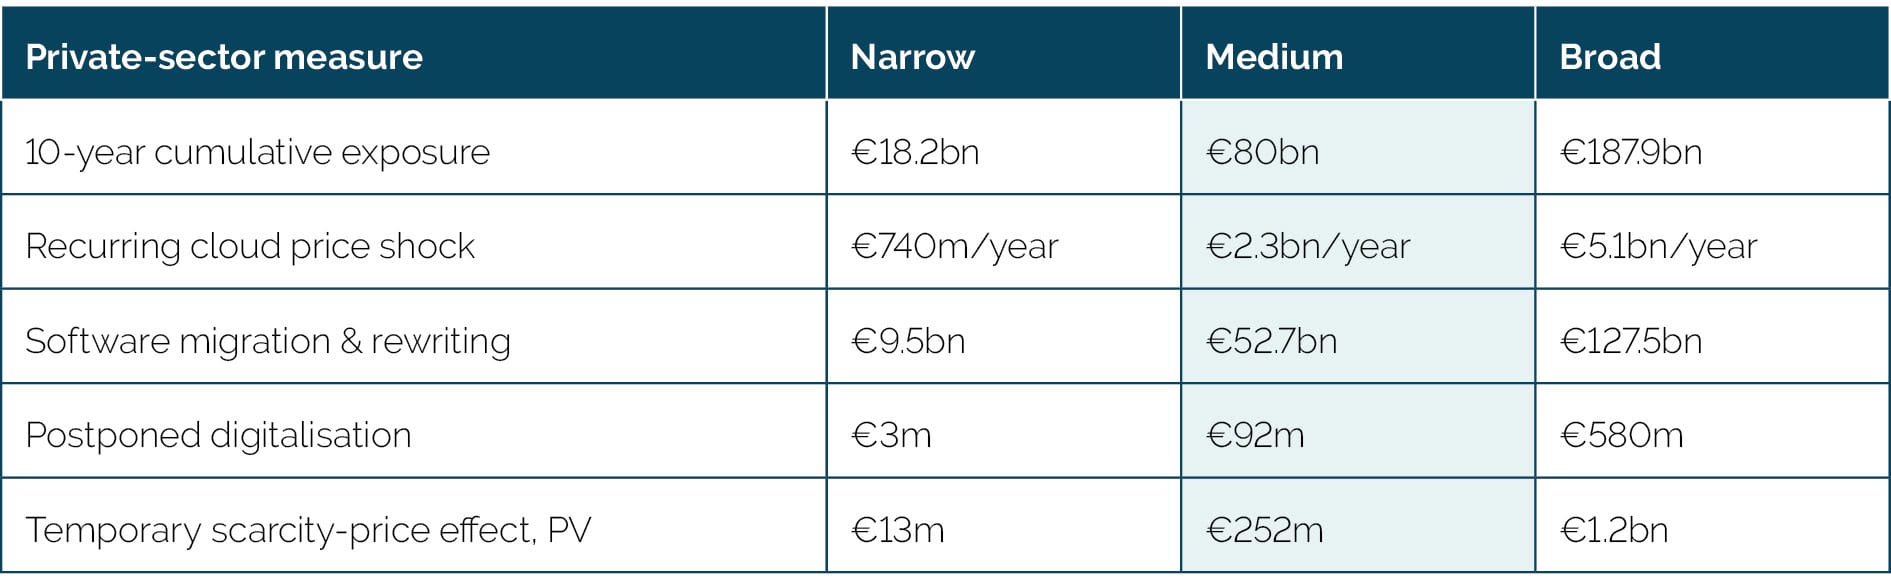 Source: ECIPE calculations. Note: These estimates are deliberately presented separately because Article 31 does not automatically apply CADA assurance requirements to all private organisations in NIS2 high-criticality sectors. The model uses scenario coverage of 10%, 25% and 50% under Narrow, Medium and Broad, respectively.[7]
Article 31 is economically important because it creates a route through which CADA-related requirements can extend beyond public procurement to private organisations operating in high-criticality NIS2 sectors, including energy, banking, transport and healthcare. The eventual scale of this channel will depend on how risk assessments and mitigation requirements are applied in practice.
The potential scale difference is substantial. Annual EU public-sector cloud expenditure is estimated at approximately €4.1 billion, whereas the potential private high-criticality cloud base used in the model is about €61 billion before Article 31 coverage is applied. Under the Medium scenario, applying the modelled requirements to 25 per cent of that private-sector base produces approximately €80 billion of cumulative private-sector exposure over 2027–2036, equivalent to around 70 per cent of the total Medium-scenario estimate.
Six Findings Stand Out
- Cloud migration and redesign is the largest component, because compliance would require organisations to change the technologies they currently use.
Under the Medium scenario, software migration and rewriting account for roughly 69 per cent of the €115 billion 10-year cumulative measure. The mechanism is straightforward: if existing cloud services, software or technology dependencies no longer meet the required assurance level, this can affect both non-EU providers and European companies that rely on those technologies, forcing organisations to move workloads, replace software components, rewrite applications or redesign parts of their IT architecture. These are often substantial one-off costs. Recurring cloud-price effects contribute about 30 per cent, reflecting the higher cost of compliant services where the pool of eligible suppliers is smaller. The public-sector component is about €35.1 billion. Of this, roughly €33 billion consists of higher cloud bills and migration and rewriting costs that fall on public budgets and are ultimately financed by taxpayers.
- Private-sector scope is what makes the scenarios diverge most sharply, because extending the requirements to more firms brings a much larger share of the economy into the adjustment.
The public-sector cumulative rises from €17.4 billion under Narrow to €45.1 billion under Broad. Potential private-sector exposure increases much more sharply, from €18.2 billion to €187.9 billion. This is because the broader scenarios assume that Article 31 reaches a larger share of private organisations in high-criticality sectors and that more of their workloads must meet higher assurance levels. As coverage expands, more firms may face higher cloud prices, migration costs and software redesign. Under Medium, private organisations in essential sectors account for about 70 per cent of the cumulative exposure. The legal and practical reach of Article 31 is therefore central to the overall economic scale of CADA and to the magnitude of any associated market spillovers.
- Higher assurance levels reach deep into the technology stack, because compliance concerns not only where data is stored, but also who controls the technologies on which cloud services are built.
CADA uses the NIS2 definition of cloud computing, which spans infrastructure, platforms, software and other remotely delivered services. At higher assurance levels, compliance may depend on provider ownership and control, subcontractors, software dependencies and the ability to control the future development of software. This means that using a compliant data centre alone would not be sufficient. Applications can depend on databases, identity services, cybersecurity tools, AI services and other software supplied by third parties. If these dependencies do not satisfy the relevant requirements, organisations would have to replace or redesign them as well.[8] [9]
- Expanding compliant cloud and AI capacity would draw scarce resources away from other parts of the economy, so sectoral expansion does not translate into higher overall output.
The CGE results illustrate an important opportunity-cost mechanism. Under the Broad scenario, communications-sector output and exports increase in 26 of 27 Member States, while output declines across most of the other sectors examined. The model therefore indicates that part of the expansion in qualifying communications capacity is achieved through a reallocation of labour and capital rather than through an equivalent increase in economy-wide productive capacity.
At EU27 level, real GDP is estimated to be approximately €2.1 billion (0.012 per cent) below the no-CADA baseline under Narrow, €8.5 billion (0.046 per cent) below under Medium and €19.4 billion (0.104 per cent) below under Broad. The magnitude of the effect depends on the availability of capital, skilled labour, certification capacity and alternative digital inputs, as well as on the speed with which qualifying supply can adjust.
- Europe will not experience one uniform CADA shock, because Member States differ in market size, cloud use, digitalisation and their existing regulatory starting points.
In absolute terms, the estimated 10-year cumulative economy-wide costs under the Medium scenario amount to around €16 billion in both France and Germany, followed by €12.8 billion in Italy and €12 billion in Spain. Under the Broad scenario, the corresponding costs rise to about €37.1 billion in Germany and €34 billion in France. For scale, the combined Medium-scenario exposure in Germany and France, at around €32.4 billion, is equivalent to roughly one-third of the entire €93.5 billion Horizon Europe research and innovation budget for 2021–2027.[10] Under the Broad scenario, their combined exposure of around €71 billion would be equivalent to roughly three-quarters of that seven-year programme budget. Horizon Europe is used here only as a benchmark of magnitude; the comparison does not imply that the two measures represent equivalent economic or budgetary concepts. Larger economies naturally have more cloud expenditure and more organisations potentially affected, but size is only part of the explanation. Countries also differ in their use of public cloud services, the number of private high-criticality entities, their level of digital maturity and the extent to which existing national rules already impose similar requirements. The incremental effect of CADA therefore varies considerably across Member States.
- Exposure in Europe’s own technology sector is not the same thing as lost output, because suppliers can adapt to the new requirements.
CADA would create additional demand for some qualifying European infrastructure and cloud providers while simultaneously increasing adjustment costs for other European cloud providers, software developers, systems integrators and managed-service providers that rely on global cloud infrastructure, software inputs or technology partnerships. The model identifies about 246 European technology vendors under Medium and about 561 under Broad whose activity is exposed to redesign or technology substitution. The associated €4.7 billion and €10.8 billion represent value added exposed to adjustment rather than expected output losses. The important distinction is that greater European activity at one layer of the technology stack can coexist with higher costs and narrower technology choices elsewhere in the European digital economy.
[1] European Commission (2026). Proposal for the Cloud and AI Development Act (CADA). Available at https://digital-strategy.ec.europa.eu/en/library/proposal-cloud-and-ai-development-act-cada
[2] European Commission. (2026). Impact assessment report accompanying the proposal for a regulation of the European Parliament and of the Council establishing a framework of measures for strengthening Europe’s cloud and AI ecosystem (Cloud and AI Development Act) (SWD(2026) 502 final). Available at: https://ec.europa.eu/transparency/documents-register/detail?ref=SWD(2026)502&lang=en; While the European Commission acknowledged substantial application-migration costs and developed application-level porting benchmarks, it incorporated only a limited subset of accelerated porting into its monetised assessment. Broader application re-architecting, software substitution and code-rewriting costs are not comprehensively captured – an important limitation given that system redesign represents a substantial cost driver.
[3] These are modelling scenarios rather than predictions of the final regulatory outcome. A separate Stress sensitivity, representing a still more restrictive implementation path, raises estimated exposure to around €327 billion. Private-sector exposure through Article 31 is reported separately because its scale depends particularly strongly on how extensively the provision is applied.
[4] These comparisons are intended to illustrate the scale of the estimated economic impacts of CADA. CADA figures are modelled economic or public-budget effects over 2027–2036, whereas the comparison figures are investment or programme-funding envelopes covering different periods and purposes. Horizon Europe has an indicative 2021–2027 budget of €93.5 billion. The European Commission states that the Chips Act should result in more than €43 billion of public investment. The 2026 AI Gigafactories initiative is supported by up to €10 billion in EU and national public funding and is expected to unlock at least €20 billion in private investment. European Commission (2026). Horizon Europe. Research and innovation funding programme until 2027. Available at https://research-and-innovation.ec.europa.eu/funding/funding-opportunities/funding-programmes-and-open-calls/horizon-europe_en; EU Chips Act. Available at https://digital-strategy.ec.europa.eu/en/factpages/chips-act; EU launches AI Gigafactories. Available at https://digital-strategy.ec.europa.eu/en/news/eu-launches-ai-gigafactories-call-boost-europes-computing-capacity-and-unlock-more-eu30-billion
[5] The denominator is the 2025 resident labour force aged 20–64. Under the Eurostat Labour Force Survey definition, the labour force comprises employed and unemployed persons. The report uses “person in the working-age labour force” as a more accessible description of this denominator; it should not be interpreted as a literal count of taxpayers.
[6] Under the Stress sensitivity, the estimated difference rises to approximately 0.146%, or €27.2 billion. These are level effects once the modelled adjustment has worked through the economy, not cumulative losses over the 2027–2036 period. They therefore measure a different economic concept from the bottom-up estimates of cumulative exposure and should not be added to them.
[7] This does not imply that private-sector workloads will necessarily be classified in exactly the same way as public-sector workloads. Rather, it provides a common benchmark for estimating how costs change as CADA requirements become progressively more restrictive.
[8] See NIS2 Directive, Article 6(30) and recital 33. CADA incorporates the NIS2 definition of a ‘cloud computing service’. Recital 33 of NIS2 specifies that computing resources include networks, servers and other infrastructure, operating systems, software, storage, applications and services, and expressly identifies IaaS, PaaS, SaaS and Network-as-a-Service (NaaS) as cloud service models. CADA recital 10 further clarifies that the definition encompasses on-demand access to remotely hosted AI systems.
[9] Annex II, in particular Sections 2.1(i)–(k), 3.1(g)–(k) and 4.1(i)–(k), and Annex III, Audit Criterion I. At UAL 2, providers must document a complete software bill of materials (SBOM) and relevant dependencies and implement controls relating to third-country software, including source-code audits and migration arrangements. UAL 3 adds restrictions concerning third-country control of the provider and relevant subcontractors. At UAL 4, providers must demonstrate effective control over software components or products, including by showing that a third country or third-country entity does not exercise effective control over their design, development, maintenance and evolution.
[10] European Commission (2026). Horizon Europe. Research and innovation funding programme until 2027. Available at https://research-and-innovation.ec.europa.eu/funding/funding-opportunities/funding-programmes-and-open-calls/horizon-europe_en
Research support was provided by Philipp Lamprecht, Director at ECIPE; Dyuti Pandya, Analyst at ECIPE; and Elena Sisto, Economist at ECIPE.
This ECIPE Occasional Paper is an independent report funded by the Computer and Communications Industry Association (CCIA Europe). The opinions offered herein are purely those of the author. They do not necessarily represent the views of CCIA Europe.
1. CADA Extends Well Beyond Government Cloud Procurement
CADA is designed to create a common EU approach to cloud sovereignty. Its economic significance comes from the interaction of two elements.
- First, it creates four Union Assurance Levels (UAL1–4) with progressively stronger requirements.
- Second, it provides a route through which similar risk assessments and mitigation measures can extend beyond public authorities to private organisations in high-criticality NIS2 sectors.
The European Commission proposal is the legal and policy starting point for the analysis.[1] For public authorities, the proposed framework would change both procurement and the continued use of existing cloud services.
- UAL1 already brings requirements on EU establishment and data location.
- UAL2 adds operating, personnel, certification and software-supply-chain conditions.
- UAL3 goes further by restricting third-country control of providers and relevant subcontractors.
- UAL4 adds stronger requirements for effective control over the design, development, maintenance and evolution of software.
Each escalation narrows the set of technical and commercial arrangements that can qualify. That is why the economic footprint extends beyond data centres. Cloud services include infrastructure, platforms, software, AI, and other remotely delivered computing resources. A public authority can contract with a European software supplier while the service still depends on a non-EU cloud platform, database, identity service, or AI tool. The nationality of the prime contractor therefore tells only part of the story; eligibility depends increasingly on the underlying technology stack.
1.1 Three Scenarios Reflecting Different Implementation Paths
This study does not attempt to predict a single future allocation of workloads. Instead, it uses three main implementation scenarios. They are regulatory scenarios, not statistical confidence intervals. The Narrow profile reproduces the Commission’s 70/20/9/1 allocation as a low-restriction benchmark. Medium is the central reference case. Broad is a higher-scope case in which UAL3–4 is used more frequently but UAL4 remains limited to 5 per cent. A separate Stress sensitivity uses a 30/35/25/10 profile to test a more restrictive implementation path.
Medium is the central reference case because it combines a moderate assurance-level distribution with partial private-sector coverage: 20 per cent of affected workloads are assigned to UAL3–4 and Article 31 is assumed to apply to 25 per cent of the potential private essential-sector base. It therefore serves as the study’s main benchmark for interpreting the economic effects of a meaningful, but not maximal, implementation of CADA.
Table 8: Scenario architecture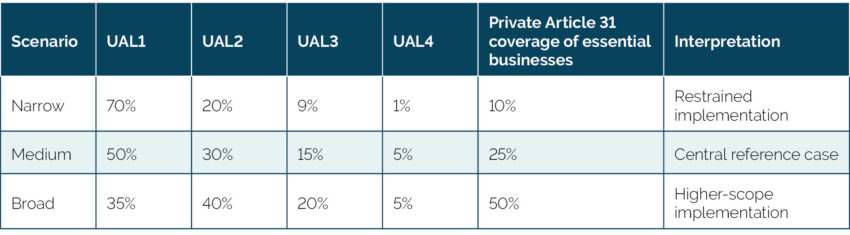 Source: ECIPE modelling assumptions.
The scenarios vary along two different dimensions. The UAL profile determines how demanding the rules become for workloads that are in scope. Article 31 coverage determines how much private-sector cloud activity enters the framework at all. Broadening either dimension increases exposure; broadening both at the same time is what drives the large difference between Narrow, Medium and Broad.
1.2 Coverage of Public Authorities and Essential Businesses
Public authorities are the direct starting point of the CADA assurance framework. The private-sector channel is more conditional. Article 31 concerns entities in NIS2 sectors of high criticality, including energy, transport, banking, financial-market infrastructure, health, drinking water, wastewater, digital infrastructure, ICT service management, public administration and space. The model therefore keeps public and private results separate throughout this report.[2]
That distinction is important for the assessment of economic impacts. Public-sector costs flow more directly from procurement rules and migration decisions. Private-sector exposure depends on how risk assessments, delegated acts and mitigation requirements are ultimately used, and how market pressures affect businesses’ operations.
[1] European Commission (2026). Proposal for the Cloud and AI Development Act (CADA). Available at https://digital-strategy.ec.europa.eu/en/library/proposal-cloud-and-ai-development-act-cada
[2] European Parliament and Council (2022), Directive (EU) 2022/2555 on measures for a high common level of cybersecurity across the Union (NIS2 Directive), Annex I, “Sectors of high criticality”. Annex I covers energy, transport, banking, financial market infrastructures, health, drinking water, wastewater, digital infrastructure, ICT service management, public administration and space. Available at https://eur-lex.europa.eu/eli/dir/2022/2555/oj/eng
2. Measuring the Economic Impacts
In this study, we adopt a counterfactual approach to assess the additional adjustment costs generated by CADA relative to the regulatory requirements and prevailing market conditions already in place in each Member State. This distinction is important because CADA would not be introduced into an institutional vacuum. France, Germany, Italy, Spain and other Member States already apply various cloud-security, localisation, qualification and sovereignty requirements to parts of their public sectors. The model therefore incorporates these existing national requirements into the baseline, ensuring that costs already incurred under current frameworks are not attributed to CADA as incremental effects.[1]
2.1 Cumulative Economic Exposure
In line with the impact assessment conducted by the European Commission, the study uses the 10-year cumulative quantified economic exposure as its main reference point. The measure is intentionally narrower than an all-in total and combines three channels that can be added with reasonable economic consistency:
- the present value of the recurring cloud price shock over 2027–2036;
- one-off software migration and rewriting costs; and
- the value of cloud and AI benefits postponed during the transition.
Other channels sit beside the central cumulative impact. Cloud spending exposed to shortages is a demand base, not a cost. Additional provider investment creates productive assets. Public support is a financing transfer whose effect depends on how it is funded. Technology-sector value added exposed to redesign measures activity touched by the adjustment.
2.2 From Public Procurement to a Public Cloud Base
The public expenditure base starts from EU public procurement records. The study uses cloud- and ICT-related contract awards in European public procurement records, averaging about €44.1 billion across 2024 and 2025. EU public procurement data do not capture all public ICT expenditure, including some below-threshold procurement, internal expenditure and spending outside the Tenders Electronic Daily (TED) system. The model therefore calibrates the filtered procurement values against the strongest independent country benchmarks identified for Spain and Italy.[2]
The resulting central modelling assumption is that the procurement records represent about 77 per cent of broader public ICT expenditure. This implies annual EU27 public ICT expenditure of about €57.3 billion. Applying a 7.2 per cent cloud-services share – covering cloud infrastructure, platform and software services – produces an estimated public-sector cloud base of about €4.1 billion per year.[3]
2.3 Constructing the Private-Sector Base
The potential private-sector base is constructed separately. The study uses approximately 40,800 private high-criticality entities as the central anchor and applies representative annual IT expenditure of €15 million per entity and a 10 per cent cloud share.[4] This produces a potential private cloud base of about €61.2 billion before Article 31 scenario coverage is applied. The entity and IT-spending assumptions are based on the Commission’s more recent NIS2 population evidence and ENISA investment data, but the national distribution remains less certain than the public procurement base.[5] [6]
2.4 Price Assumptions and National Baselines
The recurring price module applies a 10 per cent premium at UAL1, 15 per cent at UAL2, 30 per cent at UAL3 and 40 per cent at UAL4. These are total price differences for a workload at each assurance level, not cumulative additions. The calibration is anchored in observed sovereign-cloud offerings. For example, BCG reports premiums broadly in the 10–30 per cent range across major providers and products, while the French Cour des comptes estimates a 25-40 per cent operating-cost uplift for SecNumCloud-qualified infrastructure compared with traditional cloud hosting.[7] [8]
The gross price effect is then reduced where national rules already reproduce part of the relevant CADA constraint. As a result, two countries with similar cloud expenditure can face different incremental costs. CADA is a common framework, but it does not land on a common starting point.
Table 9: How the main channels are measured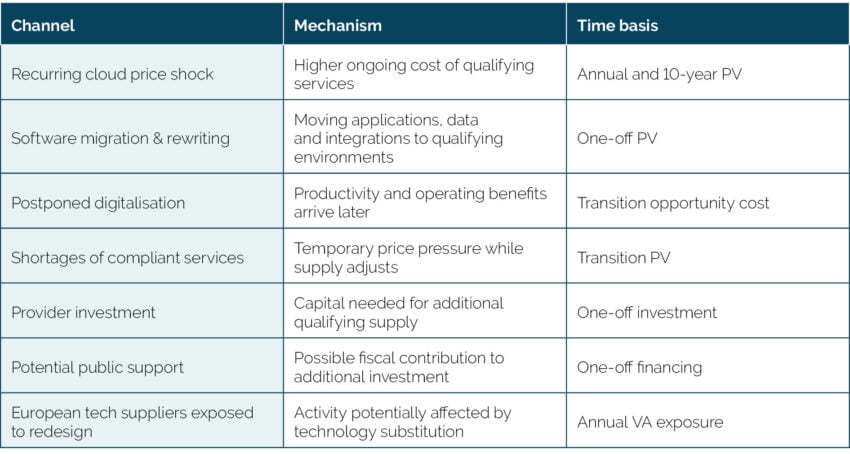 Source: ECIPE methodology.
2.5 Sensitivity Around the Public ICT Expenditure Base
The 77 per cent conversion factor deserves a visible sensitivity check because it determines the level of the public expenditure base. The estimation starts from approximately €44.1 billion in filtered ICT contract-award values and asks what share of broader public ICT expenditure those awards represent. A lower assumed capture rate therefore implies a larger underlying ICT market: if the observed awards represent only 67 per cent of total public ICT expenditure, the implied EU27 public ICT base rises to about €65.9 billion and, applying the same 7.2 per cent cloud share, the public cloud base rises to about €4.7 billion. Conversely, if the awards represent 87 per cent of total expenditure, the implied ICT base falls to about €50.7 billion and the cloud base to about €3.65 billion. The central 77 per cent assumption lies between these cases at €57.3 billion of public ICT expenditure and €4.1 billion of public cloud expenditure.[9]
[1] Examples include France’s SecNumCloud qualification framework, Germany’s BSI C5 requirements and related public-sector cloud-security frameworks, as well as national localisation, certification and sovereignty requirements applied to particular categories of public-sector data and workloads in other Member States. The study accounts for these pre-existing national requirements when defining the country-specific baseline. A comprehensive description of the regulatory mapping, assumptions and country-level treatment is provided in the Technical Annex, which is published separately.
[2] EU tenders electronic daily (2026). Query data from August 25, 2026. Available at https://ted.europa.eu/en/
[3] The 77% factor is a conversion assumption, not a statement that every country reports exactly 77% of its ICT spending through TED. That distinction is especially important for countries with incomplete monetary fields in procurement notices. For Spain, see Computing.es (2026). La Administración Pública invertirá más 6.000 millones de euros en TIC en 2026. Available at https://www.computing.es/noticias/la-administracion-publica-invertira-seis-millones-de-euros-en-tic-en-2026/; for Italy, see AgID (2024). La Spesa ICT Nella PA Italiana . Available at https://www.agid.gov.it/sites/agid/files/2025-05/Rapporto_La_spesa_ICT_nella_PA_2024.pdf. The 77% TED-to-total-ICT factor is a calibration assumption derived principally from these independent benchmarks; it should not be conflated with TED monetary-field completeness within the selected notice sample. As a sensitivity, a 67% capture ratio would imply an EU27 public-cloud base of approximately €4.74 billion, while an 87% capture ratio would imply approximately €3.65 billion, compared with €4.13 billion in the central case. Lower value-reporting coverage in Germany therefore does not by itself imply that the common 77% calibration should be replaced by a country-specific factor.
[4] The 10% cloud share is a central modelling assumption rather than an observed EU-wide expenditure ratio. No harmonised EU-wide data are available on the share of IT expenditure devoted specifically to cloud services by NIS2 high-criticality entities. The assumption is intended to provide a restrained benchmark across a heterogeneous group of sectors with differing levels of cloud adoption and continued reliance on legacy and on-premises systems. For the more digitally intensive NIS2 sectors, including banking, digital infrastructure and ICT service management, the actual cloud share could be materially higher.
[5] European Commission (2026). Commission Staff Working Document Impact Assessment Report Accompanying the documents Proposal for a Regulation of the European Parliament and of the Council on the European Union Agency for Cybersecurity (ENISA), European cybersecurity certification framework, and ICT supply chain security and repealing Regulation (EU) 2019/881 (The Cybersecurity Act 2) And Proposal for a Directive of the European Parliament and of the Council amending Directive (EU) 2022/2555 as regards simplification measures and alignment with the [Proposal for the Cybersecurity Act 2]. Available at https://eur-lex.europa.eu/legal-content/EN/TXT/?uri=celex:52026SC0011; European Commission. (2026). Impact assessment report accompanying the proposal for a regulation of the European Parliament and of the Council establishing a framework of measures for strengthening Europe’s cloud and AI ecosystem (Cloud and AI Development Act) (SWD(2026) 502 final). Available at: https://ec.europa.eu/transparency/documents-register/detail?ref=SWD(2026)502&lang=en
[6] ENISA (2025). NIS Investments (2025). Available at https://www.enisa.europa.eu/sites/default/files/2025-12/NIS%20Investments%202025%20-%20Survey%20data%20companion%20document_0.pdf ; ENISA (2024). NIS Investments 2024. Available at https://www.enisa.europa.eu/sites/default/files/2024-11/CSPA%20-%20NIS%20Investments%20-%202024_0.pdf .
[7] BCG (2025). Cloud Cover: Price Swings, Sovereignty Demands, and Wasted Resources. Available at https://www.bcg.com/publications/2025/cloud-cover-price-sovereignty-demands-waste
[8] Cour des comptes. (2025). Les enjeux de souveraineté des systèmes d’information civils de l’État: Observations définitives (Article R. 143-11 du code des juridictions financières)..Available at https://www.ccomptes.fr/sites/default/files/2025-10/20251031-S2025-1479-Enjeux-souverainete-des-SI-civils-de-l-Etat.pdf
[9] The sensitivity concerns the assumed coverage of the observed procurement data, not the share of ICT spending devoted to cloud. The €44.1 billion procurement base is held constant: a lower capture ratio means that this observed amount represents a smaller proportion of the underlying ICT market and therefore implies a larger total expenditure base. The 7.2% cloud share is then applied consistently to each resulting ICT estimate.
3. EU27 Economic Impacts: Policy Implementation Choices Drive Fiscal and Economic Costs
The study’s central measure of cumulative economic exposure – combining higher recurring cloud costs, one-off migration and software-rewriting costs, and the economic value of postponed digitalisation across the public and affected private sectors over 2027–2036 – amounts to €35.6 billion under Narrow, €115 billion under Medium and €233 billion under Broad. These figures can be understood as the study’s estimated overall economic price tag for the EU27 under each scenario, but not as a single bill paid by the government: the burden is distributed across public budgets, affected businesses and, in the case of delayed digitalisation, forgone economic benefits.
The numbers increase because the scenarios change how often higher assurance levels are used and how much private high-critical activity is brought within the framework. Medium is the central reference case. Its €115 billion cumulative estimate consists of €34 billion in recurring price effects over the ten-year period, €79.1 billion in migration and rewriting costs, and €1.9 billion in postponed digitalisation. Put differently, migration accounts for about 69 per cent of the cumulative impact, recurring price effects about 30 per cent, and delayed benefits about 2 per cent. The composition is as important as the total because the three channels have very different timing and incidence.
Table 10: Composition of the 10-year cumulative exposure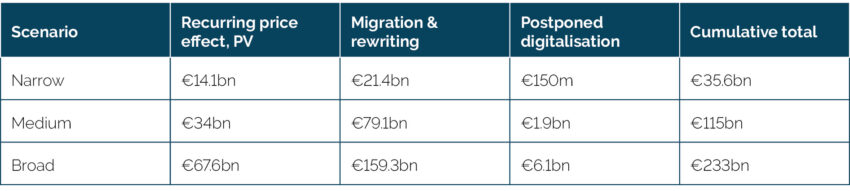 Source: ECIPE calculations.
The public/private composition shifts even more sharply. Under Narrow, the cumulative impact is almost evenly divided. Under Medium, potential private exposure accounts for about 70 per cent of the total; under Broad, about 81 per cent. Public exposure grows mainly because the assurance profile becomes more demanding. Private essential business exposure grows for that reason and because Article 31 coverage rises from 10 per cent to 25 per cent and 50 per cent across the scenarios.[1]
[1] The three main scenarios are complemented by a Stress sensitivity using a 30/35/25/10 UAL profile and 50% Article 31 coverage. In this case, 35% of affected workloads fall into UAL3–4 and 10% into UAL4. The 10-year cumulative exposure rises to about €327.1 billion. The sensitivity illustrates the economic consequence of a substantially more restrictive implementation path; it is not treated as a fourth central scenario.
4. The Recurring Cloud-Price Effect
The annual recurring cost channel is the most conventional part of the exercise. It captures the higher ongoing cost of cloud services that must satisfy stronger requirements on establishment, location, personnel, certification, ownership and software control. Unlike migration, it persists after the transition is complete.
On the 2025 expenditure base, the combined annual effect is about €1.2 billion under Narrow, €2.9 billion under Medium and €5.8 billion under Broad. With real cloud spending growing by 5 per cent a year and future effects discounted at 3 per cent, the 2027–2036 recurring cost present values are €14.1 billion, €34 billion and €67.6 billion.
The composition again matters. The figures in Table 10 combine public-sector and affected private-sector recurring cloud-price effects. In the Medium scenario, roughly €590 million a year falls on the public sector and €2.3 billion on businesses in essential sectors. Under Broad, the essential-business component exceeds €5.1 billion while the public-sector component remains around €660 million. The difference is driven primarily by the much larger potential private-sector cloud base and the wider assumed Article 31 coverage in the higher scenarios.
Table 11: Selected Member State annual recurring cloud-price effects, public and affected private sectors combined (€ million/year)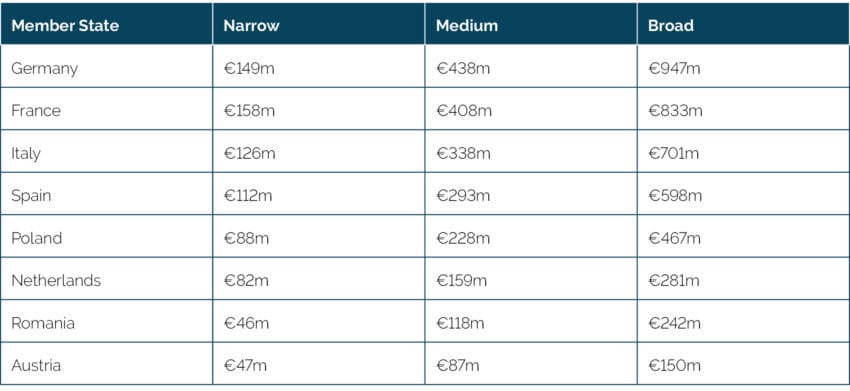 Source: ECIPE calculations. Note: Figures combine the estimated recurring price effect for public-sector cloud expenditure with the scenario-dependent effect for private high-criticality entities potentially covered through Article 31. Private-sector coverage is assumed at 10% under Narrow, 25% under Medium and 50% under Broad.
Selected Member States are shown to illustrate scale; complete EU27 results are provided in the Technical Annex.
The model does not attempt to estimate the cost of every individual compliance requirement separately. Instead, it translates three main mechanisms through which higher assurance requirements can increase the cost of supplying cloud services into a single price uplift for each assurance level. First, higher assurance can require dedicated infrastructure, screened personnel, additional auditing, certification and EU-specific operating arrangements. Second, restrictions on third-country control can narrow the set of eligible providers and make global operating models harder to use. Third, requirements relating to software dependencies and control can require suppliers to maintain separate technology stacks or replace individual components.
The percentages should therefore be read as service-level uplifts, not as claims that every provider raises list prices by the same amount. Real procurement prices depend on contract size, usage profiles, discounts, available substitutes and the share of compliance costs absorbed by suppliers.[1]
[1] ECIPE (2026, forthcoming). Cloud Pricing, Competition and Customer Choice in Europe’s Emerging Cloud Regulatory Framework – How cloud pricing works in practice, and what it means for the cloud debate.
5. Cloud Migration and System Redesign: The Largest Transition Cost
The central cumulative cost estimate is dominated by cloud migration and system redesign because moving cloud workloads is rarely a matter of copying data from one server to another. Applications can require new APIs, database changes, identity and access-management work, cybersecurity reconfiguration, testing, user retraining and parallel operation.[1] With PaaS and SaaS, the customer can be replacing functionality and business processes as well as infrastructure. The more integrated the service, the more quickly migration turns into redesign.
The modelling deliberately limits this channel to applications already assumed to be in the cloud. Ordinary future legacy-to-cloud modernisation is not counted as a CADA cost. Migration and redesign are treated as a one-off transition burden concentrated around 2030–2032.
At the EU27 level, the estimated exposure amounts to €21.4 billion under the Narrow scenario, €79.1 billion under the Medium scenario and €159.3 billion under the Broad scenario. Under the Medium scenario, approximately €26.4 billion is attributable to the public sector and €52.7 billion to the private sector. The private-sector estimate is subject to greater uncertainty, reflecting the absence of a harmonised EU-wide inventory of private-sector application estates comparable to the Commission’s public-sector benchmark. Nevertheless, the magnitude of the estimate is economically significant: where compliance requires substantial application rewriting and migration, transition-related adjustment costs would materially exceed the recurring annual price effects.
Table 12: Selected Member State migration and rewriting costs, public and affected private sectors combined (€ billion, PV)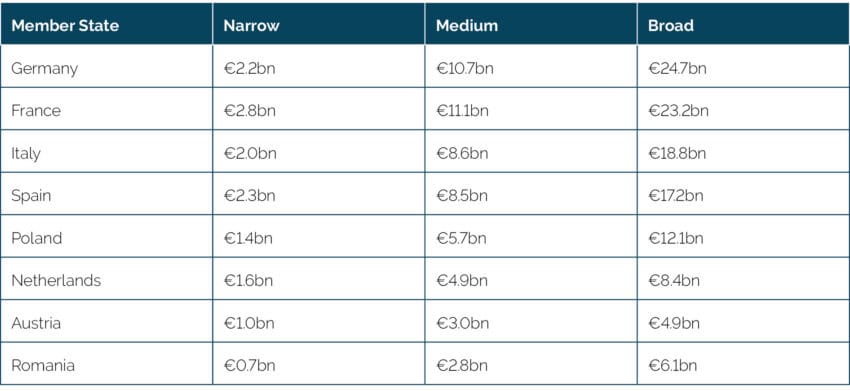 Source: ECIPE calculations. Note: Figures combine public-sector migration and rewriting costs with scenario-dependent private-sector costs for high-criticality entities potentially affected through Article 31.
The European Commission proposal gives public authorities a limited transition period where a risk assessment requires migration. The study distinguishes relatively portable workloads from complex systems and large portfolios, because the operational effort differs sharply. The infrastructure side can be slower still: permitting, grid connection and service development can take several years in major European markets.[2] [3] This is the link between migration and temporary scarcity. A qualifying market can be viable in the long run and still be tight during the transition. Capacity, software, certification and specialist staff do not appear at the moment a legal requirement takes effect. When demand moves faster than supply, part of the adjustment would show up in prices and delays before the market settles.
[1] An Application Programming Interface (API) is a structured set of rules and protocols that allows different software applications or services to communicate, exchange data and use each other’s functions.
[2] According to the proposal, where a public-sector risk assessment requires migration to another cloud service, the transition period must be reasonable but may not exceed 12 months, taking into account technical feasibility, continuity of service and data portability.
[3] Evidence covering 12 Member States indicates average overall permitting timelines of around 32 months, including zoning, construction permits, environmental procedures, utilities and grid connection. The European Commission also reports standard grid-connection periods of two to four years in Italy and up to seven years in Frankfurt.
6. Compliant Supply: Capacity, Investment and Temporary Price Pressures
Higher assurance levels redirect demand towards a narrower set of services. The study separates three questions:
- how much spending is exposed to UAL3–4;
- how much additional investment is needed to expand qualifying supply; and
- how much temporary price pressure arises while that supply is still catching up. They are related, but they are not the same economic object.
Table 13 summarises the resulting supply-side and transition indicators across the three scenarios. The estimates should be interpreted as distinct but related dimensions of the adjustment process rather than as additive components of a single cost measure. Exposed expenditure indicates the scale of demand potentially subject to higher assurance requirements; provider investment captures the additional capital required to expand qualifying supply; and the scarcity-price effect reflects temporary price pressures during the period in which supply adjusts to the resulting shift in demand.
Table 13: Qualifying-supply and transition indicators based on combined public and affected private-sector demand
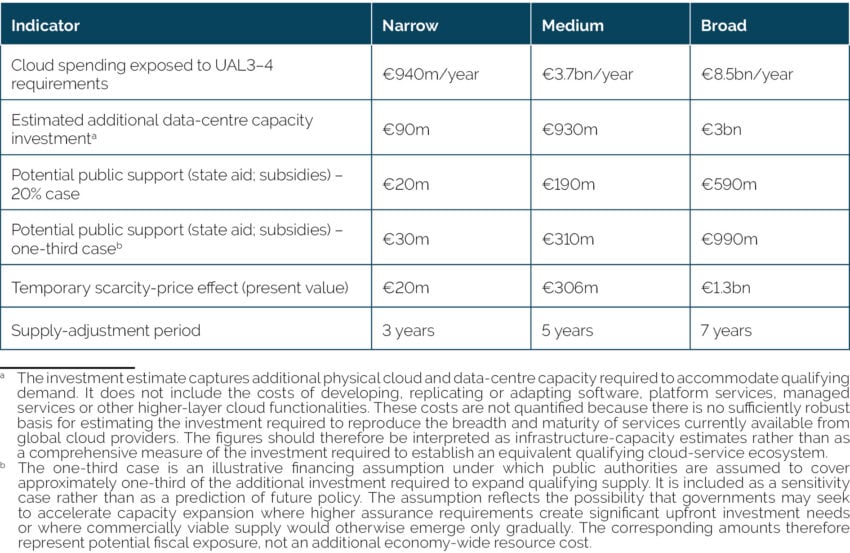
Source: ECIPE calculations. Note: The underlying demand estimates combine public-sector cloud expenditure with scenario-dependent private-sector exposure through Article 31. The investment and scarcity estimates therefore reflect the supply response to this combined demand, while the public-support rows show only the potential fiscal contribution towards that investment.
The distinction is economically important because physical infrastructure represents only one component of cloud supply. Much of the functionality used by customers is embedded in databases, cybersecurity tools, analytics, AI services, developer environments, platform services and managed-service capabilities. Reproducing or substituting these functionalities can require substantial and sustained investment in software development, engineering expertise and intellectual property. The investment estimates reported here therefore capture the physical-capacity component of the supply-side adjustment and should not be interpreted as the total investment required to reproduce equivalent cloud functionality.
UAL3-4 expenditure measures the combined public and affected private-sector cloud demand that could require the strongest qualifying services. It is a measure of demand exposure rather than an additional cost and is therefore not added to the central cumulative estimate. Nor does all exposed demand require new physical capacity. Existing qualifying services, already-installed provider capacity, planned market expansion, higher utilisation, expansion of existing sites, colocation and cross-border provision can absorb part of the shift in demand.
The model therefore attributes only a residual share of UAL3-4 demand to genuinely additional CADA-related capacity investment. This share is set at 10 per cent under Narrow, 25 per cent under Medium and 35 per cent under Broad. These are evidence-informed scenario calibrations rather than observed market shares. They reflect two offsetting features of the European market: available capacity is currently tight, limiting the amount of additional demand that can be absorbed immediately, while substantial capacity expansion is already under way and should not be attributed to CADA. The assumed investment-requiring share consequently rises across the scenarios as the volume of demand subject to higher assurance requirements increases and the scope for the existing and already-planned supply base to absorb that shift becomes progressively smaller.[1]
That investment is not itself treated as a welfare loss because it creates productive assets. The separate fiscal module instead asks how much public support could be required if grants, tax incentives or similar financing were used to accelerate qualifying capacity. The central case uses an illustrative public-support rate of 20 per cent of additional investment, representing ordinary investment support rather than an empirically estimated subsidy rate. A separate one-third sensitivity examines a case in which larger public financing or risk-sharing is required; this higher benchmark is informed by the financing structure of the Commission’s AI Gigafactory initiative.[2]
6.1 Temporary Scarcity Is a Transition Effect
The scarcity calculation proceeds in two steps. First, the model identifies the amount of cloud expenditure subject to UAL3–4 requirements: approximately €0.94 billion under Narrow, €3.7 billion under Medium and €8.5 billion under Broad. Second, it assumes that only part of this UAL3–4 demand actually encounters a temporary shortage of qualifying services. This shortage-affected share is set at 10 per cent under Narrow, 25 per cent under Medium and 35 per cent under Broad. An initial 10 per cent scarcity premium is then applied only to that subset of expenditure. The premium declines linearly to zero over three, five and seven years, respectively, as qualifying supply expands. For example, under Narrow, the 10 per cent premium initially applies to around €94 million of the €940 million in UAL3–4-exposed annual cloud expenditure, rather than to the entire cloud market.
This produces relatively small costs compared with migration: about €20 million PV under the Narrow scenario, €306 million under the Medium scenario and €1.3 billion under the Broad scenario. The assumption is consistent with market evidence that constrained European data-centre capacity can produce price pressure, but the module is intentionally kept separate from the recurring sovereignty-related price mark-up so the same effect is not counted twice.[3]
6.2 Existing Commercial Discounts Can Be Part of the Transition Too
Large cloud customers rarely pay a simple public list price for every service. Multi-year commitments, enterprise agreements and negotiated pricing can reduce effective rates materially. If a customer has to move quickly from one environment to another, it can lose part of those discounts even when the replacement service has a similar headline list price. Because enterprise contract terms are highly heterogeneous, discount erosion is treated as a sensitivity rather than a central cost.
The distinctions matter because the three price mechanisms answer different questions. The recurring cloud-price effect is structural. Temporary scarcity is a short-run market effect while supply adjusts. Lost commitment or negotiated discounts are contract-specific and sit somewhere in between. The central estimate keeps them separate rather than building every plausible source of price pressure into one number.
6.3 Software, Not Servers, Can Become the Binding Constraint
Physical data-centre capacity is only one layer of the adjustment. CADA applies across the cloud-service stack. A customer can have access to compliant compute capacity and still lack an equivalent qualifying database, analytics service, cybersecurity product, AI tool, platform service or SaaS application. At higher assurance levels, software dependencies and control over the evolution of the product can therefore determine whether a service qualifies at all.[4]
Capacity should therefore be understood as a lower-level supply indicator. Cloud infrastructure and software functionality are increasingly integrated: databases, analytics, cybersecurity, AI tools, developer environments and managed services are often embedded within broader cloud architectures rather than consumed as entirely separate products. Loss of access to particular services can therefore have consequences well beyond the replacement of compute capacity.
Organisations may need to identify substitutes, redesign applications, rebuild integrations, modify workflows and retrain users, while in some cases accepting lower functionality or performance where equivalent qualifying alternatives are not yet available. These adjustments can be very costly and time-consuming even after the initial migration itself has been completed. The challenge is also dynamic. During the period required to develop, certify and scale alternative services, providers outside the EU may continue to invest in new functionality and improve existing products.
6.4 Higher Assurance Requirements Can Increase Intra-EU dependence
Regulated demand and qualifying supply do not have to be located in the same Member State. A public authority in Germany, for example, may rely on a qualifying service operated from another EU country, while smaller Member States may depend increasingly on capacity located in Europe’s larger cloud and data-centre markets.
This matters because European-controlled cloud capability based on CADA’s criteria is not evenly distributed across the EU. A significant share of existing capacity and service provision is concentrated in a relatively small number of providers and national markets, predominantly France and Germany. Smaller Member States possess near-zero domestic UAL3/UAL4 capacity, creating an immediate cross-border supply squeeze.
As demand for higher-assurance services increases, some Member States may therefore have no practical alternative but to import capacity at premium rates; effectively transferring public and private resources to dominant regional providers while stalling local digital innovation. CADA may reduce certain forms of third-country dependence while at the same time increasing cross-border dependence within the Single Market.
The same pattern can arise within the technology stack itself. A domestic prime contractor may meet the customer-facing procurement requirement while relying on infrastructure, software or managed services supplied from another Member State. Dependence can therefore shift across borders and between different layers of the supply chain rather than disappear altogether. National procurement statistics alone typically do not capture these underlying dependencies.
[1] The 10%, 25% and 35% shares are calibration assumptions rather than empirical estimates of the proportion of UAL3–4 demand that would necessarily require new data-centre construction. They are informed by evidence of both limited near-term spare capacity and substantial baseline market expansion. JLL reports FLAP-D colocation vacancy of 6.4% in Q2 2026, including 3.1% in Frankfurt, alongside 3.8 GW of live capacity and approximately 453 MW of additional deliveries expected in 2026. CBRE similarly reports historically low European vacancy while expecting more than 750 MW of additional capacity during 2026. At the same time, Gartner forecasts European sovereign-cloud IaaS expenditure to rise from approximately $6.9 billion in 2025 to $12.6 billion in 2026 and $23.1 billion in 2027, indicating rapid expected growth in the European sovereign-cloud market independently of CADA. The model therefore allows the majority of exposed demand to be accommodated through existing or already-planned supply while attributing a progressively larger residual to additional investment as the scale of qualifying demand increases.
[2] European Commission (2026). EU launches AI Gigafactories call to boost Europe’s computing capacity and unlock more than €30 billion in investment, 30 July 2026. The 20% central case is a modelling assumption intended to represent a moderate level of ordinary investment support through grants, tax incentives or economically equivalent measures; it should not be interpreted as an observed average subsidy rate for European data-centre investment. The one-third case is separately anchored in the Commission’s 2026 AI Gigafactory financing envelope, under which up to €10 billion in EU and national public funding is intended to mobilise at least €20 billion in private investment. It is used as an illustrative financing-constrained sensitivity rather than as a forecast of CADA-related public support. Actual support rates would depend on the financing instrument, project economics and Member State policy. Available at https://digital-strategy.ec.europa.eu/en/news/eu-launches-ai-gigafactories-call-boost-europes-computing-capacity-and-unlock-more-eu30-billion
[3] CBRE (2025). European Real Estate Market Outlook 2025. Available at https://www.cbre.com/insights/books/european-real-estate-market-outlook-2025/data-centres. Note: The scarcity-price assumption is deliberately conservative in modelling terms. First, the initial 10% premium is applied only to the scenario-specific share of UAL3–4 expenditure assumed to encounter a temporary supply constraint – 10% under Narrow, 25% under Medium and 35% under Broad – rather than to all affected cloud expenditure. Second, the premium is assumed to decline progressively to zero as qualifying supply expands, rather than persisting throughout the assessment period. Third, it is applied to the underlying expenditure base and is not compounded with the separate recurring sovereignty-related price premium. Market evidence provides some support for the order of magnitude: CBRE reports that prices for constrained European colocation capacity could rise by 10% or more in markets such as Frankfurt and London, while JLL projects continued increases in EMEA data-centre lease rates. These infrastructure-price observations cannot be mapped directly onto retail cloud-service prices, however, because providers may absorb part of the increase and physical infrastructure represents only one component of cloud-service costs. The 10% figure should therefore be interpreted as a cautious central calibration rather than a forecast of the actual transition premium.
[4] CADA applies to cloud computing services across the service stack, including SaaS and PaaS. A European SaaS provider may itself depend on non-EU-controlled infrastructure, databases, identity services, AI services or other components, and higher assurance levels would therefore affect both the SaaS provider and its underlying technology dependencies. Qualifying physical infrastructure is therefore necessary but not sufficient: an equivalent qualifying software or managed service must also be available. At UAL 3, provider and subcontractor control requirements may require substitution of underlying suppliers, while UAL 4 can extend the constraint to control over software design, development, maintenance and evolution.
7. Delayed Digitalisation Creates Economic Opportunity Costs
CADA-related constraints need not cause planned cloud or AI projects to be abandoned permanently. Where a suitable qualifying service is temporarily unavailable, organisations may instead postpone implementation until an appropriate alternative becomes available or the relevant service can meet the required assurance level. The economic effect is therefore primarily one of timing: productivity improvements, operating efficiencies and service-quality gains that would otherwise have been realised earlier are deferred relative to the no-CADA counterfactual. The analysis measures the value of these delayed benefits rather than treating the full value of the underlying investment as lost.
At EU27 level, the estimated opportunity cost of postponed digitalisation amounts to approximately €150 million under the Narrow scenario, €1.9 billion under Medium and €6.1 billion under Broad. The sharp increase from Narrow to Medium reflects several scenario assumptions changing simultaneously. The share of affected workloads assigned to UAL3–4 doubles from 10 per cent to 20 per cent, the share of exposed projects assumed to encounter a binding CADA-related constraint rises from 5 per cent to 15 per cent, and the average additional delay for those constrained projects increases from six months to one year. Because these parameters interact multiplicatively, the resulting public-sector postponement effect rises by roughly a factor of twelve between Narrow and Medium.[1]
Under the Medium scenario, around €1.8 billion of the estimated effect arises in the public sector and approximately €90 million in the private sector. The public-sector calculation draws on a broad benchmark of potential cloud and cloud-enabled AI productivity gains in public services. The private-sector calculation is more narrowly constrained: it covers only relevant high-criticality sectors potentially affected through Article 31 and, for productivity effects, only the 20 per cent of technology-exposed activity assumed to enter a material investment, expansion or renewal cycle in a given year. The private estimate is therefore subject to several additional filters before a postponed benefit is recorded.
The economic significance of such delays extends beyond individual IT projects. Cloud and AI investments increasingly support wider organisational change, including automation, data integration, new digital services and the adoption of AI-enabled tools. Delaying the underlying infrastructure or software can therefore postpone complementary investments and productivity improvements elsewhere in the organisation.
The effect of delayed cloud and AI adoption can also have an important dynamic dimension. During the period in which affected organisations wait for qualifying alternatives to become available, firms and public-sector organisations outside the affected European regulatory environment may continue to adopt new services, accumulate complementary capabilities and move further along the technological frontier. The estimates reported here therefore remain deliberately conservative because they capture the value of delayed benefits rather than assuming that postponed projects are permanently cancelled.
Table 14: Selected Member State postponed digitalisation, public and affected private sectors combined (€ million)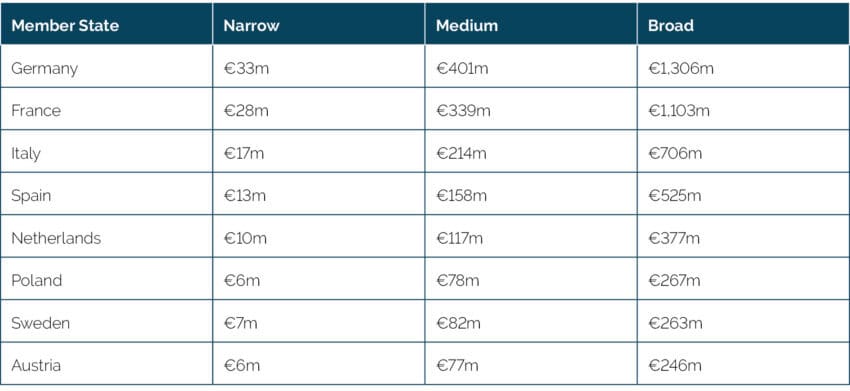 Source: ECIPE calculations. Note: Figures show the estimated value of cloud and AI productivity benefits postponed by CADA-related delays in the public sector and affected private high-criticality sectors. They measure the value of delayed benefits rather than the value of the underlying investment and assume that postponed projects are ultimately implemented.
For public services, the analysis uses benchmark estimates of the operating savings and productivity gains associated with cloud and cloud-enabled AI adoption in government. It applies a 2.24 per cent general cloud-productivity benchmark to the relevant public activity.[2] For private high-criticality sectors, the model links cloud and AI exposure to sectoral value added rather than treating cloud expenditure itself as the productivity base. The AI component applies a 4 per cent productivity benchmark only to AI-exposed activity.[3] [4] An important conservative feature of the modelling is that projects are assumed to be postponed rather than permanently cancelled. The resulting estimates therefore capture a timing loss rather than the permanent disappearance of the associated productivity gains.
[1] The Narrow-to-Medium increase is largely mechanical rather than the result of a discontinuity in the underlying economic base. For the public-sector channel, doubling the UAL3–4 share (10% to 20%), tripling the binding-constraint share (5% to 15%) and doubling the conditional delay (0.5 to 1 year) produces an approximately twelve-fold increase in the value of postponed benefits, all else equal. The binding-constraint share is the proportion of otherwise planned, CADA-exposed projects for which suitable qualifying cloud capacity or functionality is assumed to be unavailable at the intended time of adoption, resulting in an additional delay.
[2] Jin and Bai (2022). Cloud Adoption and Firm Performance: Evidence from Labor Demand. Available at https://papers.ssrn.com/sol3/papers.cfm?abstract_id=4082436
[3] ECIPE (2025), Boosting Efficiency and Quality in EU Public Services: The Need for a European Multi-Cloud-First Strategy, ECIPE Occasional Paper No. 04/2025. Available at: https://ecipe.org/publications/boosting-efficiency-and-quality-in-eu-public-services-egovernment/
[4] European Investment Bank (2026), AI adoption, productivity and employment: Evidence from European firms, EIB Working Paper 2026/02. Available at https://www.eib.org/en/publications/20250383-economics-working-paper-2026-02
8. Europe’s Own Cloud and Technology Suppliers are Also Part of the Adjustment
CADA would not only reallocate demand between European and non-European cloud providers. It could also affect European software developers, systems integrators, cybersecurity companies, data-service providers and managed-service firms that serve public authorities or customers in high-criticality sectors. The relevant question is not simply where the customer-facing supplier is established, but which technologies and services sit underneath the final product.
A European supplier can be established and controlled in the EU while using non-EU infrastructure, databases, identity services, AI tools or software components. This layered structure is also visible in public procurement. A forthcoming ECIPE analysis of 8,725 cloud-related awarded lots across nine Member States finds that awards overwhelmingly go to domestically registered prime contractors, while many of those firms rely on US-origin cloud infrastructure underneath the contract. The nationality of the prime contractor therefore does not necessarily identify the origin of the underlying technology stack.[1]
8.1 Measuring European Technology-Supplier Exposure
The model starts with more than 25,000 relevant EU ICT firms with at least 20 employees and applies three successive filters. First, Eurostat data show that approximately 79 per cent of enterprises in the information and communication sector used sophisticated or intermediate cloud services in 2025; this is used as the cloud-dependency proxy. Second, the model assumes that 85 per cent of these cloud-dependent ICT vendors rely materially on at least one non-EU cloud, software or platform input, informed by evidence on Europe’s dependence on non-EU cloud and software providers. Third, because no harmonised EU data identify the share of ICT vendors materially serving government or high-criticality NIS2 customers, the model applies a central customer-exposure assumption of 25 per cent.[2] [3]
On this basis, the model identifies approximately 62 vendor equivalents exposed to adjustment under Narrow, 246 under Medium and 561 under Broad. The corresponding annual value added associated with these potentially affected activities is estimated at €1.2 billion, €4.7 billion and €10.8 billion, respectively. These figures measure activity exposed to potential technology substitution or redesign, not the number of firms expected to exit the market or the amount of value added expected to be lost.
Table 15: Selected Member State technology-supplier exposure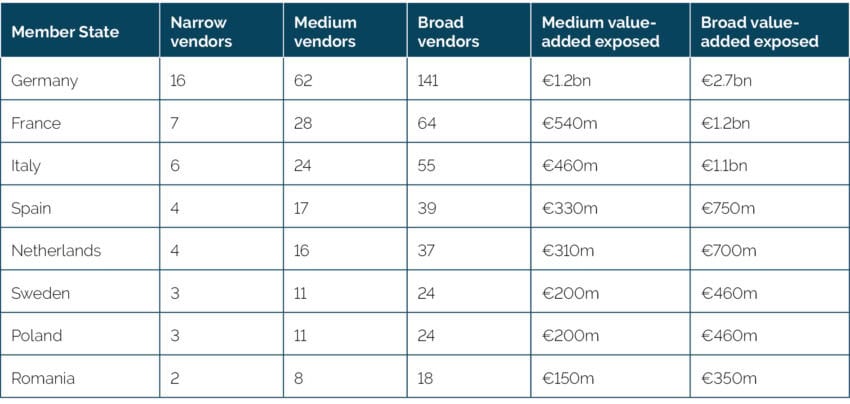 Source: ECIPE calculations. Note: Vendor counts are modelled vendor equivalents rather than identified individual firms. Value-added figures measure annual activity exposed to potential redesign or technology substitution and are not estimates of lost output.
8.2 European Technology-Supplier Exposure and Potential Output Effects
The value-added estimates should not be interpreted as forecasts of revenue destruction, firm exit or GDP loss. Suppliers can respond in several ways, including redesigning products, changing infrastructure providers, forming new partnerships, absorbing part of the additional cost, adjusting prices or withdrawing from selected contracts. The indicator answers a narrower question: how much European technology activity is located in parts of the market where input substitution or redesign may become necessary?
Eurostat estimates that EU ICT services generated more than €697 billion of value added in 2023. The vendor model focuses on software publishing, computer programming and consultancy, and data processing and hosting, which together account for around 71 per cent of ICT-services value added.[4] The estimated exposure is therefore small relative to the sector as a whole. It nevertheless identifies a specific channel through which requirements intended to reduce dependence on non-EU technology providers can also impose adjustment costs on European suppliers that rely on those technologies as inputs.
Whether exposure ultimately translates into lower output depends on the availability and cost of substitute technologies, the ability of suppliers to redesign their products, the time available for adjustment and the extent to which additional costs can be passed through to customers. The exposure measure should therefore be interpreted as an indicator of potential adjustment pressure rather than as a direct estimate of economic loss.
[1] ECIPE (2026, forthcoming). A Single Market Approach to Cloud Sovereignty. Note: The empirical analysis covers 8,725 cloud-related awarded lots across nine Member States between 2018 and 2025. Approximately 97% of awards, excluding the structurally cross-border GÉANT framework, went to domestically registered providers, while domestic winners frequently rely on US cloud infrastructure underneath the prime contract. The study also documents specific domestic-prime structures around Azure, AWS, Google Cloud and Oracle.
[2] Eurostat (2026). Enterprises using sophisticated or intermediate cloud computing services, by economic activity, EU, 2025, dataset isoc_cicce_usen2. Available at https://ec.europa.eu/eurostat/databrowser/view/ISOC_CICCE_USEN2/default/table?lang=en&category=isoc.isoc_e.isoc_eb. Note: Eurostat reports that approximately 79% of enterprises in the information and communication sector used sophisticated or intermediate cloud computing services in 2025. The 85% non-EU technology-dependency parameter is an ECIPE modelling assumption informed by the European Parliament’s 2025 assessment of European software and cyber dependencies, which finds that roughly four-fifths of European cloud and software spending flows to non-European providers, as well as by evidence from European public procurement showing frequent reliance on non-EU cloud and platform technologies beneath European prime contractors. The 25% customer-exposure parameter is a separate ECIPE assumption because no harmonised EU dataset identifies the share of relevant ICT vendors materially serving public authorities or high-criticality NIS2 entities.
[3] European Parliament (2025). European Software and Cyber Dependencies. Available at https://www.europarl.europa.eu/thinktank/en/document/ECTI_STU(2025)778576 . The study finds deep dependence on non-EU providers across cloud, software and related digital technologies and estimates that roughly four-fifths of European cloud and software spending flows to non-European providers. AWS, Microsoft Azure and Google Cloud account for approximately 70% of European cloud infrastructure. The 85% parameter used here is an ECIPE modelling assumption informed by this broader evidence from European tenders and is tested at 70% and 90%.
[4] Eurostat (2026). ICT sector – value added, employment and R&D. Available at https://ec.europa.eu/eurostat/statistics-explained/index.php?title=ICT_sector_-_value_added,_employment_and_R%26D . EU ICT services generated more than €697 billion of value added in 2023. Computer programming and consultancy accounted for approximately 52% of ICT-services value added, software publishing 11% and data processing/hosting 8%, producing the 71% relevant-activity share used here.
9. Cross-Country Variation in Economic Exposure
The economic incidence of CADA varies across Member States because the size of the affected cloud market, existing national requirements, the scale of private-sector exposure, digital maturity and migration starting points differ substantially across the EU. A common EU-wide regulatory framework can therefore generate markedly different incremental effects across national economies.
Under the Medium scenario, estimated exposure amounts to approximately €16.2 billion in both France and Germany, €12.8 billion in Italy and €12 billion in Spain. Poland accounts for around €8.5 billion and the Netherlands for €6.9 billion. Under the Broad scenario, the corresponding estimates rise to approximately €37.1 billion in Germany, €34 billion in France, €27.7 billion in Italy and €24.7 billion in Spain. These figures represent modelled national allocations of cumulative economic exposure rather than forecasts of public expenditure or budgetary outlays.
Absolute country totals and ratios to the working-age labour force answer different questions. Under Medium, Germany and France each account for approximately €16.2 billion of modelled 10-year economic exposure, but the corresponding estimates are approximately €396 and €534 per person in the working-age labour force, respectively. Several smaller Member States record larger per-person equivalents because their modelled exposure is relatively high in comparison with their resident labour force. These are model-derived differences that reflect country expenditure assumptions, existing regulatory baselines and the scenario treatment of private essential-sector activity. They should not be interpreted as actual costs levied on individuals, and cross-border labour markets, especially Luxembourg’s, complicate a strict comparison of resident labour-force denominators.
9.1 Drivers of Cross-Country Variation
The heterogeneity of the national estimates can be traced primarily to five structural and regulatory factors:
- Public cloud expenditure: Member States with larger public sectors and higher levels of digitalisation have a larger expenditure base potentially affected by CADA requirements.
- Existing national requirements: Pre-existing sovereignty, security, localisation and certification requirements reduce the incremental effect of CADA where they already impose constraints comparable to those represented in the model.
- Private-sector exposure: The number and economic significance of organisations operating in high-criticality sectors affect the scale of potential exposure through Article 31.
- Migration starting point: Member States in which a larger share of workloads has already moved to government-controlled, certified or otherwise qualifying environments face lower additional migration requirements.
- Digital maturity: More digitally advanced administrations and firms have a larger stock of existing and planned cloud- and AI-enabled activity, increasing both the potential adjustment burden and the value of benefits that may be postponed where implementation constrains adoption.
9.2 Public-Sector Incidence Across Levels of Government
CADA-related public-sector exposure is not confined to the central government. Depending on national administrative structures, affected contracting authorities can include central ministries and agencies, state or regional governments, municipalities, healthcare and educational bodies, social-security institutions and other public bodies. The distribution of economic incidence can therefore differ substantially across Member States and levels of government.
A harmonised EU27 dataset on ICT or cloud expenditure by government tier is not available. The study therefore allocates each Member State’s estimated Medium public-sector cumulative exposure across central government, state or regional government, local government and social-security funds using each subsector’s share of government compensation of employees in 2025. Compensation of employees provides a harmonised proxy for the relative administrative and service-delivery scale of each tier. The resulting figures should therefore be interpreted as incidence estimates rather than observed cloud expenditure by government level.
The allocation also reflects differences in national administrative structures. In several unitary Member States, Eurostat does not identify a separate state-government subsector. A zero allocation to state or regional governments therefore does not indicate missing data or the absence of subnational administration. Relevant functions are generally recorded within the local-government subsector. By construction, the four government-level allocations sum to each Member State’s public-sector total and do not alter the national exposure estimate.
Table 16: Estimated allocation of Medium public-sector cumulative exposure by Member State and government level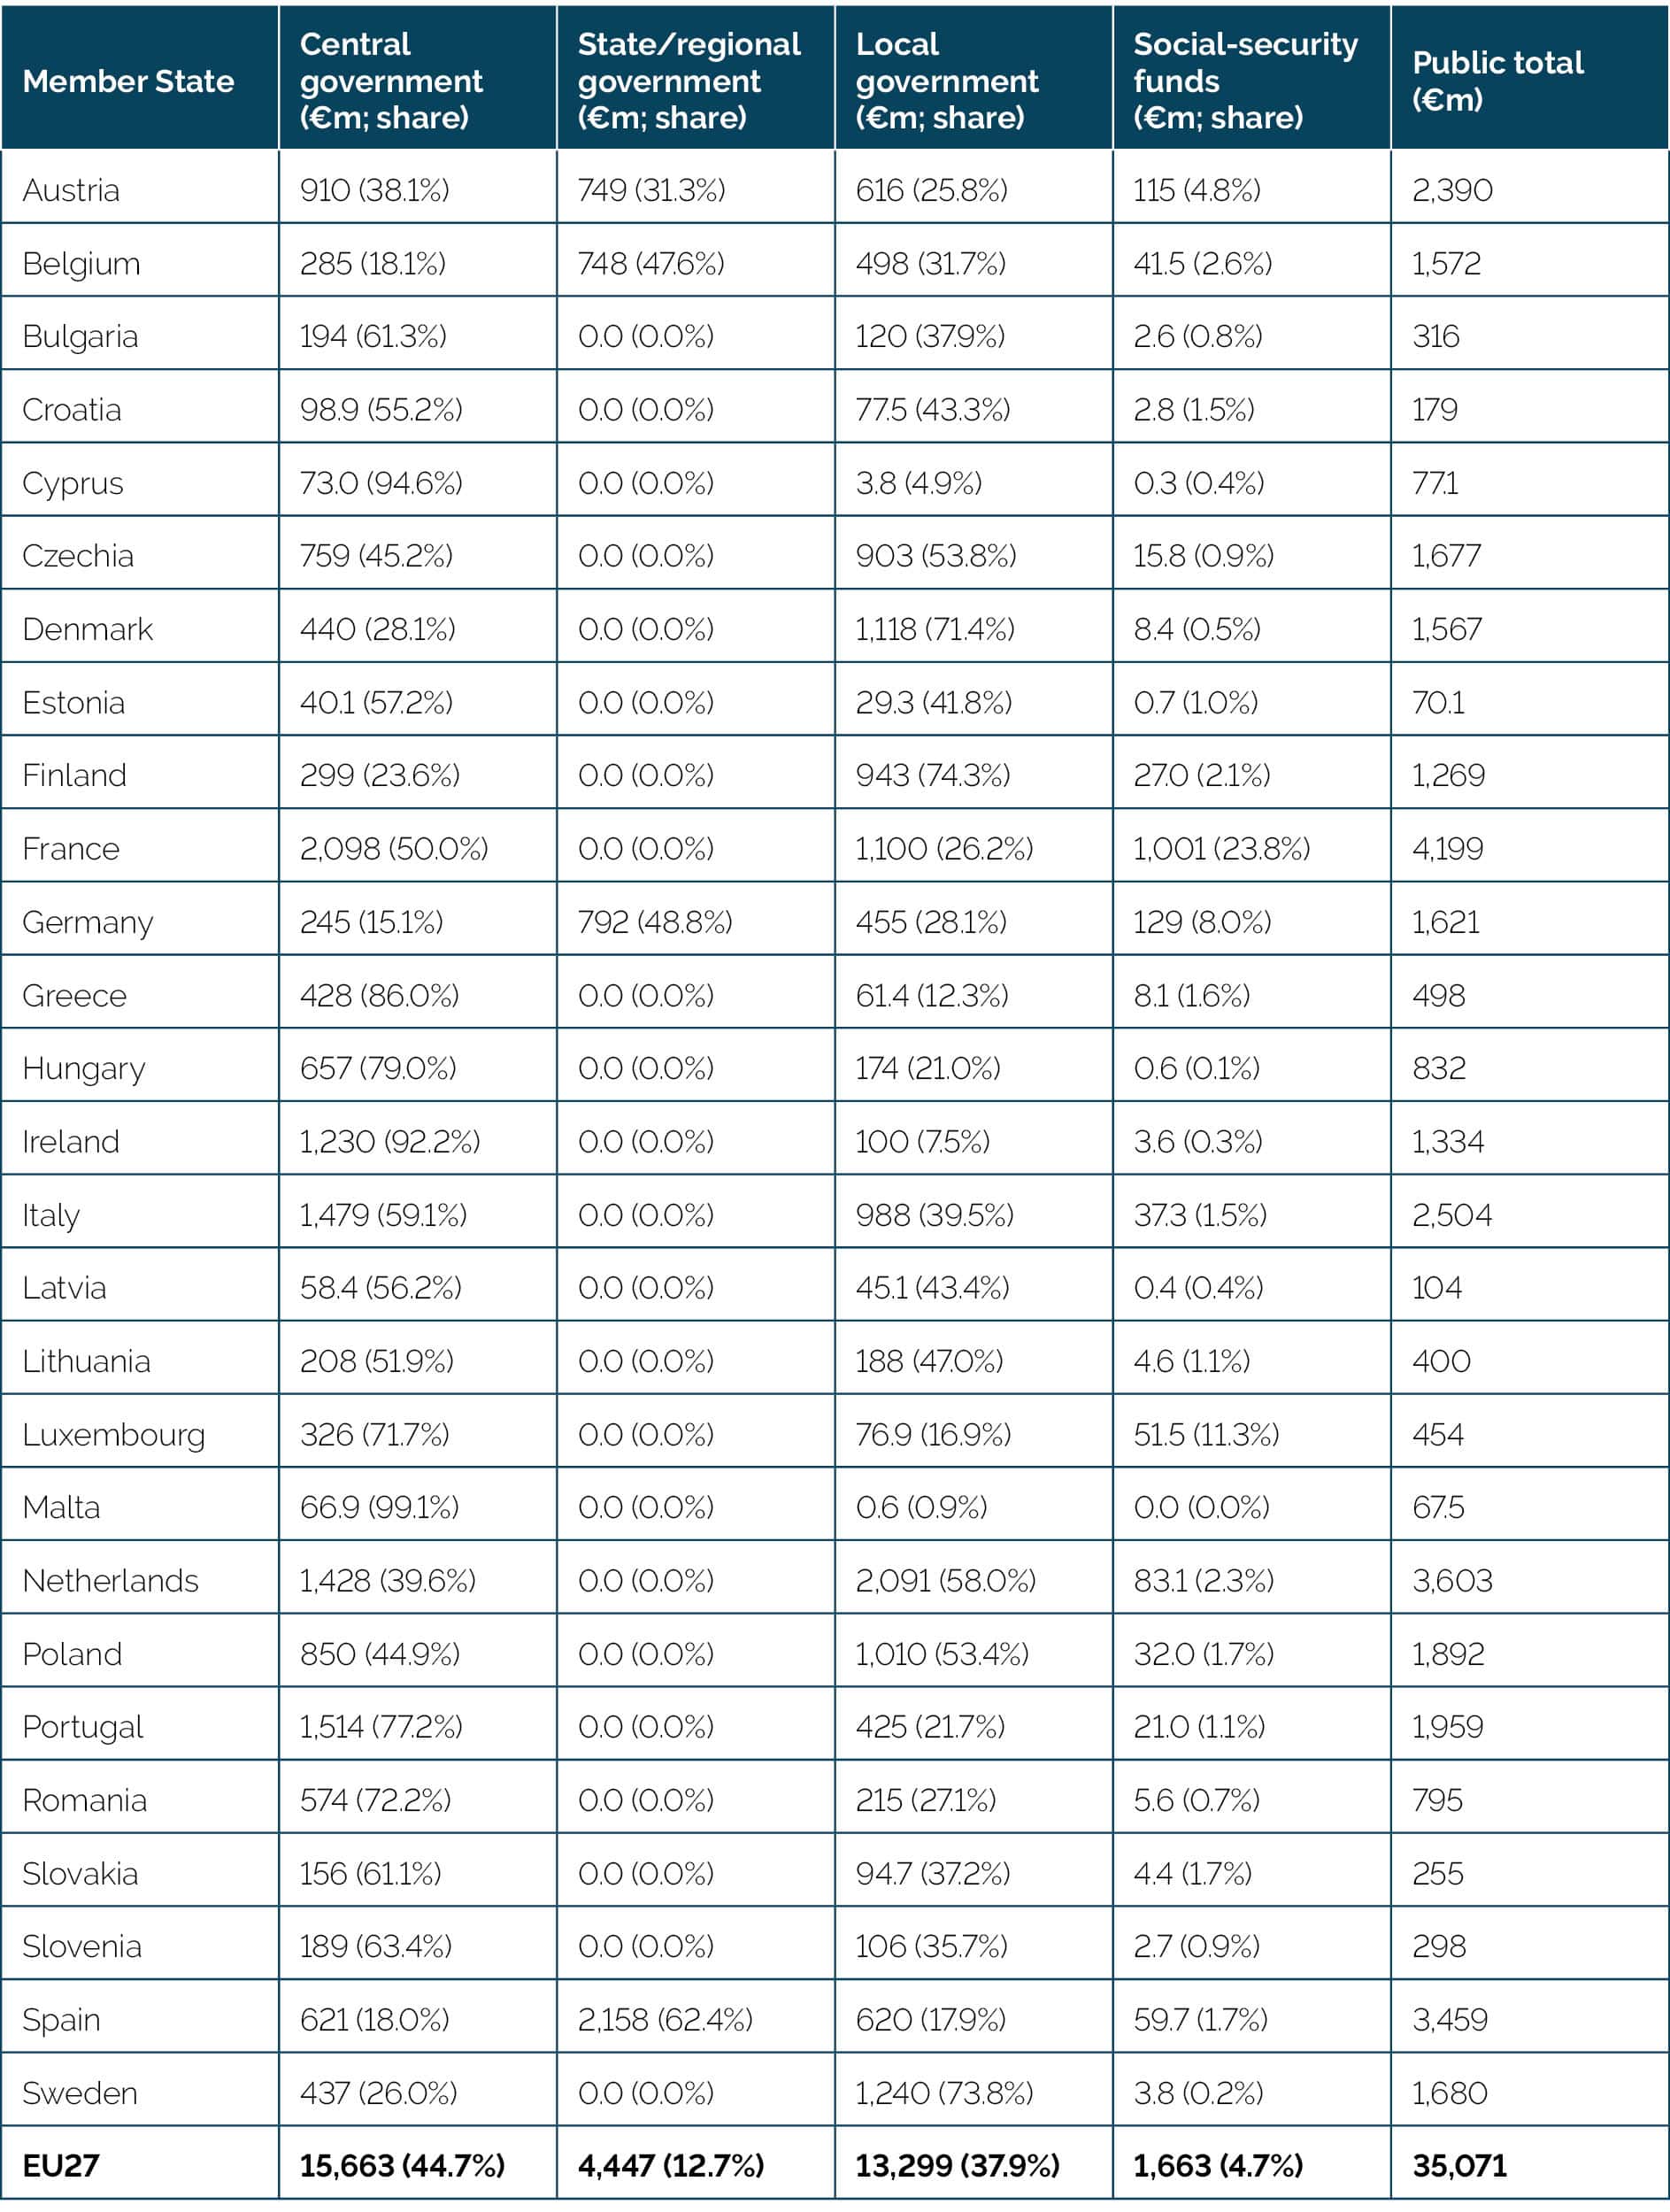 Source: ECIPE calculations. Note: Monetary values are expressed in € million. Values of €100 million or more are rounded to the nearest € million; values below €100 million are shown to one decimal place. Shares are shown to one decimal place. A zero allocation to state/regional government reflects the absence of a separately identified ESA state-government subsector rather than missing data. The allocations are based on 2025 compensation of employees and should be interpreted as indicative incidence estimates rather than observed cloud expenditure by government level.
The allocation reveals substantial differences in where public-sector exposure may arise. In Germany, Belgium and Spain, a large share is associated with separately identified state or regional governments. By contrast, local governments account for the majority of the allocation in Denmark, Finland, the Netherlands and Sweden. At EU27 level, the central government accounts for approximately 44.7 per cent of Medium public-sector cumulative exposure, while state/regional and local governments together account for just over half.
This distribution matters for implementation capacity. Regional and local authorities may be subject to comparable assurance requirements while operating with smaller procurement, legal, cybersecurity and cloud-specialist teams than central government. The administrative incidence of implementation may therefore extend considerably beyond central ministries even where the formal regulatory framework is uniform.
9.3 National Baselines Can Vary Within Countries
Germany illustrates the point. Federal cloud use is shaped by BSI minimum standards and the Deutsche Verwaltungscloud strategy, but this does not imply that every Land, municipality, hospital or public-law body begins from an identical cloud-sovereignty baseline. A national coefficient can therefore provide a reasonable central modelling approximation while still requiring caution when interpreting incidence across individual public-sector institutions.[1]
Italy and Spain illustrate a different pattern. Both apply national classification and security frameworks that differentiate services or systems according to criticality, but these categories are not one-to-one equivalents of the CADA Union Assurance Levels. Italy distinguishes ordinary, criticality and strategic services within its cloud strategy, while Spain applies the Esquema Nacional de Seguridad across a broad public-sector system base. These frameworks indicate that enhanced requirements can extend beyond central ministries without implying that the same proportion of workloads would necessarily fall into UAL3 or UAL4.[2] [3]
Country totals should therefore be interpreted as national exposure envelopes. The government-level allocation indicates where public-sector incidence may fall, while the country-specific regulatory baselines determine the incremental effect attributed to CADA. Detailed assumptions on national baselines and the government-level allocation are provided in the Technical Annex.
[1] BSI (2026). Mindeststandard des BSI zur Nutzung externer Cloud-Dienste. Available at https://www.bsi.bund.de/DE/Themen/Oeffentliche-Verwaltung/Mindeststandards/Externe_Cloud-Dienste/Externe_Cloud-Dienste_node.html ; IT- Planungsrat (2021). AG Cloud Computing und Digitale Souveränität. Available at https://www.it-planungsrat.de/beschluss/beschluss-2021-09 ; Deutsche Verwaltungscloud -Strategie. Available at https://www.it-planungsrat.de/beschluss/beschluss-2021-46 ; BSI (2026). C3A – Criteria enabling Cloud Computing Autonomy. Available at https://www.bsi.bund.de/EN/Themen/Unternehmen-und-Organisationen/Informationen-und-Empfehlungen/Empfehlungen-nach-Angriffszielen/Cloud-Computing/C3A/C3A_node.html
[2] Government of Italy, Dipartimento per la trasformazione digitale (2026). Strategia Cloud Italia – Gli indirizzi strategici per la Pubblica Amministrazione . Available at https://innovazione.gov.it/dipartimento/focus/strategia-cloud-italia/
[3] Government of Spain, Ministerio de Asuntos Económicos y Transformación Digital (2022). Real Decreto 311/2022, de 3 de mayo, por el que se regula el Esquema Nacional de Seguridad . Available at https://boe.es/buscar/doc.php?id=BOE-A-2022-7191
10. Wider Macroeconomic Impacts
The preceding sections estimate the direct and intermediate economic adjustments from CADA, including higher cloud-service costs, migration and software redesign, delayed digitalisation and constraints on the availability of qualifying services. These estimates identify the principal adjustment channels and their economic incidence. They do not, however, capture how these effects propagate through the wider economy through changes in production, trade, investment and the allocation of labour and capital.
To assess these broader effects, the study complements the bottom-up analysis with a computable general equilibrium (CGE) model of the EU economy. The purpose of the CGE analysis is not to translate the cumulative exposure estimates mechanically into GDP losses. Rather, it examines how selected CADA-related constraints affect economic activity once firms, consumers and factor markets adjust across sectors and Member States.
10.1 Methodological Approach
The modelling starts from the same Narrow, Medium, Broad and Stress scenarios used throughout the study. For each scenario, the underlying economic mechanisms are translated into changes in the conditions represented in the general equilibrium model. Three channels are particularly important.
- First, restrictions affecting access to existing cloud and digital services alter the effective availability and cost of digital inputs sourced from outside the EU. The model captures the resulting adjustment in trade and the extent to which firms substitute between alternative sources of digital services.
- Second, delays in cloud and AI adoption reduce the efficiency with which affected sectors can use digital inputs during the transition. This channel captures the productivity consequences of postponing otherwise economically viable digitalisation rather than assuming that the underlying investment or its benefits are permanently lost.
- Third, changes in input availability, relative prices and competitiveness propagate across sectors and Member States. Firms adjust production, sourcing and investment, while labour and capital are reallocated between activities. The resulting macroeconomic effects therefore reflect both the initial digital-sector constraints and the wider adjustments that follow from them.
The model is calibrated at Member State level. Differences in estimated outcomes therefore reflect not only the scale of the initial CADA-related adjustment, but also differences in economic structure, trade exposure, sectoral composition and the ability of firms and factors of production to adjust.
The results are expressed as changes in the level of real GDP relative to the corresponding no-CADA counterfactual. They are not cumulative ten-year losses and should not be added to the study’s bottom-up estimates of cumulative economic exposure.[1]
10.2 Macroeconomic Results
Table 17 reports the estimated change in real GDP for each Member State in both percentage and absolute terms. The magnitude of the estimated effects increases as the scope and restrictiveness of the implementation scenario increase. At EU27 level, real GDP is estimated to be approximately 0.012 per cent below the no-CADA baseline under the Narrow scenario, 0.046 per cent under Medium and 0.104 per cent under Broad. These correspond to modelled differences in the level of real GDP of approximately €2.1 billion, €8.5 billion and €19.4 billion, respectively. Under the Stress sensitivity, the estimated difference increases to approximately 0.146 per cent of EU27 GDP, or €27.2 billion.
These figures represent differences in the level of real GDP once the modelled adjustment has worked through the economy. They should not be interpreted as cumulative losses over the 2027–2036 assessment period and should not be added to the €35.6 billion, €115 billion and €233 billion bottom-up estimates.
Table 17: Estimated change in real GDP relative to the no-CADA baseline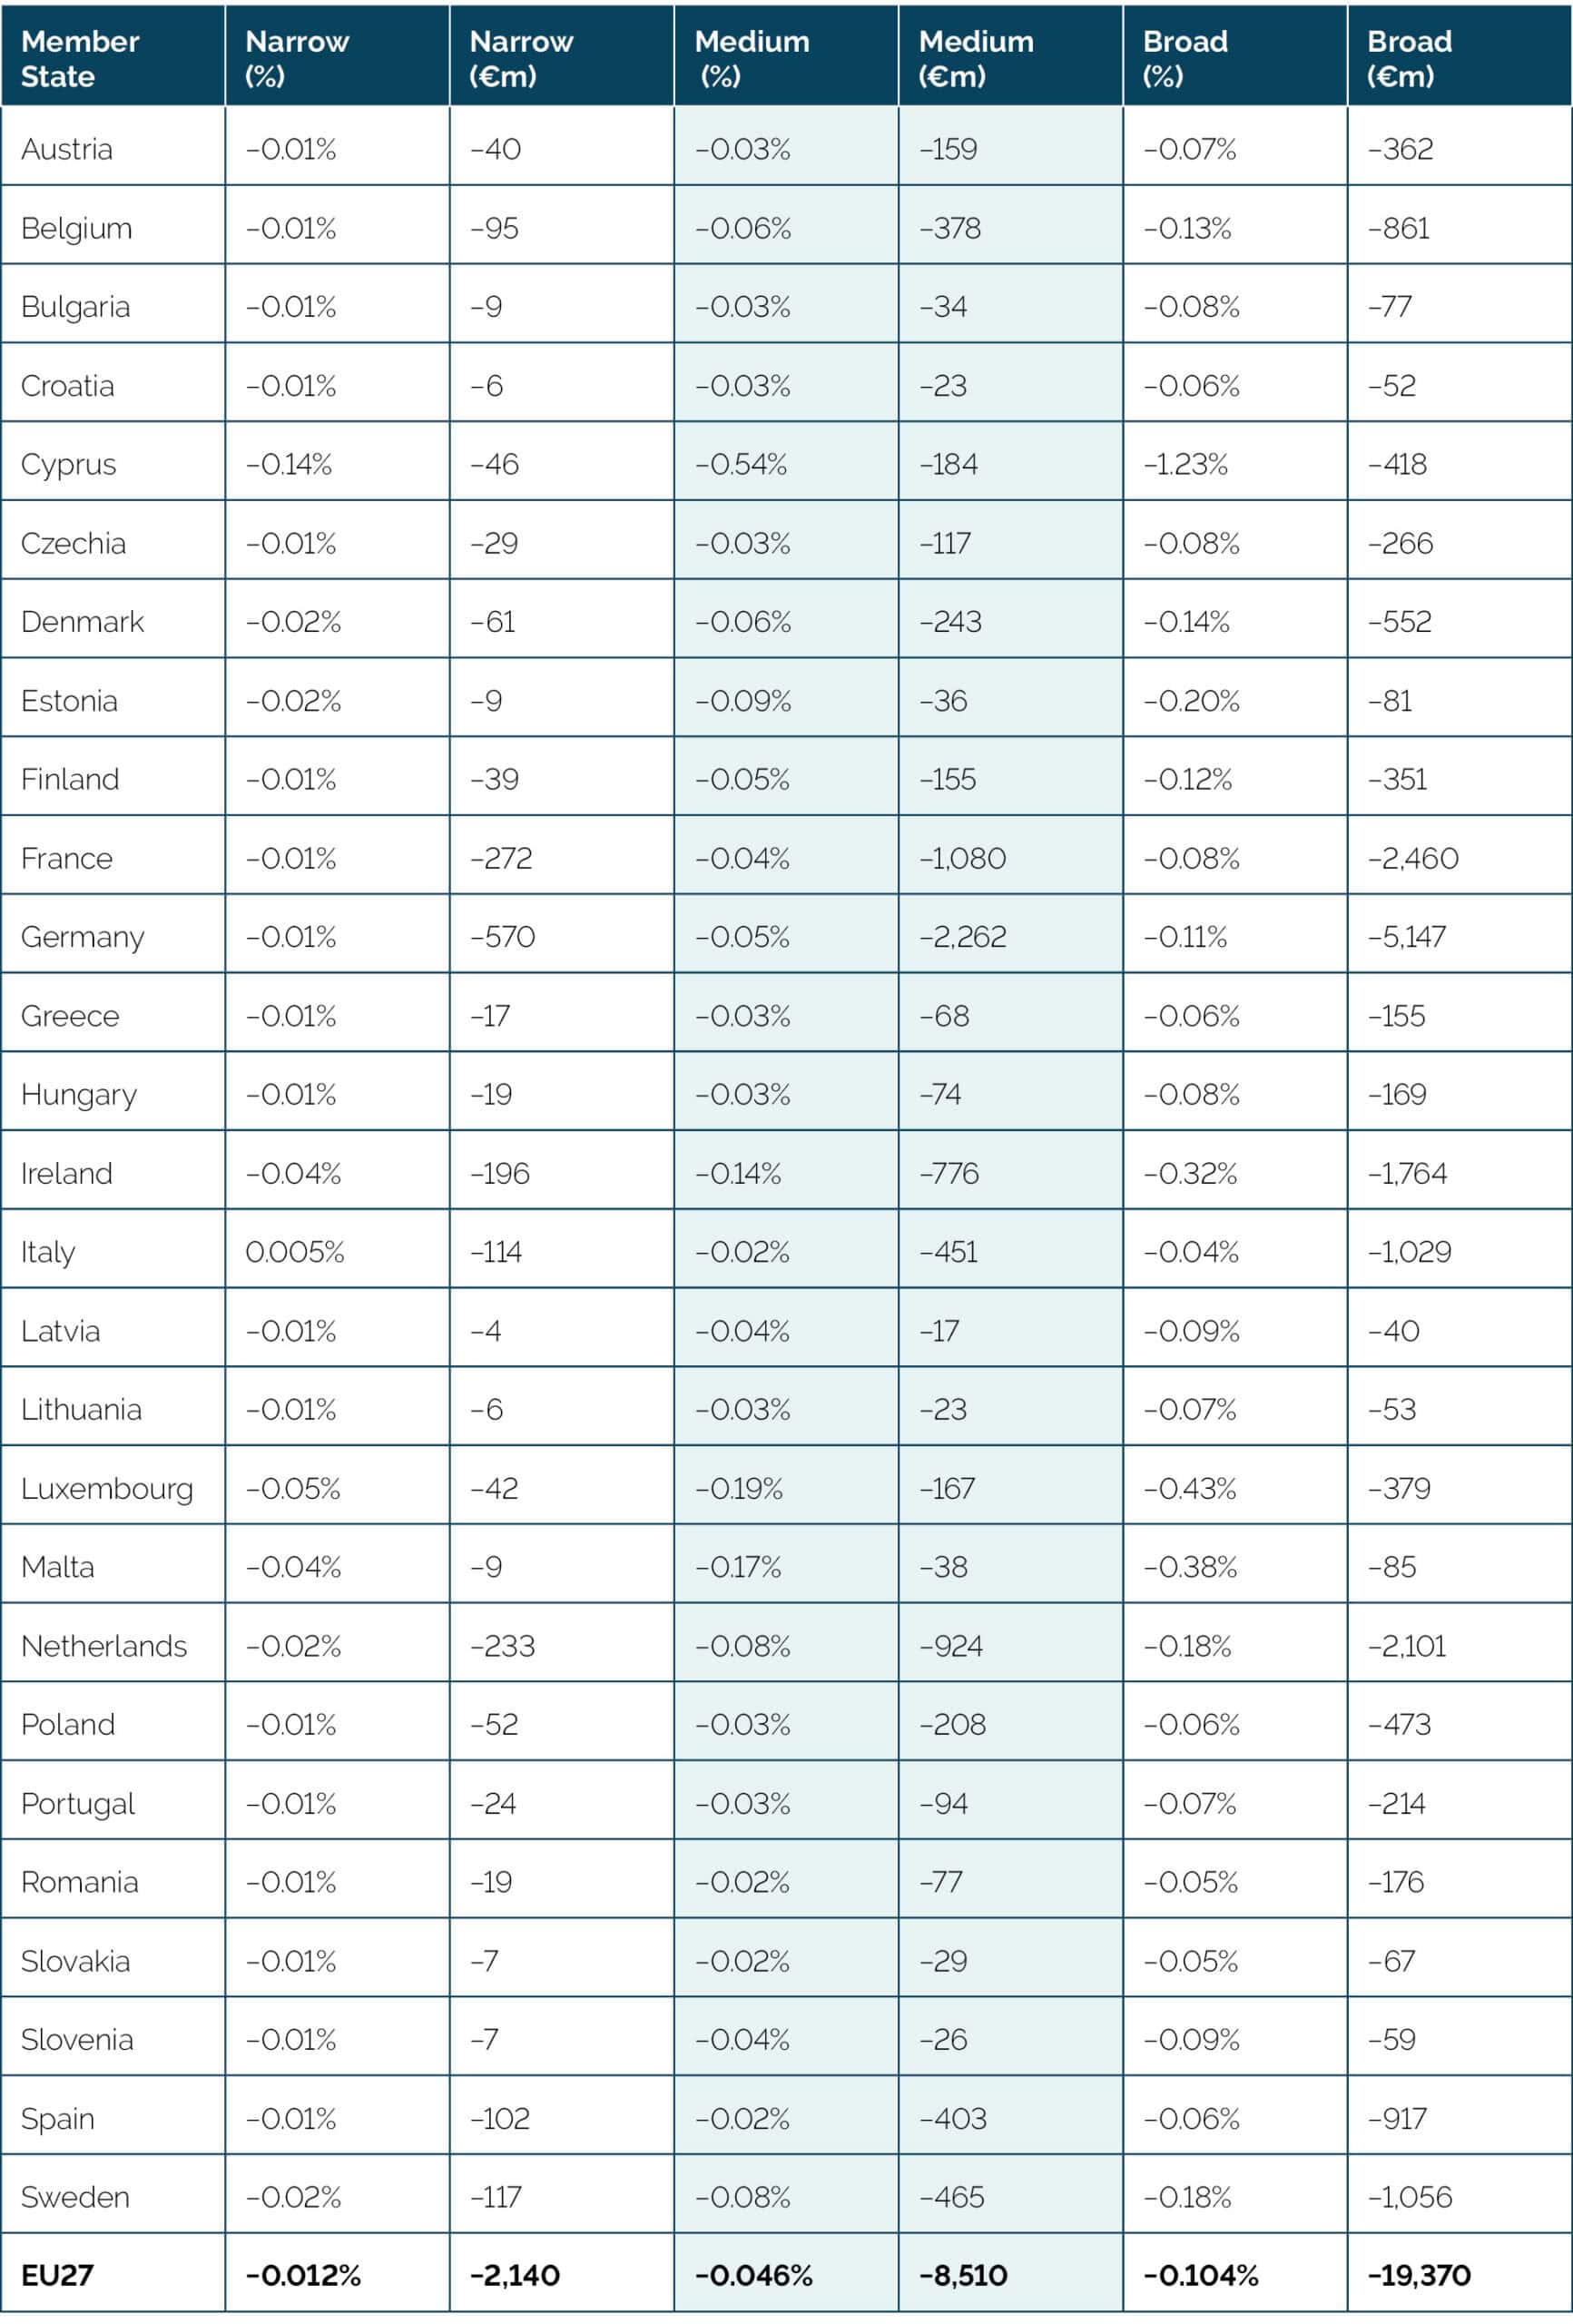 Source: ECIPE CGE calculations. Note: Absolute GDP changes are derived directly from the difference between scenario and baseline real GDP and are expressed in constant model-year euro values. They represent changes in the level of real GDP once the modelled adjustment has worked through the economy, rather than cumulative losses over the ten-year assessment period. The CGE results therefore measure a different economic concept from the bottom-up estimates of cumulative economic exposure and should not be added to them. EU27 percentage effects are reported to three decimal places because the aggregate model results are available at that precision; Member State percentages are shown to two decimal places.
The results also reveal substantial variation across Member States. The magnitude of the estimated effect is not determined by economic size alone. Larger economies account for a substantial share of the absolute EU-wide change in GDP, while several smaller and highly open economies experience larger effects relative to the size of their economies. Under the Medium scenario, for example, the estimated GDP effect is around 0.19 per cent in Luxembourg, 0.17 per cent in Malta, 0.14 per cent in Ireland and 0.09 per cent in Estonia, compared with approximately 0.05 per cent in Germany, 0.04 per cent in France and 0.02 per cent in Italy and Spain.
These differences reflect the interaction between the initial CADA-related constraints and the structural characteristics of national economies. Relevant factors include exposure to cross-border digital-service trade, the sectoral composition of production, reliance on affected digital inputs and the capacity of firms to substitute between suppliers and technologies. The country results should therefore not be interpreted as proportional allocations of the EU-wide effect. They are endogenous outcomes of the modelled adjustment in each economy.
10.3 Reallocation Across Sectors
The sectoral results help explain why aggregate GDP can decline even where activity expands in parts of the digital economy. Higher demand for qualifying cloud and communications capacity increases activity in the communications sector. Under the Broad scenario, communications-sector output and exports increase in 26 of the 27 Member States.[2] At the same time, output declines across most of the other sectors represented in the model.
This pattern reflects a reallocation of productive resources rather than a simple contraction in economic activity. Expanding qualifying digital capacity requires capital, skilled labour and other inputs that have alternative uses elsewhere in the economy. Where those resources are scarce, additional activity in communications and related digital services can therefore partly displace production and investment in other sectors. Expansion of the directly affected sector does not necessarily translate into an equivalent increase in economy-wide productive capacity.
This distinction is also important for interpreting the supply-side estimates presented earlier in the study. Additional investment in qualifying capacity creates productive assets and is therefore not treated as a direct economic loss in the bottom-up calculation. In the general equilibrium model, however, the labour and capital required to undertake that investment carry an opportunity cost because the same resources cannot simultaneously be employed in alternative activities. The CGE analysis captures this wider reallocation mechanism.
The macroeconomic results therefore complement, rather than duplicate, the bottom-up analysis. The latter identifies the direct and intermediate economic adjustments associated with higher prices, migration, delayed adoption and constrained service availability. The CGE model captures how those changes affect the allocation of resources and economic activity across sectors and Member States. Taken together, the two approaches show that the economic consequences of CADA depend not only on the direct cost of compliance, but also on the extent to which implementation changes access to digital inputs and redirects productive resources across the European economy.
[1] Detailed information on the model specification, calibration of the digital-service and productivity channels, sectoral aggregation and sensitivity analysis is provided in the Technical Annex.
[2] Cyprus stands out as the exception.
11. The Impact of Different Implementation Choices
This assessment does not monetise CADA’s potential security, resilience or strategic-autonomy benefits and therefore does not constitute a complete cost-benefit assessment or rank regulatory options. It does, however, identify the implementation parameters that most strongly influence the economic effects estimated in this study. Five are particularly important.
- The frequency of UAL3 and UAL4
UAL3 and UAL4 constrain the set of eligible providers and technology architectures more strongly than UAL1 and UAL2. In the model, increasing the share of affected workloads assigned to UAL3–4 raises recurring price effects, migration and redesign requirements, qualifying-capacity demand and technology-supplier exposure. The Medium scenario assigns 20 per cent of affected workloads to UAL3–4, compared with 25 per cent under Broad and 35 per cent under the Stress sensitivity. The economic effect therefore depends materially on how frequently the higher assurance levels are applied in practice.
- The reach of Article 31 into private activity
Private-sector scope is the largest source of scale variation across the scenarios. The model assumes Article 31 coverage of 10 per cent under Narrow, 25 per cent under Medium and 50 per cent under Broad. Because the potential private-sector cloud base is substantially larger than the public-sector cloud base, changes in the share of private activity brought within the framework have a correspondingly large effect on total estimated exposure. Keeping public-sector and potential private-sector effects separate is therefore important for interpreting both the scale and the uncertainty of the results.
- The amount of transition time
Migration, certification, infrastructure expansion and software redesign all require time. Shorter implementation periods concentrate demand for qualifying services and can increase temporary scarcity, migration bottlenecks and implementation delays. Longer adjustment periods reduce the temporary transition effects represented in the model, although they do not remove recurring cost differences associated with the final assurance requirements. Transition time therefore affects the speed and concentration of the adjustment rather than the long-run regulatory requirements themselves.
- Whether the market remains contestable across borders
A common EU framework can support cross-border supply where qualification and recognition operate consistently across Member States. Conversely, differences in risk classification, national additional requirements or procurement practices can limit the extent to which suppliers compete across national markets. This distinction is relevant because public cloud procurement is already highly domestic at the prime-contractor level even where the underlying technology stack is international. The economic effects of CADA therefore depend not only on which providers qualify, but also on whether qualifying suppliers and technologies can serve customers across the Single Market.[1]
- How the capacity build-out is financed
The estimated investment required to expand qualifying physical capacity – including data-centre facilities, servers, networking equipment and associated infrastructure – is small relative to migration and redesign costs, but financing arrangements affect the distribution of fiscal exposure. Under the illustrative 20 per cent public-support case, potential public financing amounts to approximately €190 million under Medium and €590 million under Broad. Under the one-third support sensitivity, the corresponding values rise to around €310 million and €990 million. These figures are financing scenarios rather than forecasts of government expenditure and should not be interpreted as additional economy-wide resource costs.
Across these dimensions, the model shows a consistent relationship between implementation design and estimated economic exposure: wider coverage, more frequent use of higher assurance levels and tighter transition constraints produce larger adjustments under the assumptions used in the study. The scenarios are intended to make this sensitivity transparent. They do not determine the regulatory choice, but they show which design parameters have the greatest influence on the economic outcomes examined here.
[1] ECIPE (2026, forthcoming). A Single Market Approach to Cloud Sovereignty. Contracts invoking the newer sovereignty framing were 100% domestically awarded in the observed sample, while sole-bidder incidence increases from approximately 28% in contracts without sovereignty language to 46% under the new framing. The study further finds that the observed sole-bidder awards under the newer framing were concentrated among large established incumbents rather than new cloud entrants.
12. Conclusions and Implications for the Assessment of CADA
This study finds that the economic effects associated with CADA depend strongly on the scope of the framework and on the frequency with which higher Union Assurance Levels are applied. Estimated 10-year cumulative economic exposure ranges from €35.6 billion under the Narrow scenario to €115 billion under Medium and €233 billion under Broad. A separate Stress sensitivity increases the estimate to approximately €327 billion. These scenarios show how the scale of adjustment changes as a larger share of public and private activity becomes subject to more demanding assurance requirements.
These are large magnitudes relative to the EU’s existing technology and innovation programmes. The €115 billion Medium-scenario exposure exceeds the entire €93.5 billion Horizon Europe budget for 2021–2027, while the €33.3 billion direct public-budget component alone is of the same order of magnitude as the public investment mobilised under major EU technology-sovereignty initiatives. It amounts to roughly three-quarters of the €43 billion-plus public-investment benchmark associated with the Chips Act and more than three times the public funding currently envisaged for AI Gigafactories.
The composition of the estimates is particularly important. Under the Medium scenario, migration, software rewriting and system redesign account for approximately €79.1 billion, or around 69 per cent of the central cumulative estimate. Recurring cloud-price effects contribute around €34 billion, while postponed digitalisation accounts for approximately €1.9 billion. The principal economic adjustment therefore arises not from infrastructure prices alone, but from the need to modify existing technology architectures when software, platform services, subcontractors or other dependencies no longer satisfy the applicable requirements.
This also means that physical cloud capacity is an incomplete measure of the adjustment required. Qualifying compute and storage capacity may be available while equivalent databases, cybersecurity services, AI tools, platform services or managed-service functionality are not. The economic effects therefore depend on the availability of credible substitutes across the full cloud-service stack and on the cost and time required to migrate or redesign affected applications.
Two parameters are especially important for the overall scale of the results. First, a higher share of workloads assigned to UAL3 and UAL4 increases recurring costs, migration requirements, qualifying-capacity demand and technology-supplier exposure. Second, the potential application of Article 31 to private organisations in high-criticality sectors substantially increases total exposure because the private-sector cloud base is considerably larger than the public-sector base. Under the Medium scenario, private-sector activity accounts for around 70 per cent of cumulative exposure.
The macroeconomic analysis identifies an additional channel. EU27 real GDP is estimated to be approximately 0.012 per cent below the no-CADA baseline under Narrow, 0.046 per cent under Medium and 0.104 per cent under Broad. These are changes in the level of real GDP rather than cumulative ten-year losses and should not be added to the bottom-up exposure estimates. The sectoral results indicate that expansion of qualifying communications capacity can involve a reallocation of labour and capital from other activities, so additional investment in the affected sector does not necessarily translate into an equivalent increase in aggregate output.
The results also show that economic exposure extends into Europe’s own technology sector. European software developers, systems integrators and managed-service providers may themselves rely on non-EU infrastructure, software and other technology inputs. The estimated €4.7 billion of annual European technology-sector value added exposed under Medium and €10.8 billion under Broad therefore represent activity potentially subject to redesign or substitution rather than expected output losses.
Overall, the economic assessment of CADA depends critically on the distribution of workloads across assurance levels, the practical reach of Article 31 and the availability of substitutable technologies across the full cloud-service stack. These factors determine the scale of migration and redesign, the availability of qualifying services, the exposure of European technology suppliers